


The Resource Allocation KPI Dashboard in Excel is an essential tool for businesses and organizations looking to optimize the allocation and management of resources. Whether you’re managing human resources, equipment, or budget, this customizable dashboard allows you to track your resource utilization and ensure that your organization is maximizing efficiency.
This easy-to-use Excel template enables real-time monitoring of resource allocation across various departments or projects. With visual insights and interactive charts, you can easily identify areas of resource shortages or overages, enabling better decision-making and improving overall operational efficiency.
Key Features of the Resource Allocation KPI Dashboard in Excel
📊 Comprehensive Resource Tracking
Track all types of resources, including human, financial, and material resources. Monitor how resources are allocated across different projects, departments, or business units.
⚡ Real-Time Resource Monitoring
Get up-to-date information on resource usage. Monitor resource allocation across multiple projects and identify where adjustments are needed to meet deadlines or efficiency goals.
📈 Resource Allocation Performance Metrics
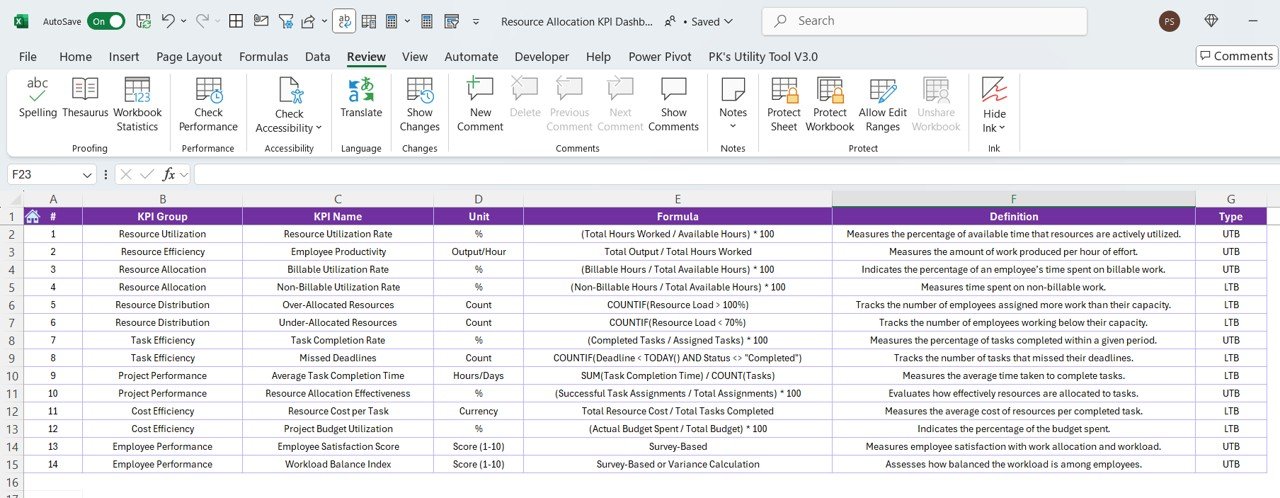
Track key performance indicators (KPIs) like resource utilization rate, cost per resource, and project completion time. Measure how well resources are being utilized and optimize their allocation.
📅 Project & Department Tracking
Organize resource allocation by project or department and ensure that every team is working efficiently with the resources available. Avoid overburdening specific departments while underutilizing others.
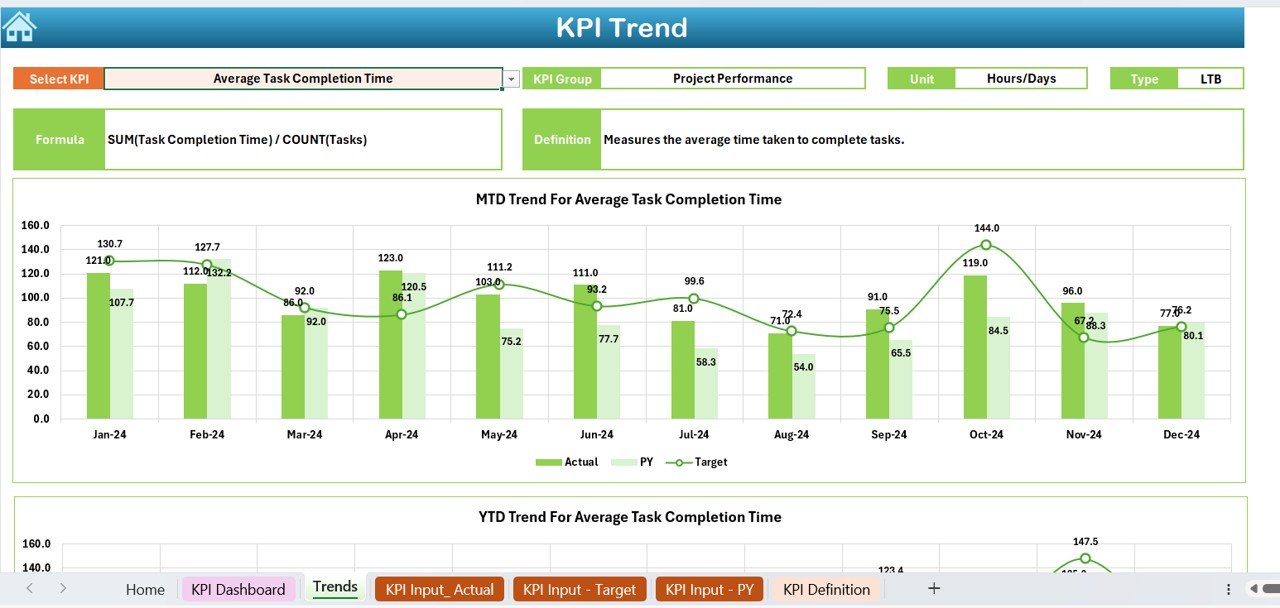
🖥️ Interactive Dashboard with Visual Insights
Visualize your resource allocation metrics through interactive charts and graphs, helping you identify trends, inefficiencies, and areas for improvement.
Why You’ll Love the Resource Allocation KPI Dashboard
✅ Track Resource Utilization Effectively
Monitor how resources are being used across various projects or departments to ensure that nothing is underutilized or overused.
✅ Optimize Resource Allocation
Use real-time data and performance metrics to ensure that resources are being allocated where they are most needed, improving project timelines and productivity.
✅ Visualize Key Resource Metrics
Track essential KPIs such as resource usage, allocation efficiency, and cost. Use interactive charts to quickly assess performance and make decisions.
✅ Identify Bottlenecks and Overages
Use the dashboard to spot resource bottlenecks or overages in specific departments or projects, enabling you to take corrective action before issues escalate.
✅ Simplify Resource Management
Organize and manage all your resource allocation data in one place, making it easier to track, optimize, and improve your overall operations.
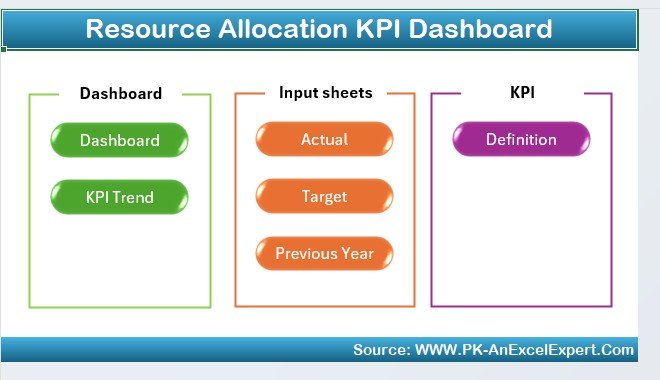
What’s Inside the Resource Allocation KPI Dashboard Template?
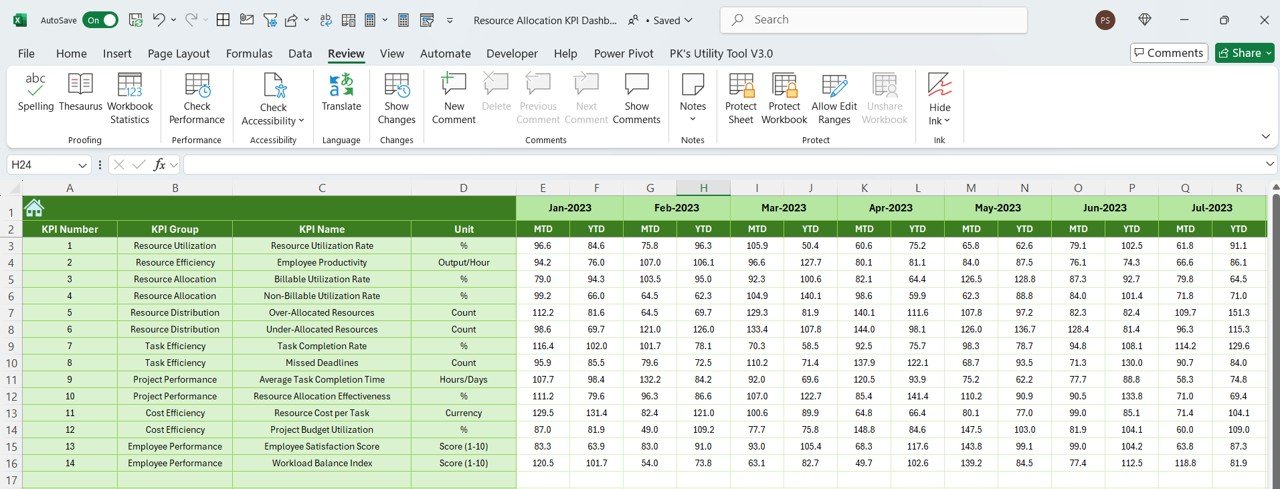
- KPI Tracking: Track critical KPIs such as resource utilization, resource cost, and project completion time.
- Project and Department Tracking: Organize resource allocation by department or project to optimize resource distribution.
- Real-Time Monitoring: Monitor resource allocation and make adjustments as needed based on real-time data.
- Interactive Dashboard: Visual representation of key metrics using easy-to-read charts and graphs.
- Customizable Metrics: Adjust the dashboard to focus on the KPIs that are most important for your resource management needs.
- Comprehensive Data: Track and compare resource allocation across different projects, departments, and time periods.
How to Use the Resource Allocation KPI Dashboard
1️⃣ Download the Template: Instantly access your Resource Allocation KPI Dashboard.
2️⃣ Input Resource Data: Enter your data for resource usage, costs, and project allocation.
3️⃣ Monitor Resource Utilization: Track the allocation of resources and ensure you are meeting deadlines and maximizing efficiency.
4️⃣ Analyze and Adjust: Use the dashboard to visualize trends and adjust resource allocation to improve performance.
Who Can Benefit from the Resource Allocation KPI Dashboard?
🔹 Project Managers
🔹 Department Heads & Team Leaders
🔹 Resource Managers
🔹 Operations Managers in Charge of Resource Allocation
🔹 Business Analysts & Consultants
🔹 Companies Looking to Optimize Resource Management and Operational Efficiency
Track, manage, and optimize resource allocation with this customizable, user-friendly Resource Allocation KPI Dashboard in Excel. Stay on top of key metrics, make data-driven decisions, and ensure the efficient use of resources across your projects and departments.
Click here to read the Detailed blog post
Visit our YouTube channel to learn step-by-step video tutorials
Youtube.com/@PKAnExcelExpert


Reviews
There are no reviews yet.