
Research institutions are the backbone of innovation, discovery, and collaboration. Yet, without structured performance monitoring, even the most promising projects can lose momentum. Leaders need accurate, timely insights to ensure resources, funding, and time align with institutional goals.
The Research Institutions KPI Dashboard in Excel provides a powerful yet cost-effective solution. Built entirely in Excel, it transforms raw data into actionable insights, helping institutions track projects, funding, publications, and collaborations with ease. By centralizing performance metrics into a single interactive dashboard, it empowers stakeholders to evaluate progress, identify bottlenecks, and make informed decisions—without the need for expensive BI software.
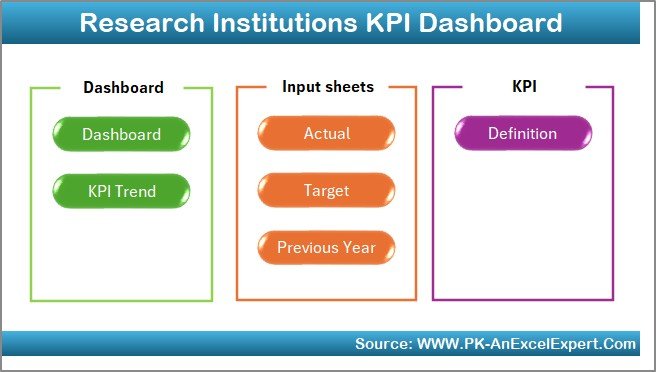
✨ Key Features of Research Institutions KPI Dashboard in Excel
-
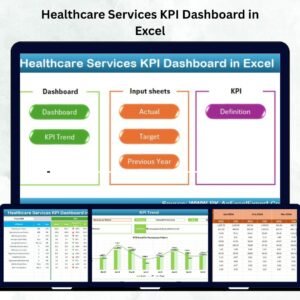
🏠 Home Sheet – Central hub with navigation buttons for quick access to all worksheets.
-
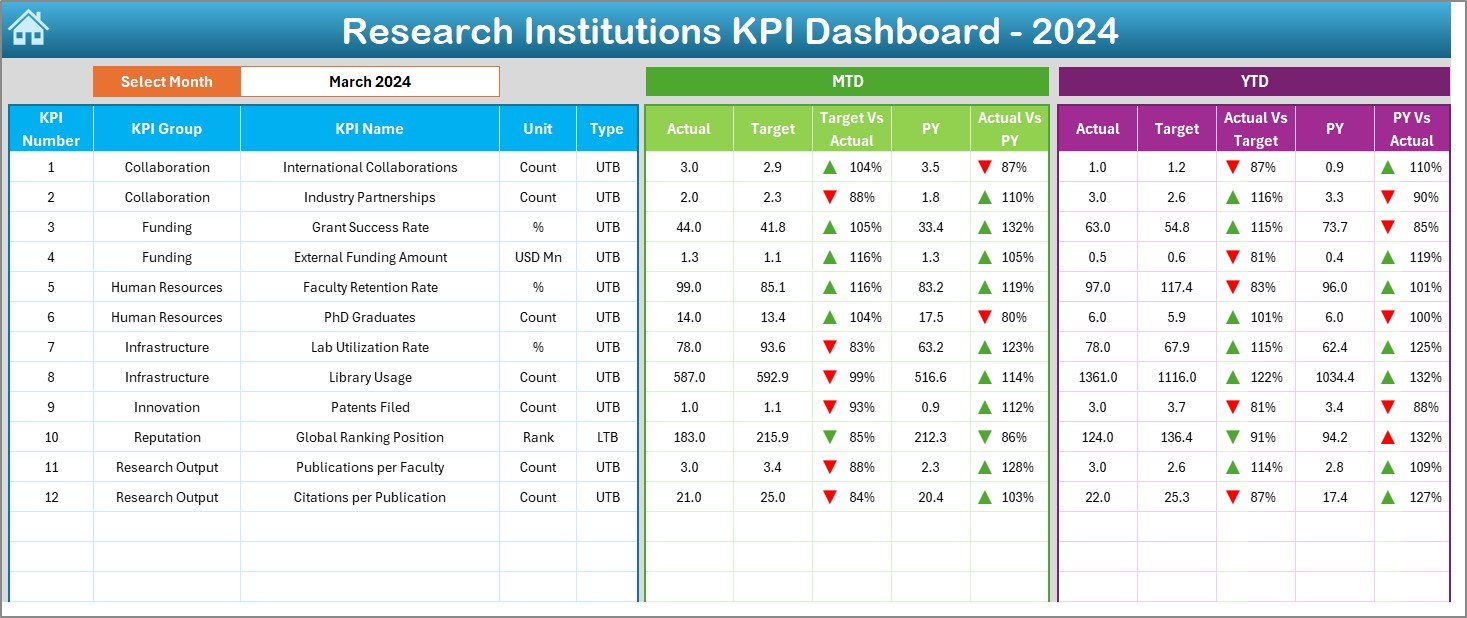
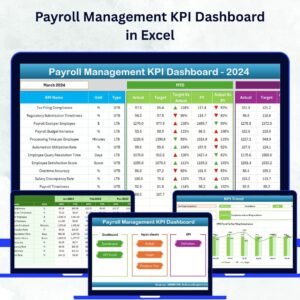
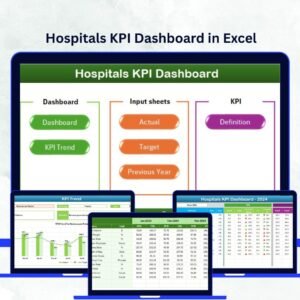
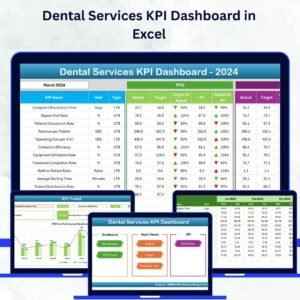
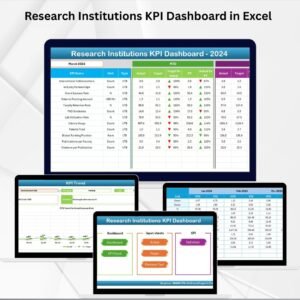
📊 Dashboard Sheet – Real-time overview with MTD (Month-to-Date) and YTD (Year-to-Date) actuals, targets, and variance analysis using conditional formatting.
-
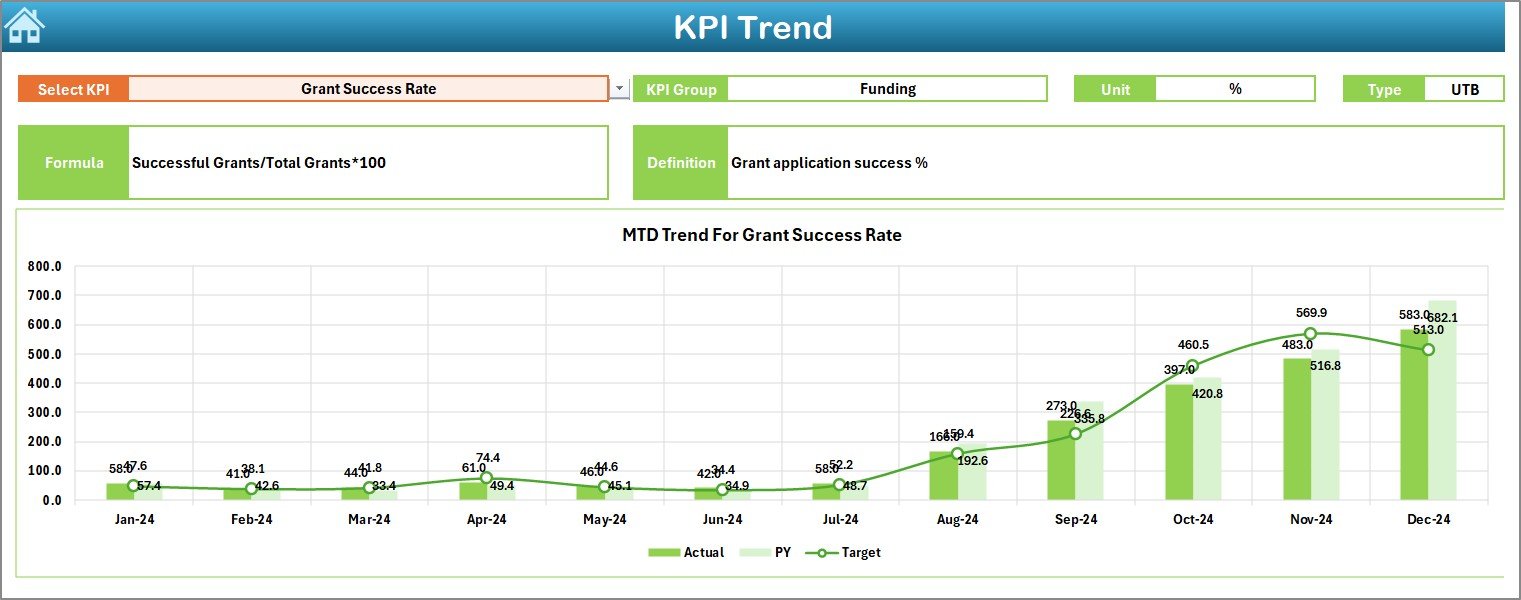
📈 KPI Trend Sheet – Select KPIs from a dropdown and analyze performance trends with charts comparing actuals, targets, and previous year data.
-
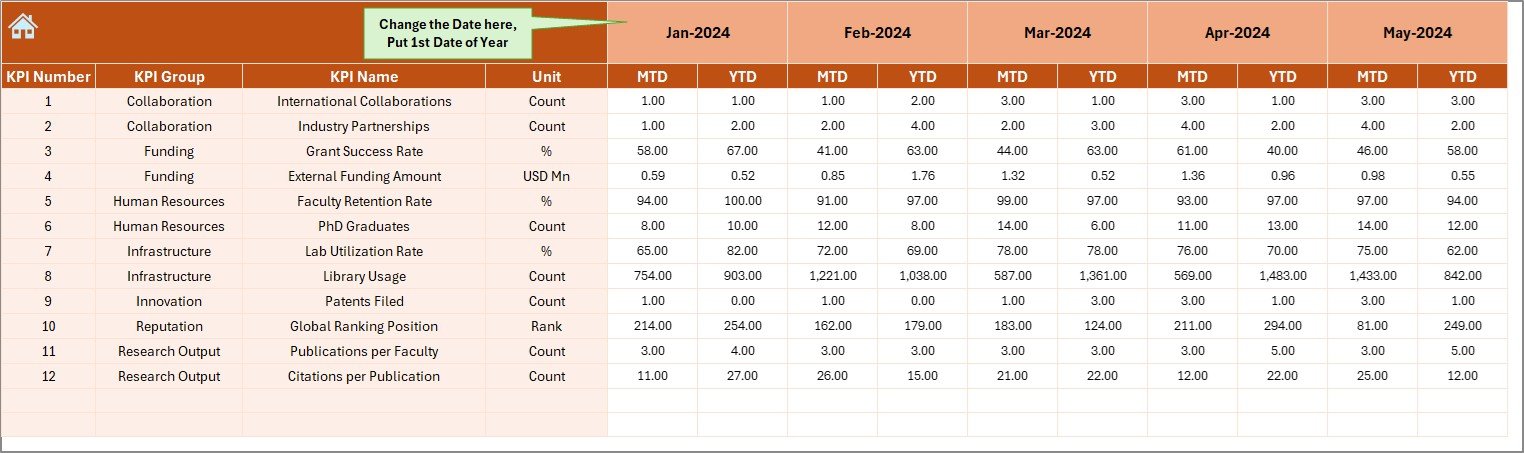
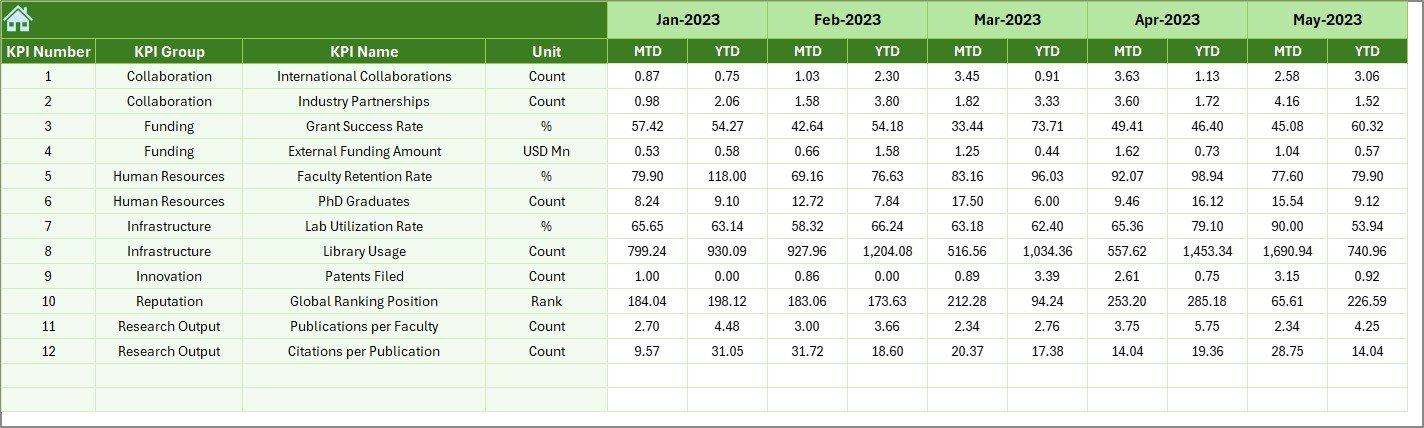
📝 Actual Numbers Input Sheet – Centralized entry point for monthly performance values, ensuring data accuracy and consistency.
-
🎯 Target Sheet – Record monthly and yearly targets for KPIs, keeping accountability clear.
-
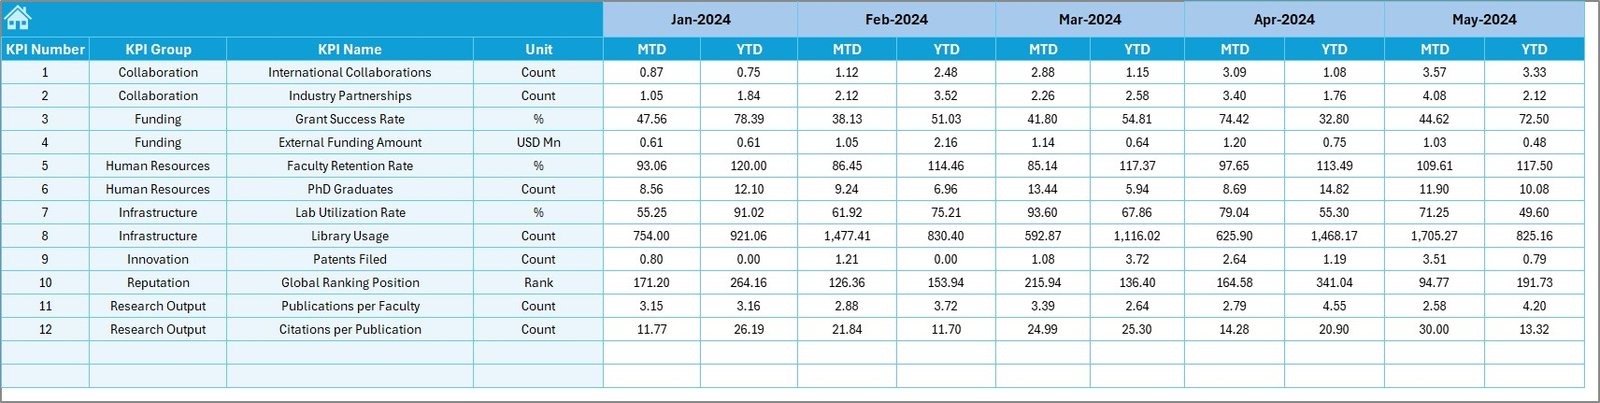
📂 Previous Year Numbers Sheet – Store historical KPI values for year-over-year comparisons.
-
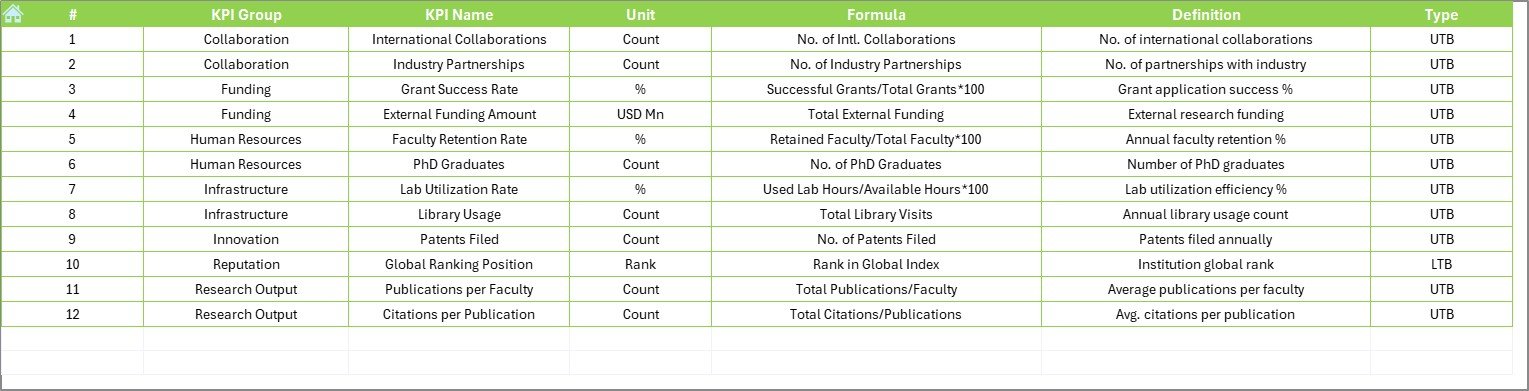
📘 KPI Definition Sheet – Document KPI names, units, formulas, definitions, and performance type (UTB/LTB) for clarity and standardization.
📂 What’s Inside the Research Institutions KPI Dashboard
This template includes seven structured worksheets designed for research performance monitoring:
-
Home Sheet – Professional index with navigation buttons.
-
Dashboard Sheet – High-level performance overview with KPIs vs. targets.
-
KPI Trend Sheet – Time-series analysis of specific KPIs.
-
Actual Numbers Input Sheet – Enter monthly performance data.
-
Target Sheet – Define clear and measurable targets.
-
Previous Year Numbers Sheet – Enable YOY comparisons.
-
KPI Definition Sheet – Maintain KPI transparency and governance.
🛠 How to Use the Research Institutions KPI Dashboard
-
Set Up KPIs – Define KPI names, units, formulas, and definitions in the KPI Definition Sheet.
-
Enter Historical Data – Input previous year’s actual numbers.
-
Define Targets – Set realistic monthly and yearly goals in the Target Sheet.
-
Input Actuals – Update performance data monthly in the Actual Numbers Input Sheet.
-
Analyze Dashboard – Select the current month to review performance vs. targets.
-
Track Trends – Use the KPI Trend Sheet for deeper insights into progress over time.
-
Review Annually – Compare year-to-date results against historical benchmarks.
👥 Who Can Benefit from This Dashboard
The Research Institutions KPI Dashboard is perfect for:
-
🏛 University Research Departments – Monitor publications, projects, and funding utilization.
-
🔬 Independent Research Labs – Track active projects and output efficiency.
-
💼 Funding Agencies – Assess the impact of grants and research investments.
-
👩🏫 Academic Leaders – Ensure accountability across teams and projects.
-
🌍 Collaborative Institutions – Track joint publications, collaborations, and partnerships.


Reviews
There are no reviews yet.