
Innovation is the heartbeat of every successful organization — and your R&D department is where it all begins. But managing multiple research projects, budgets, and results can get overwhelming without a clear system. That’s where the Research & Development (R&D) KPI Dashboard in Excel comes in — a powerful, ready-to-use Excel dashboard designed to simplify performance tracking and empower smarter innovation decisions.Research & Development (R&D) KPI Dashboard in Excel
This dashboard turns raw R&D data into clear, visual insights that help you monitor progress, improve efficiency, and maximize ROI — all without any coding or expensive software.Research & Development (R&D) KPI Dashboard in Excel
✨ Key Features of the Research & Development (R&D) KPI Dashboard in Excel
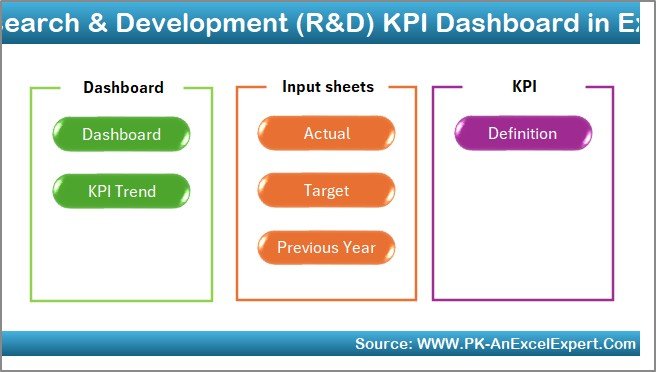
💡 7 Prebuilt Worksheets: Includes Home, Dashboard, KPI Trend, Actual Numbers Input, Target, Previous Year Numbers, and KPI Definition sheets for full control.
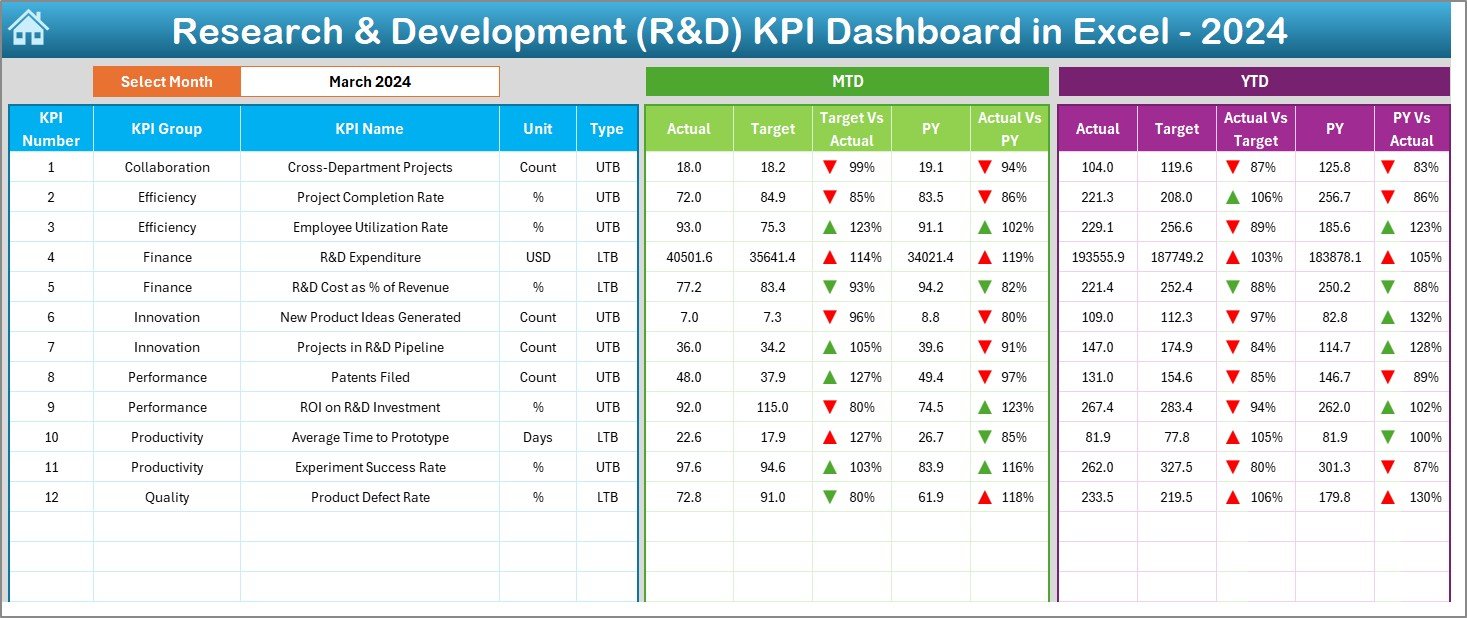
📊 Interactive Dashboard: Choose the month from a dropdown and instantly view performance updates for all R&D KPIs.
🎯 MTD & YTD Tracking: Monitor Month-to-Date and Year-to-Date performance for Actual, Target, and Previous Year metrics.
📈 Dynamic Charts & Arrows: Instantly see performance improvements or declines with green/red arrows and data-driven visuals.Research & Development (R&D) KPI Dashboard in Excel
⚙️ Automated Variance Analysis: Compare actuals vs. targets automatically — no formulas or macros required.
🔍 Customizable KPI Definitions: Modify KPI formulas, units, and types (UTB or LTB) to fit your organization’s innovation process.Research & Development (R&D) KPI Dashboard in Excel
📁 Year-on-Year Comparison: Measure growth, track trends, and benchmark performance against last year’s results.
🚀 Easy Navigation: Jump between sheets instantly using the Home sheet buttons for a smooth user experience.
📦 What’s Inside the Research & Development (R&D) KPI Dashboard in Excel
Inside this premium Excel template, you’ll find everything needed to manage innovation like a pro:Research & Development (R&D) KPI Dashboard in Excel
✅ Home Sheet: Your control center with quick-access buttons to all key sections.
✅ Dashboard Sheet: The main visual interface showcasing KPI performance, MTD/YTD comparisons, and conditional formatting arrows.
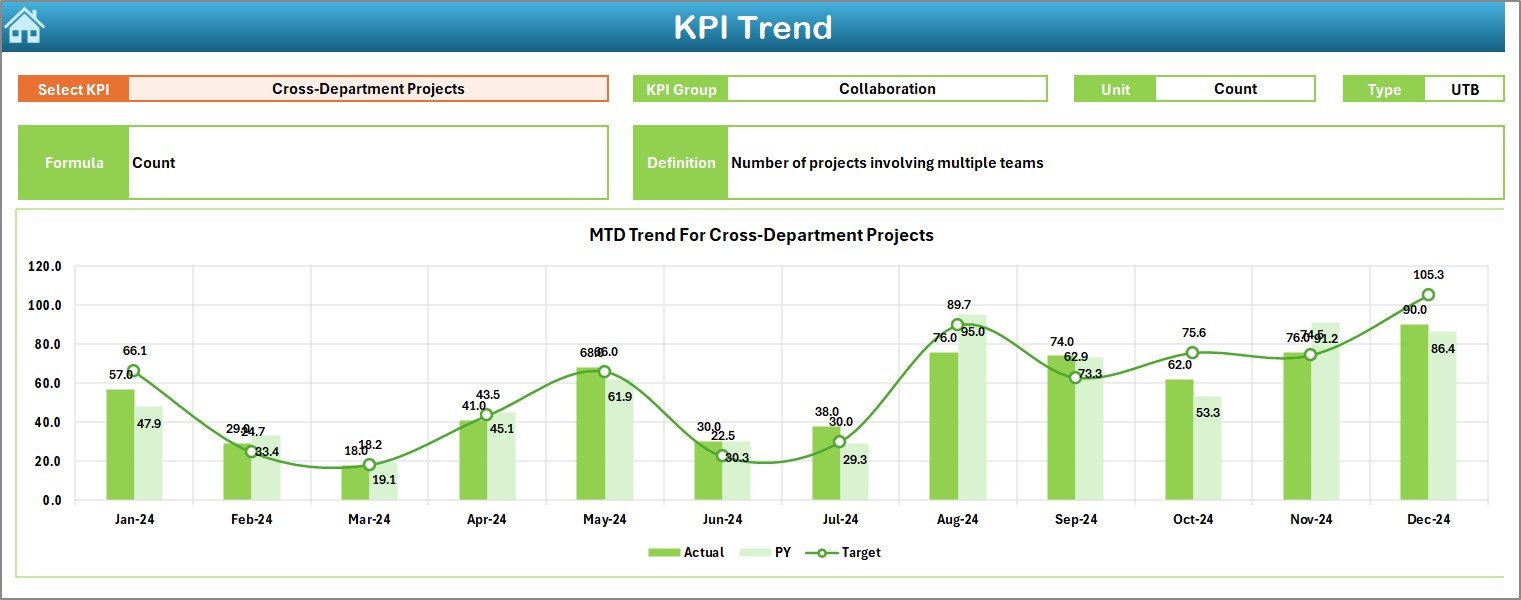
✅ KPI Trend Sheet: Analyze performance trends for each KPI over time using smart dropdowns and dynamic charts.
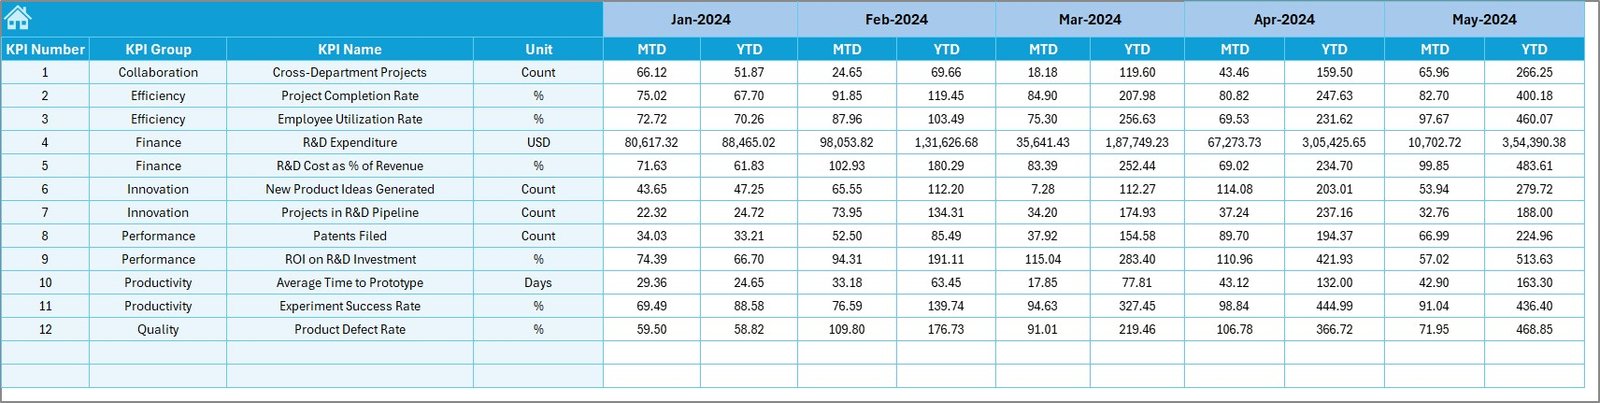
✅ Actual Numbers Input Sheet: Record real monthly data with automated updates across the dashboard.
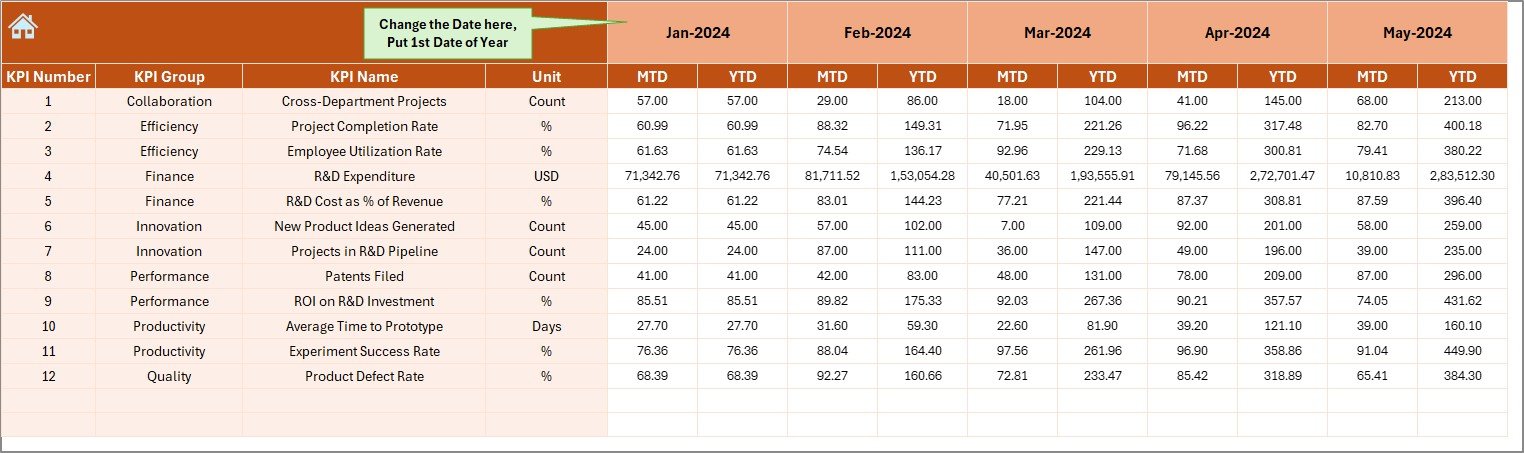
✅ Target Sheet: Define your R&D performance targets to stay aligned with company goals.
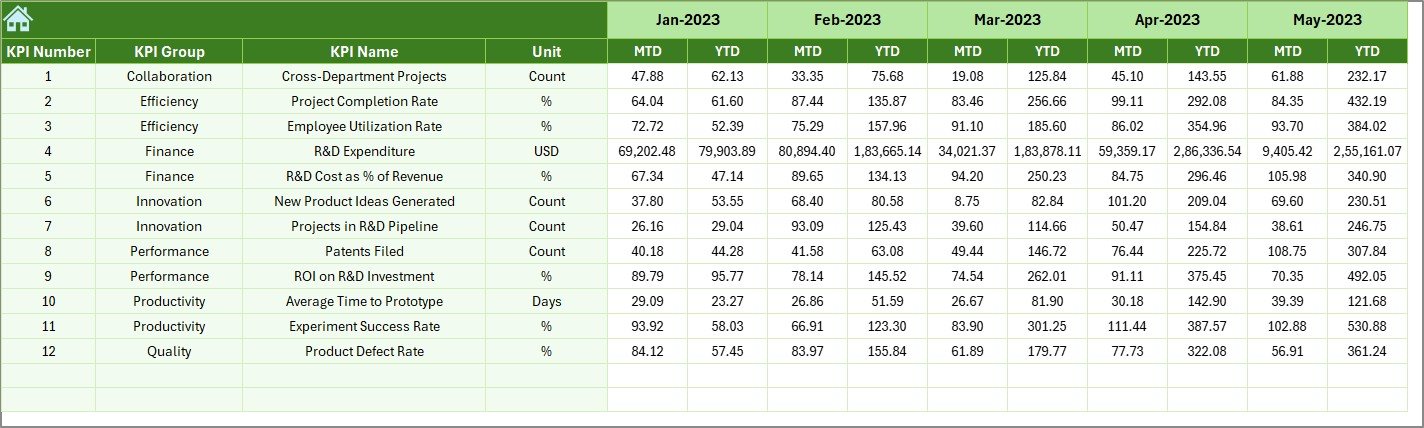
✅ Previous Year Numbers Sheet: Store historical data for benchmarking and growth tracking.
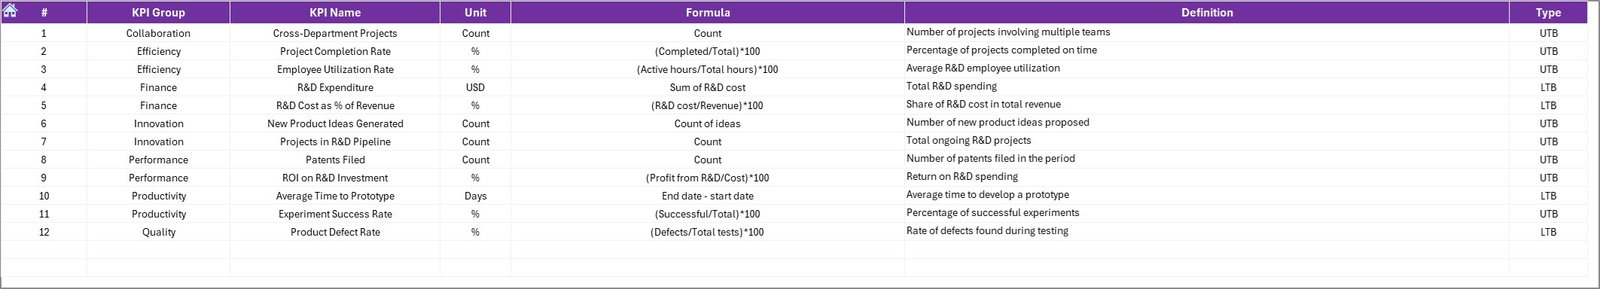
✅ KPI Definition Sheet: A dictionary of all metrics — including name, unit, formula, definition, and type (UTB/LTB).
This organized setup ensures clarity, transparency, and accuracy across all R&D performance areas.
🧭 How to Use the Research & Development (R&D) KPI Dashboard in Excel
1️⃣ Input Your Data: Enter Actual, Target, and Previous Year figures in the respective sheets.
2️⃣ Select the Month: Use the dropdown in Cell D3 on the Dashboard sheet to view real-time updates.
3️⃣ Review Trends: Use the KPI Trend sheet to analyze progress and identify patterns.
4️⃣ Compare Performance: Check MTD vs. YTD and Target vs. Actual results instantly.
5️⃣ Make Informed Decisions: Use visual insights to allocate resources, reduce inefficiencies, and improve R&D output.
No coding or Power BI setup required — just Excel!
🎯 Who Can Benefit from This Research & Development (R&D) KPI Dashboard
👨🔬 R&D Managers: Monitor project efficiency and innovation success rates in one place.
🏭 Manufacturing Companies: Track new product development and reduce cycle time.
💼 Corporate Strategy Teams: Evaluate R&D ROI and strategic alignment with business goals.
📊 Data Analysts: Visualize research data without complex tools.
🚀 Startups & Innovators: Gain control over your innovation pipeline from day one.
Whether you manage small experiments or global R&D portfolios, this dashboard helps you make data-driven decisions confidently.
✅ Why Choose This Dashboard
-
📍 100% editable and Excel-based — no software installation needed
-
⚡ User-friendly interface with clear visuals
-
💼 Perfect for any industry — from tech to pharmaceuticals
-
🔒 Accurate, automated, and customizable for your organization’s KPIs


Reviews
There are no reviews yet.