Research & Development (R&D) teams work on critical activities—innovation projects, scientific analysis, grant management, experiments, patents, and academic research. Research & Development Institutes KPI Dashboard in Excel but without a structured system, tracking these tasks becomes confusing. Spreadsheets grow large, numbers become scattered, and leaders struggle to understand performance clearly.
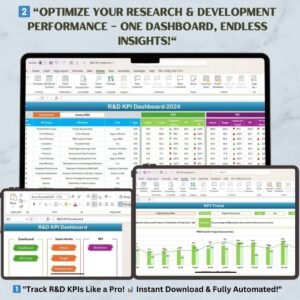
The Research & Development Institutes KPI Dashboard in Excel solves this challenge. It is a professionally designed, fully automated, and easy-to-use Excel dashboard that brings all R&D metrics into one clean structure. Research & Development Institutes KPI Dashboard in Excel from monthly performance to yearly trends, Research & Development Institutes KPI Dashboard in Excel this dashboard gives teams complete visibility, helping them track project progress, compare KPIs, and make data-driven decisions with confidence.
Perfect for universities, laboratories, government research centers, private R&D firms, and innovation institutions—this dashboard ensures every team works in sync with measurable goals.
✨ Key Features of the Research & Development Institutes KPI Dashboard in Excel
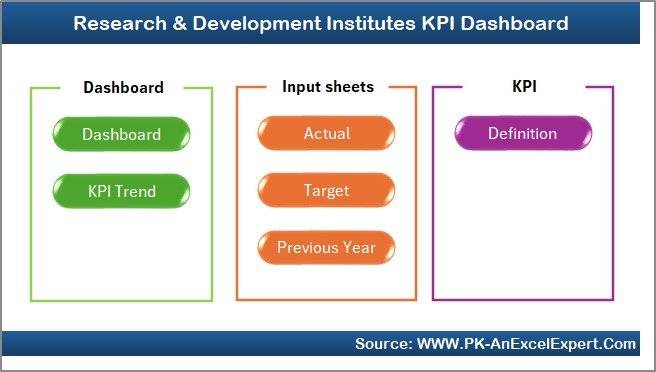
This powerful Excel dashboard includes seven structured worksheets, each designed to simplify R&D performance tracking.
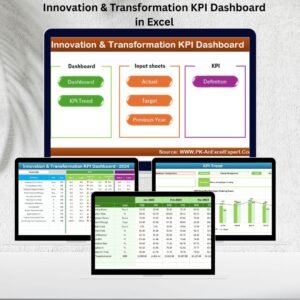
📌 Home Sheet – Simple Navigation for Users
The Home Sheet acts as the master index. With six clickable buttons, users can instantly jump to any section of the dashboard. No scrolling. No confusion. Just smooth navigation.
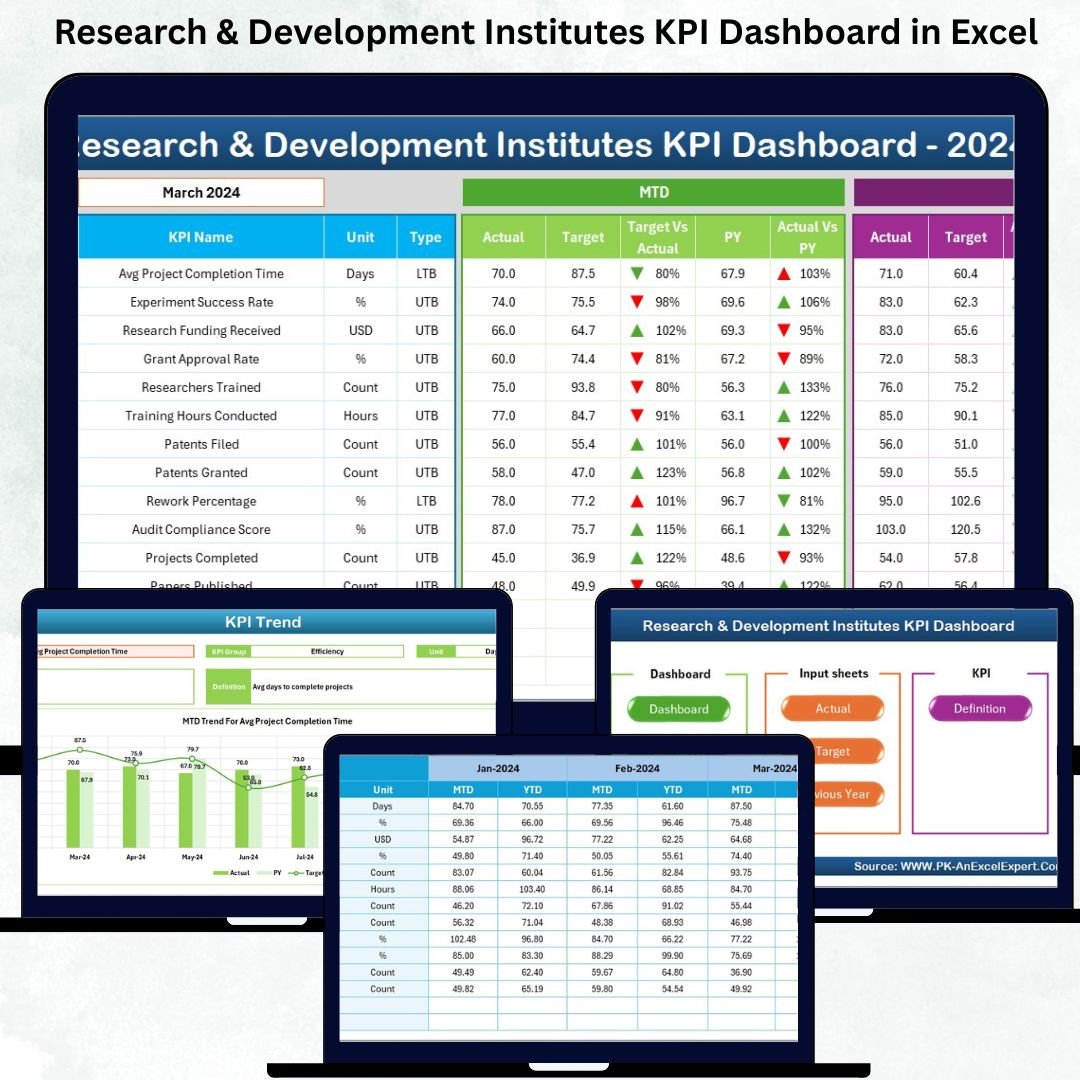
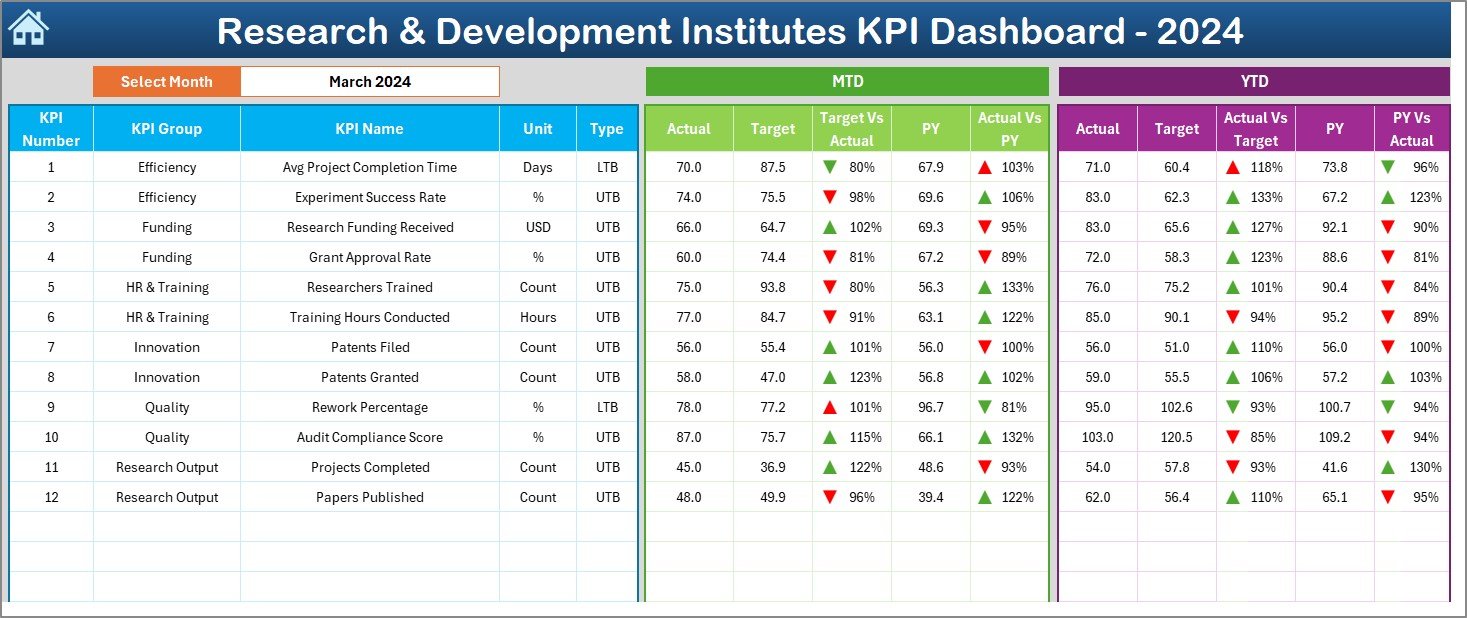
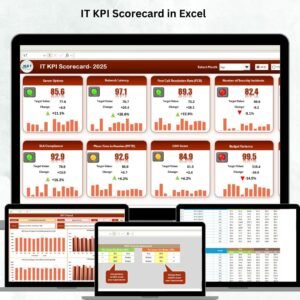
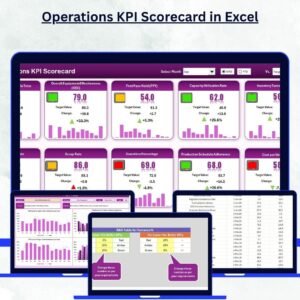
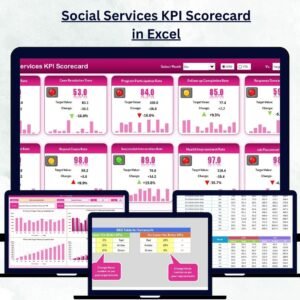
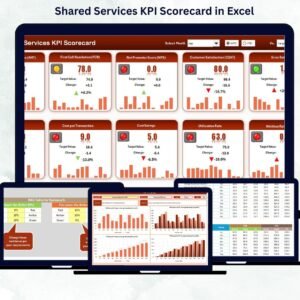
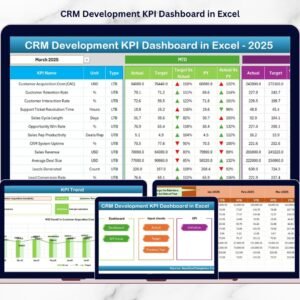
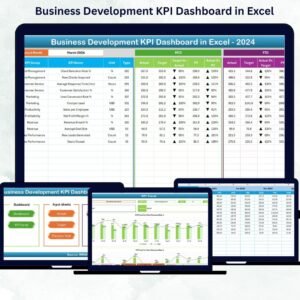
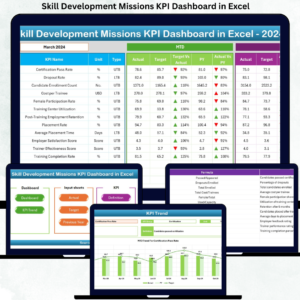
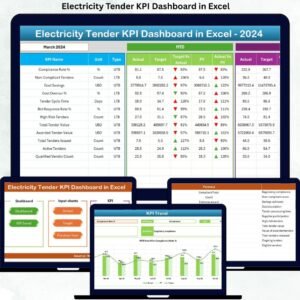
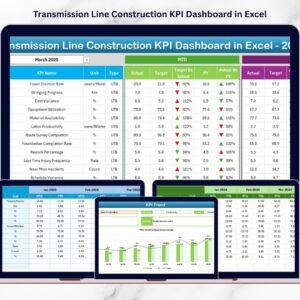
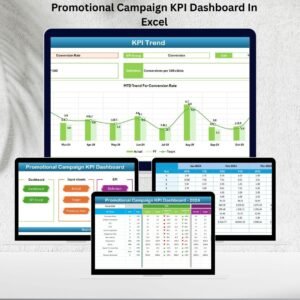
📌 Dashboard Sheet – Complete Monthly & Yearly KPI Insights
This is the main page where all R&D KPIs appear in a clear, easy-to-read format.
💠 Month Selection (Drop-down in Cell D3)
Choose any month and the dashboard updates automatically.
💠 MTD (Month-to-Date) Section
Shows:
-
Actual
-
Target
-
Previous Year (PY)
-
Target vs Actual (%)
-
PY vs Actual (%)
-
Conditional arrows (▲ / ▼)
💠 YTD (Year-to-Date) Section
Shows:
-
Actual
-
Target
-
PY
-
Target vs Actual (%)
-
PY vs Actual (%)
These insights help R&D heads identify progress, gaps, and performance strengths immediately.
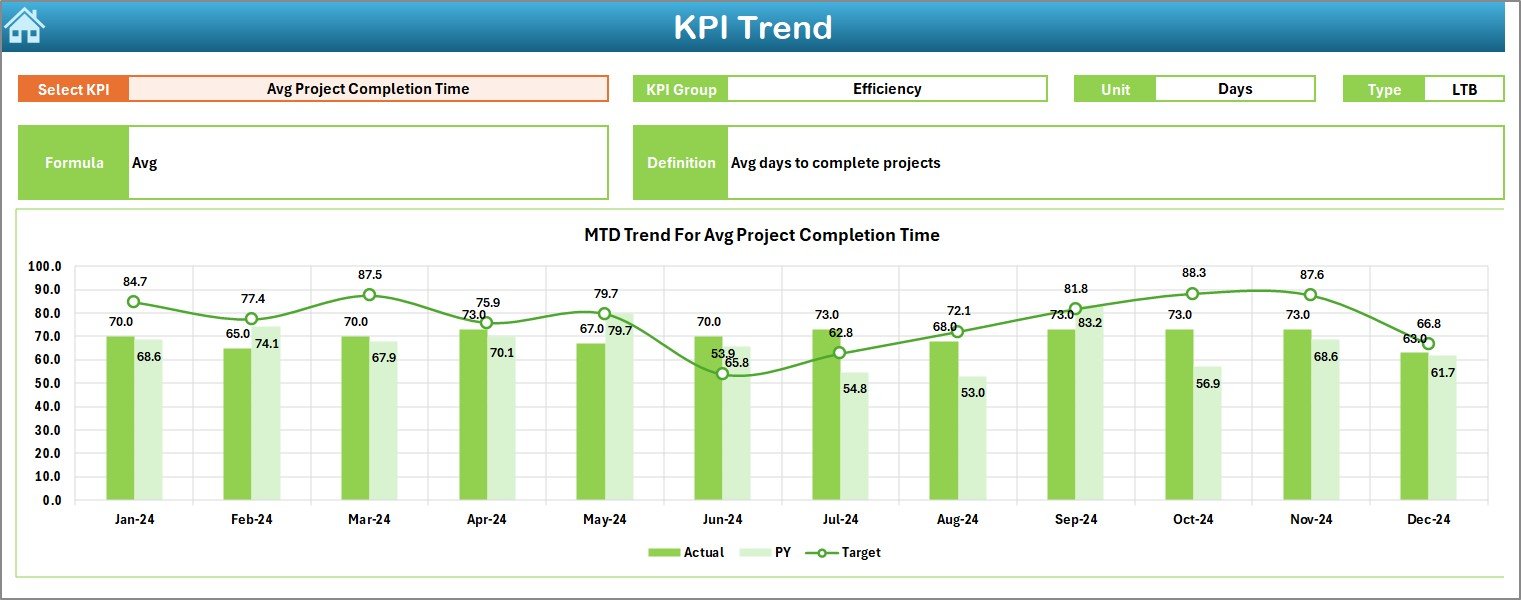
📌 KPI Trend Sheet – Track Patterns & Growth Over Time
The KPI Trend Sheet shows long-term trends using two combo charts:
📈 MTD Trend: Actual vs Target vs PY
📉 YTD Trend: Actual vs Target vs PY
You also see KPI details such as:
-
KPI Group
-
Unit
-
Type (UTB/LTB)
-
Formula
-
Definition
Perfect for scientific analysis and performance forecasting.
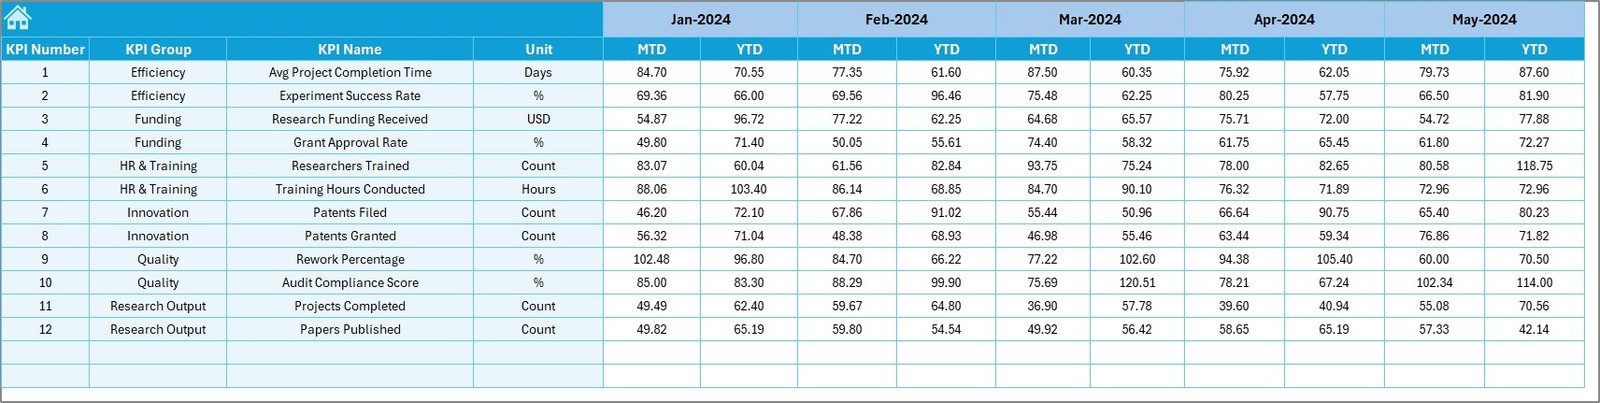
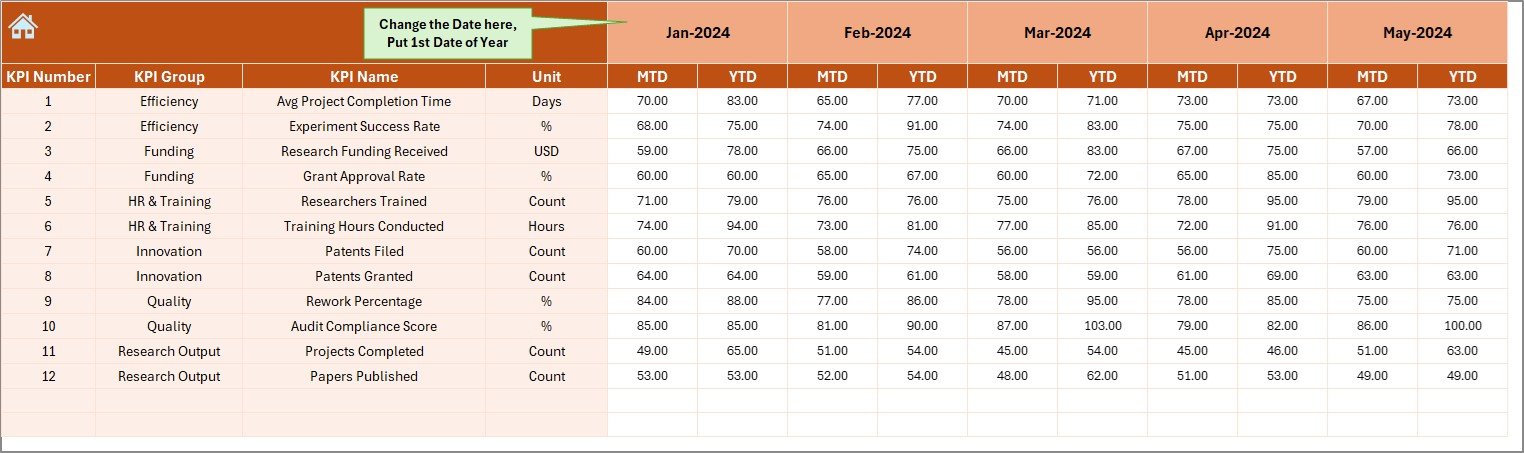
📌 Actual Numbers Input Sheet – Monthly Actual Data Entry
Teams enter the MTD and YTD actual numbers here. With a single update, the entire dashboard refreshes instantly.
📌 Target Sheet – Set Monthly Performance Benchmarks
Enter MTD and YTD targets for each KPI. These targets help teams stay aligned with institutional goals.
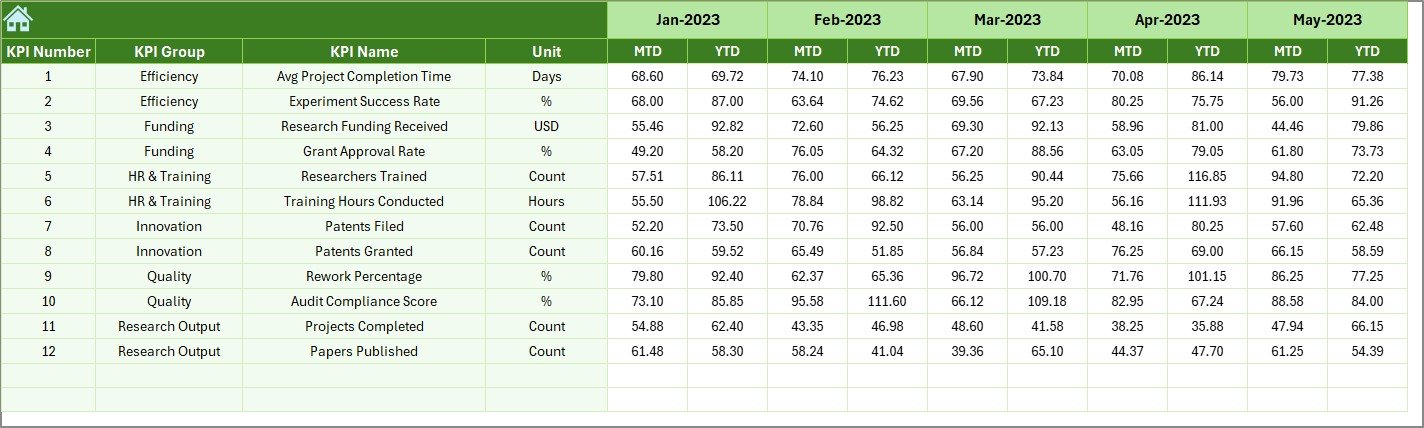
📌 Previous Year Numbers Sheet – Historical Data Tracking
Add last year’s metrics to compare PY vs CY performance.
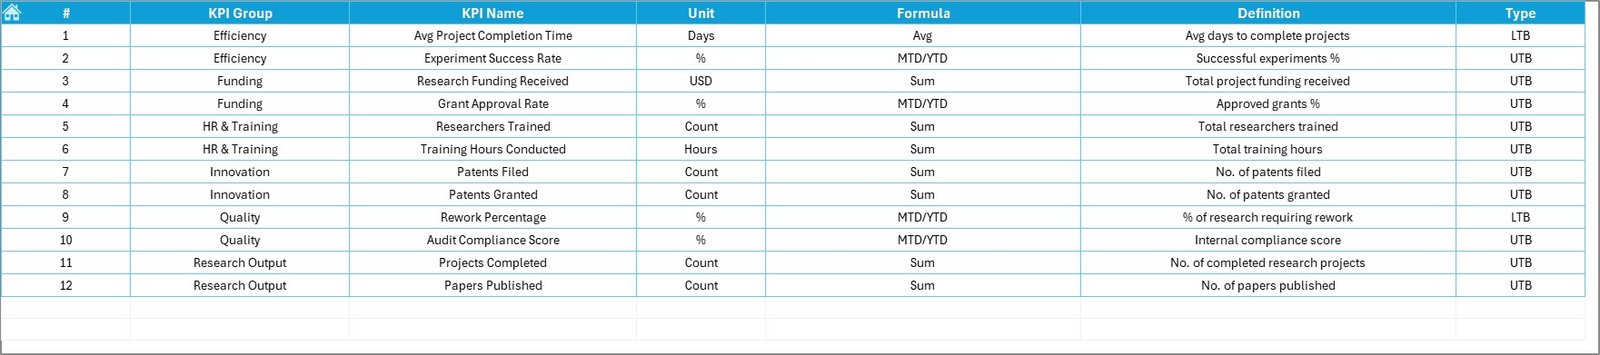
📌 KPI Definition Sheet – Complete KPI Knowledgebase
Includes:
-
KPI Name
-
KPI Group
-
Unit
-
Formula
-
Definition
This ensures clarity, accuracy, and consistency across teams.
📦 What’s Inside the Research & Development Institutes KPI Dashboard
Inside this ready-to-use dashboard, you get:
🟢 Fully automated calculations
🟢 Clean KPI tables
🟢 Trend analysis charts
🟢 Drop-down filters
🟢 Conditional icons
🟢 Structured input sheets
🟢 Easy customization options
Everything is pre-built—just enter data, and Excel does the rest.
🧠 How to Use the Research & Development Institutes KPI Dashboard
Using this dashboard is incredibly simple:
1️⃣ Enter MTD & YTD actuals in the Actual Numbers sheet
2️⃣ Add your monthly targets in the Target sheet
3️⃣ Enter previous year data for comparison
4️⃣ Choose your month in the Dashboard Sheet
5️⃣ Study KPIs and trend charts
6️⃣ Present insights in review meetings
7️⃣ Update it every month for accurate visibility
No coding. No formulas. No complex setup.
👥 Who Can Benefit from This Dashboard?
This dashboard is perfect for:
🔬 Research Institutes
🏫 Universities & Colleges
🧪 Laboratories
📚 Academic Departments
🏛 Government R&D Centers
🏢 Private Research Firms
🚀 Innovation & Technology Teams
Anyone who wants clear R&D performance insights can use this tool effortlessly.


Reviews
There are no reviews yet.