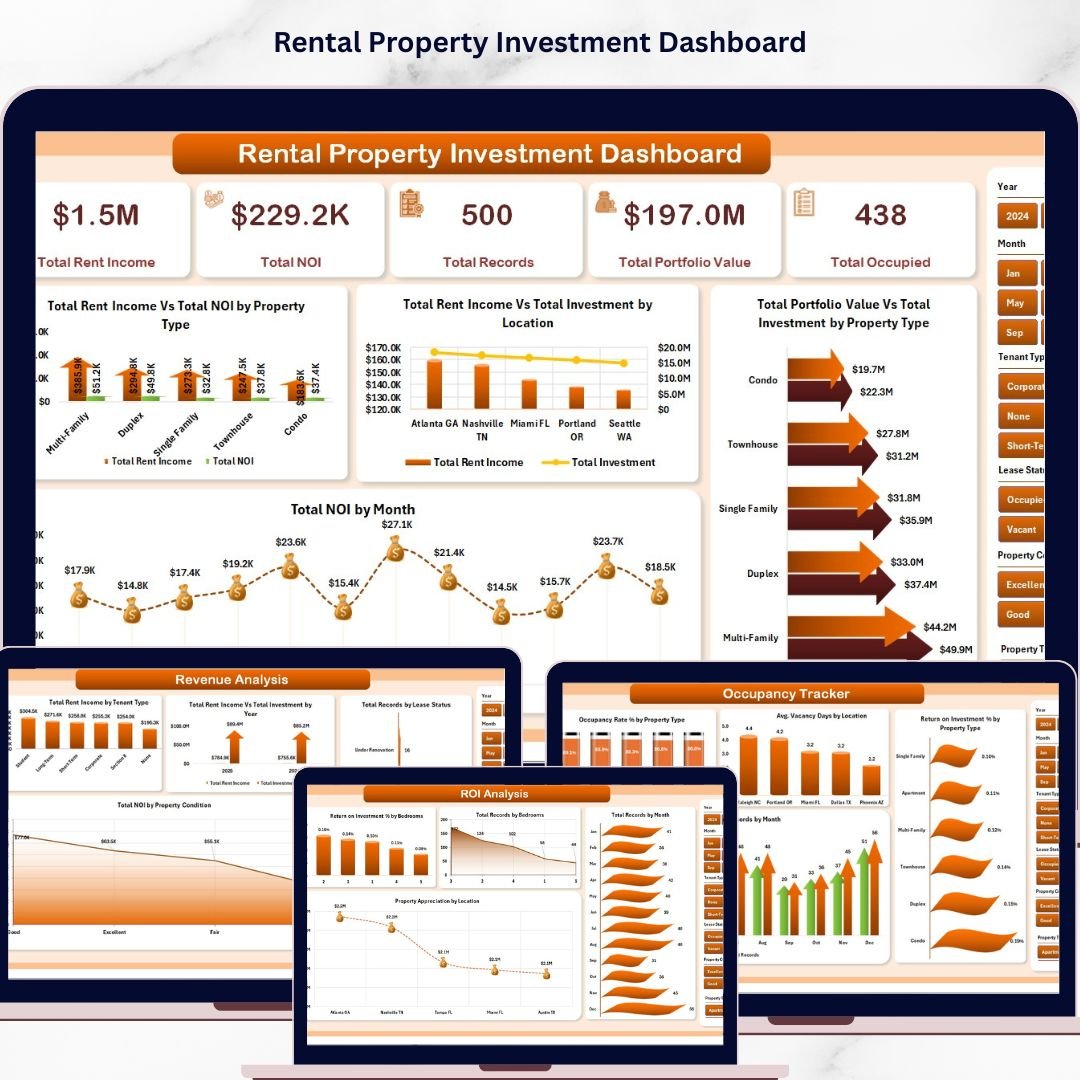


Rental Property Investment Dashboard in Excel is a comprehensive, data-driven analytics template designed for real estate investors, property managers, landlords, and financial analysts who want to monitor rental income, occupancy rates, ROI performance, and portfolio value — all in one powerful Excel dashboard. This template includes 5 interactive dashboard pages, a structured data sheet, and a support sheet with pivot tables that drive the entire dashboard dynamically 🚀.
🔑 Key Features of Rental Property Investment Dashboard in Excel
🏠 5 Interactive Dashboard Pages – Explore rental property data across Overview, Portfolio Analysis, Revenue Analysis, Occupancy Tracker, and ROI Analysis — each purpose-built for a unique analytical perspective.
📊 Dynamic KPI Cards – Instantly track high-level metrics including Total Rent Income, Total NOI (Net Operating Income), Total Records, Total Portfolio Value, and Total Occupied properties at a glance.
🔍 Advanced Slicers and Filters – Filter the entire dashboard by Property Type, Location, Bedrooms, Management Type, Tenant Type, and more with a single click for targeted rental property analysis.
📈 Revenue and NOI Tracking – Compare rent income vs. NOI by property type, track monthly NOI trends, and analyze investment vs. income across locations to identify top-performing assets.
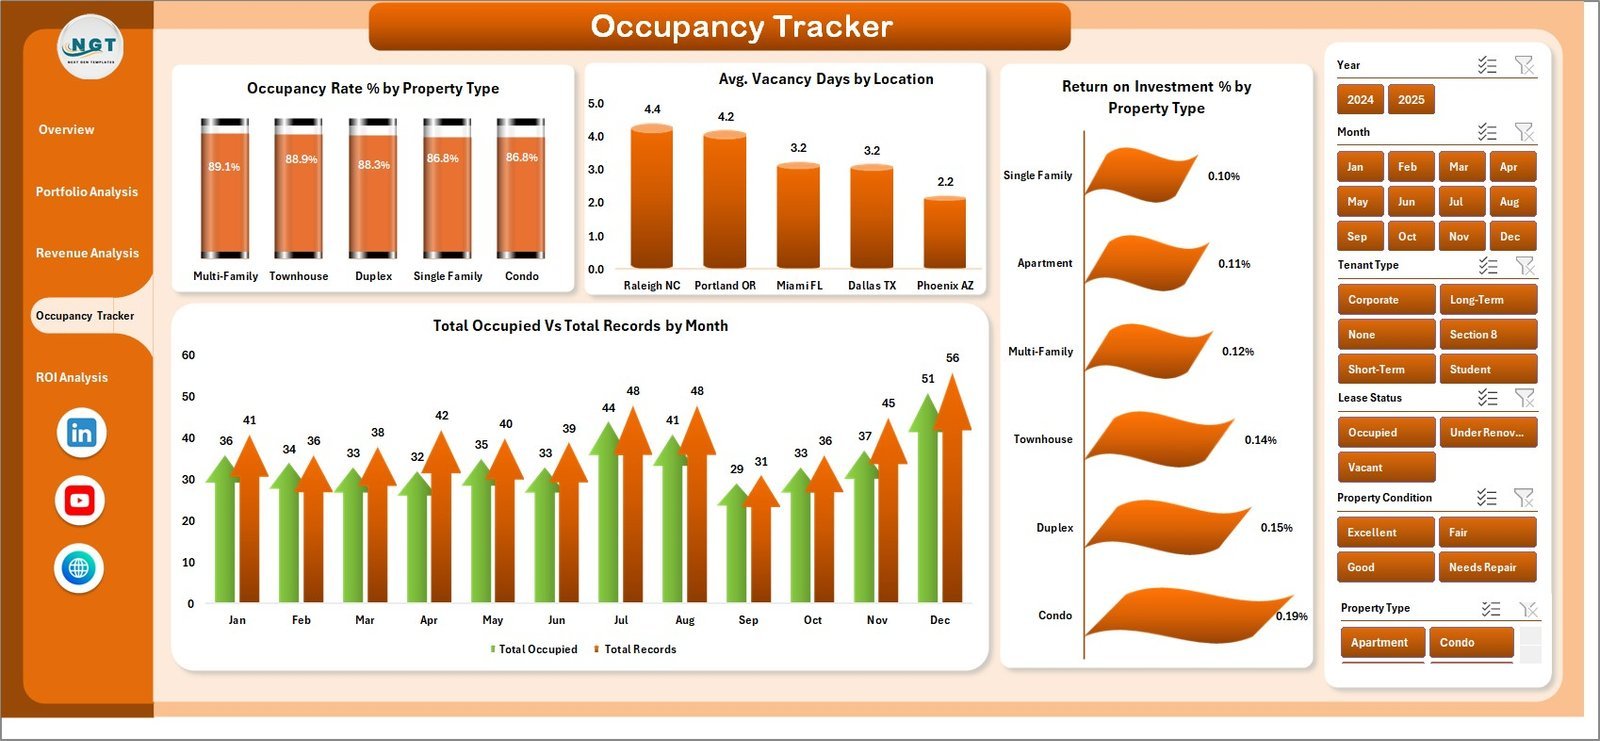
🏢 Occupancy Rate Monitoring – Monitor occupancy rates by property type, average vacancy days by location, and occupied vs. total properties by month to minimize vacancy losses.
💰 ROI and Appreciation Analysis – Evaluate return on investment percentages by bedrooms and property type, track property appreciation by location, and identify high-growth investment opportunities.
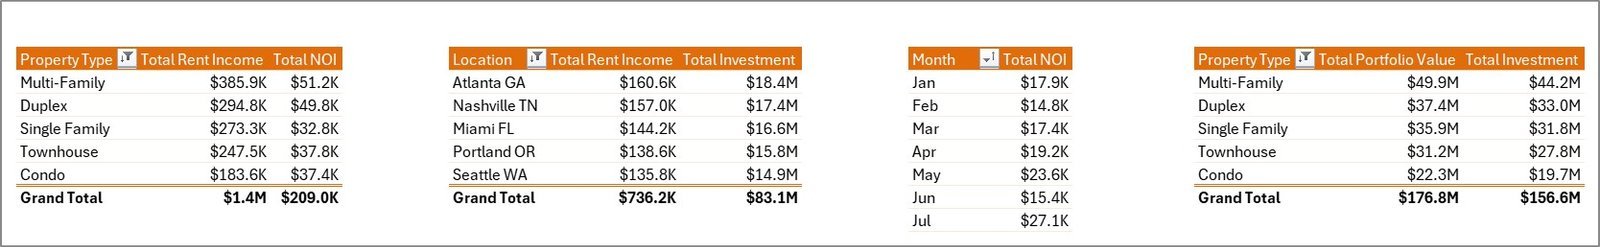
📋 Pivot-Powered Dynamic Updates – All charts and KPIs are powered by pivot tables in the Support sheet. Simply refresh the data to see your entire dashboard update automatically.
📦 What’s Inside the Rental Property Investment Dashboard in Excel
This dashboard contains 7 sheets — 5 interactive dashboard pages, 1 data entry sheet, and 1 support sheet with pivot tables.
📌 Overview Page – Displays KPI cards for Total Rent Income, Total NOI, Total Records, Total Portfolio Value, and Total Occupied. Charts include Total Rent Income Vs Total NOI by Property Type, Total Rent Income Vs Total Investment by Location, Total Portfolio Value Vs Total Investment by Property Type, and Total NOI by Month.
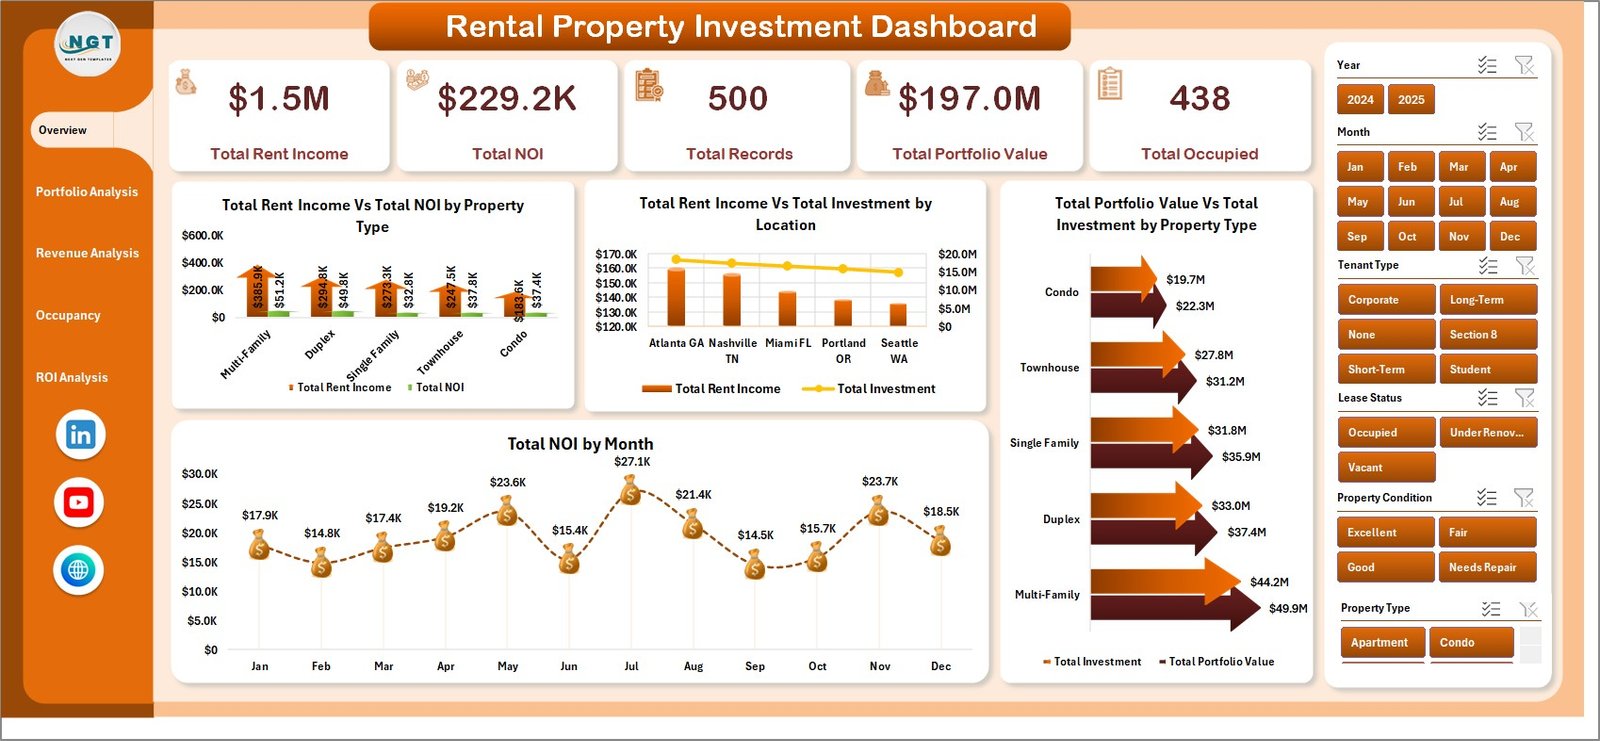 Overview Page
📌 Portfolio Analysis – Visualizes Total Portfolio Value by Location, Total Rent Income by Bedrooms, Total Rent Income Vs Total NOI by Month, and Total Records Vs Total Rent Income by Management Type.
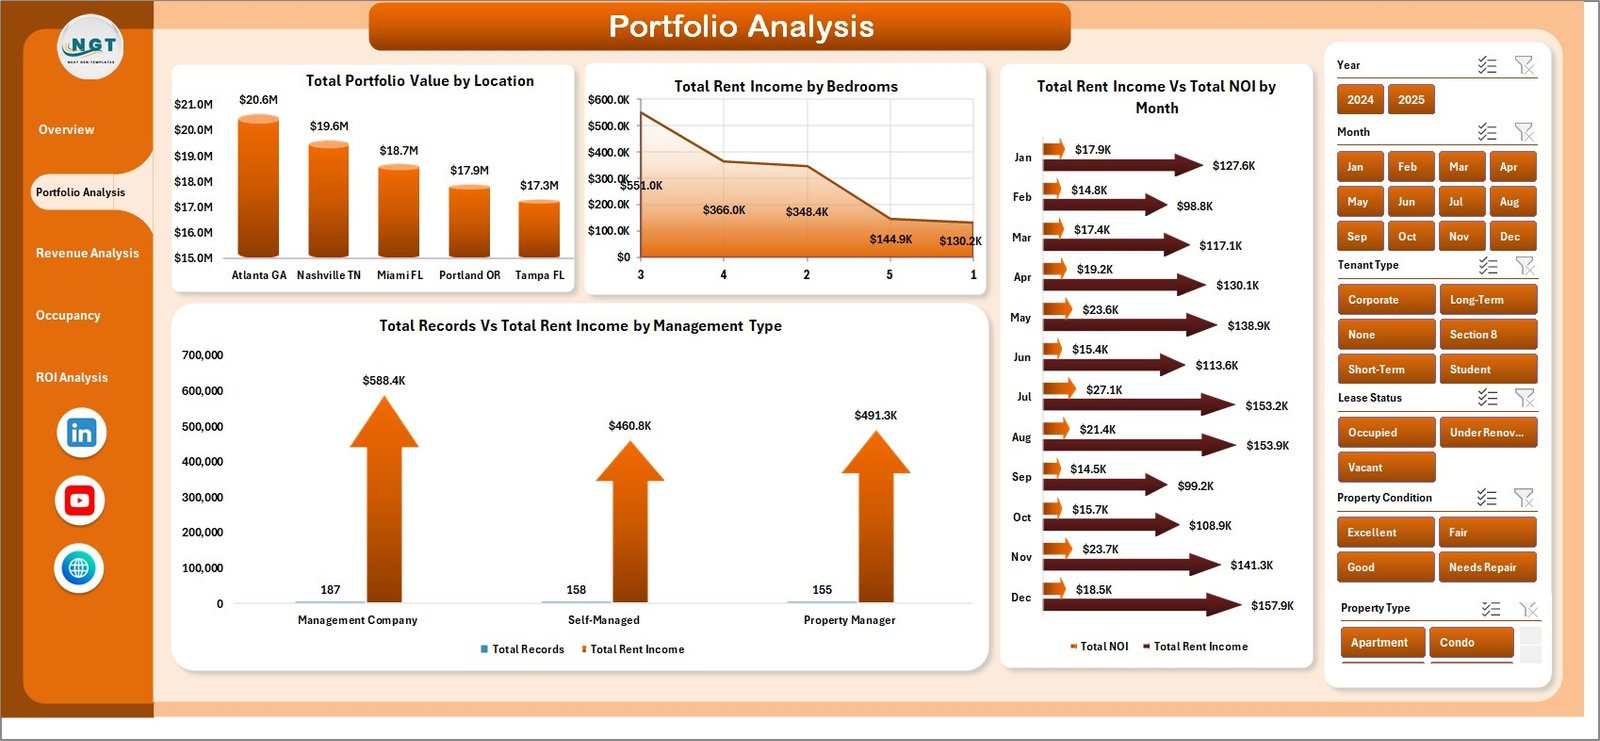 Portfolio Analysis
📌 Revenue Analysis – Analyzes Total Rent Income by Tenant Type, Total Rent Income Vs Total Investment by Property Condition, Total Records by Lease Status, and Total NOI by Property Condition.
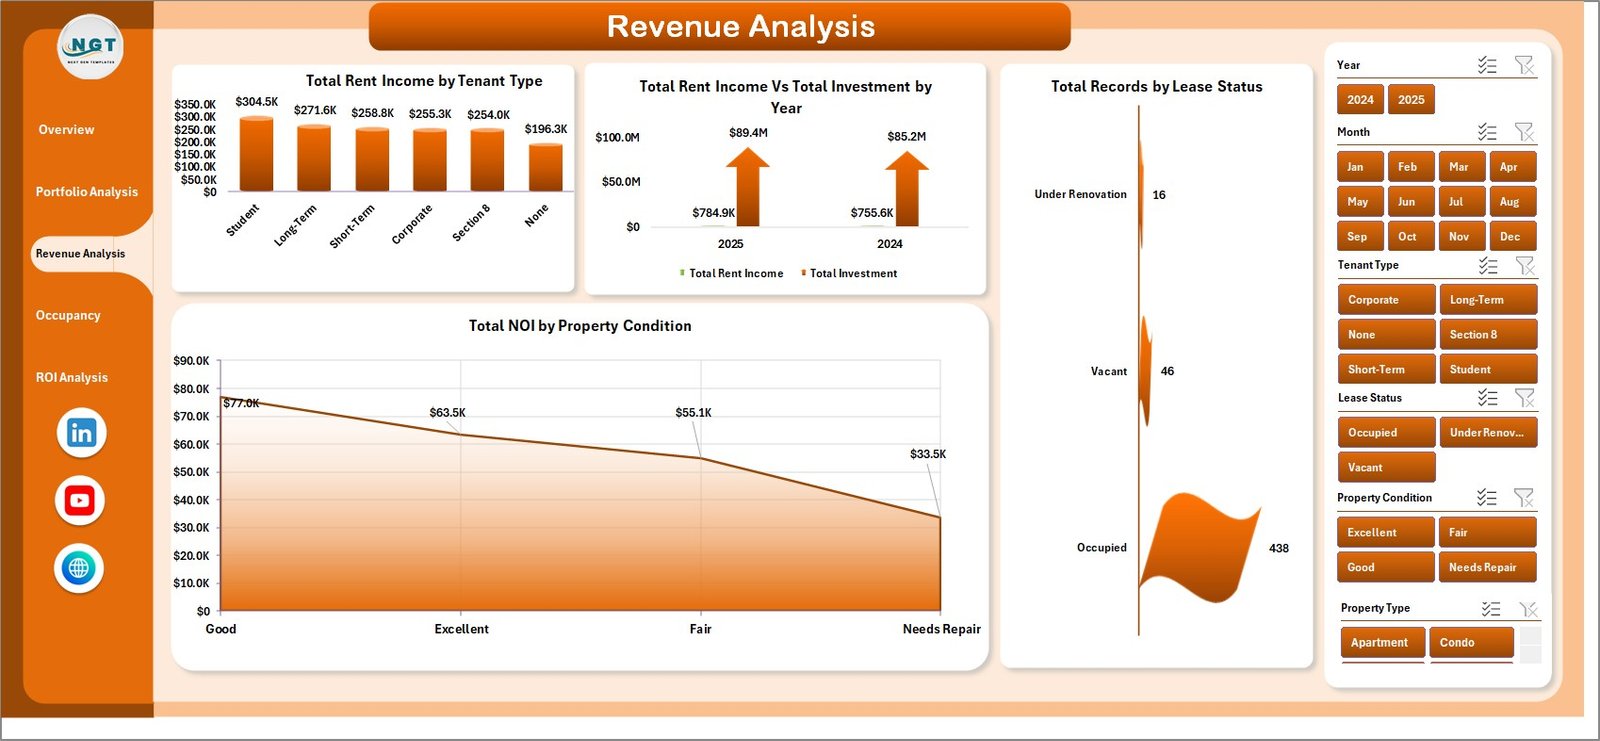 Revenue Analysis
📌 Occupancy Tracker – Tracks Occupancy Rate % by Property Type, Avg. Vacancy Days by Location, Return on Investment % by Property Type, and Total Occupied Vs Total Records by Month.
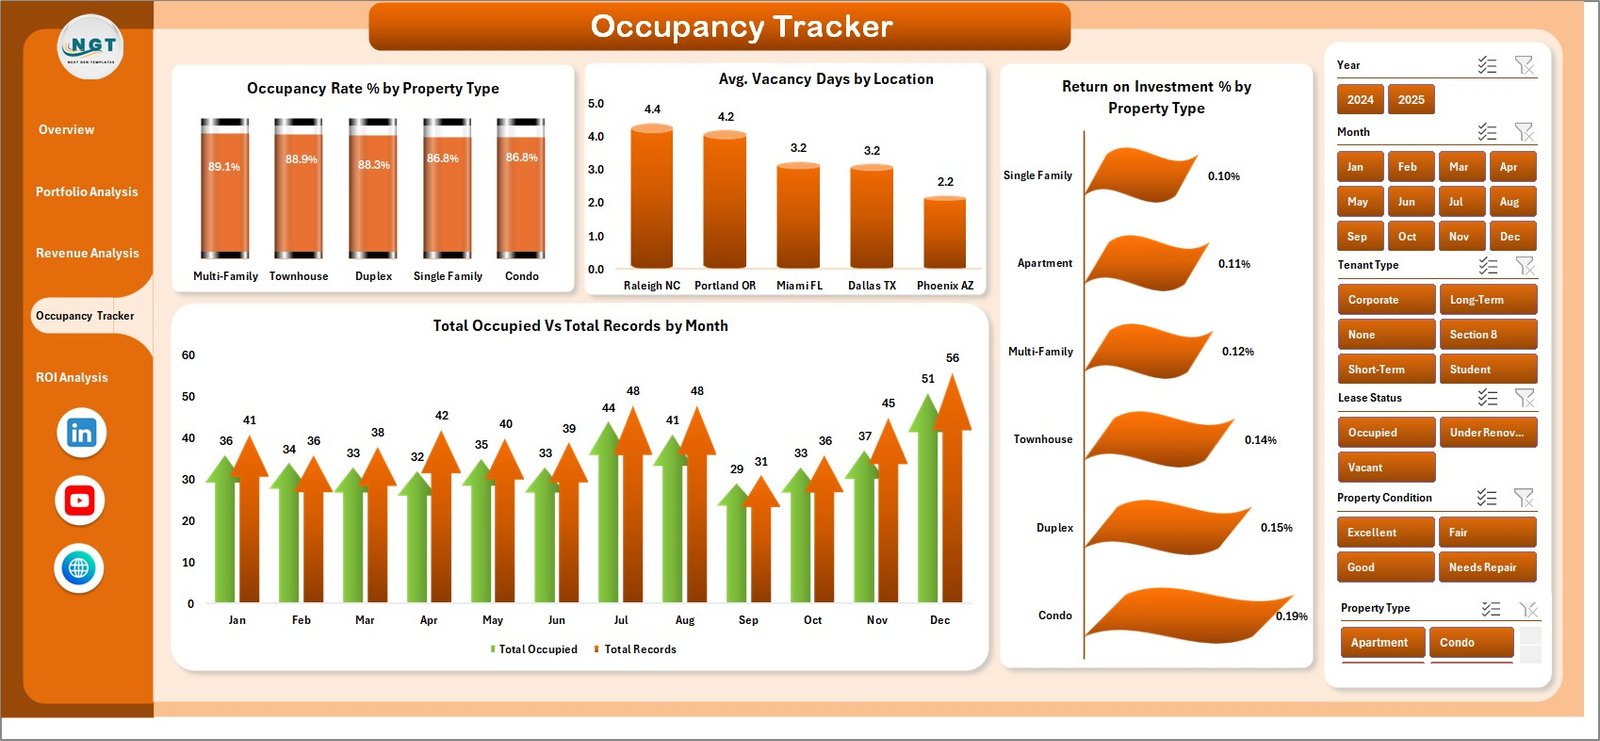 Occupancy Tracker
📌 ROI Analysis – Evaluates Return on Investment % by Bedrooms, Total Records by Bedrooms, Total Records by Month, and Property Appreciation by Location.
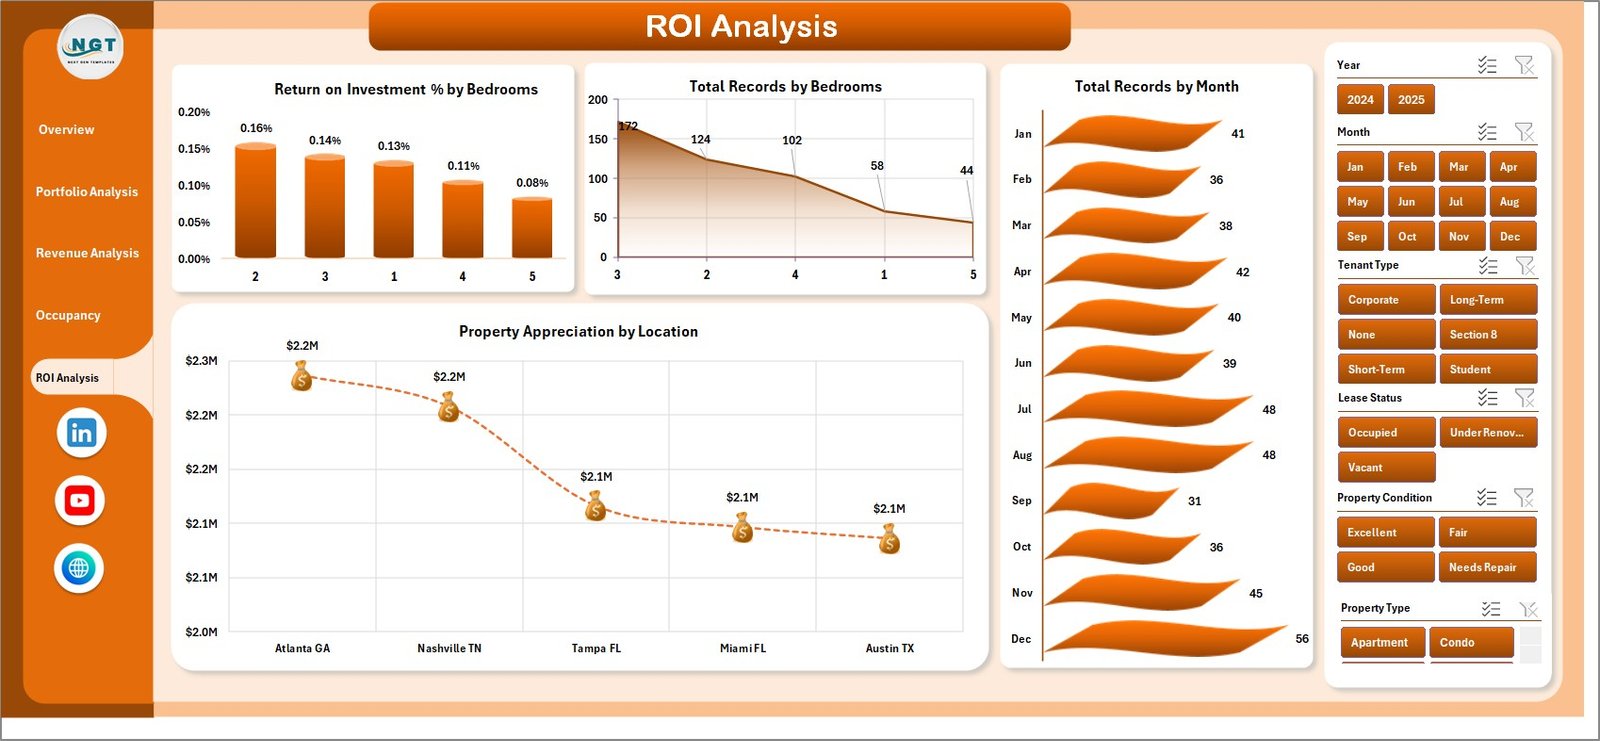 ROI Analysis
📌 Data Sheet – This is where you enter your rental property data. Add your records in the same format provided, including property details, rent income, NOI, investment amounts, occupancy status, and more.
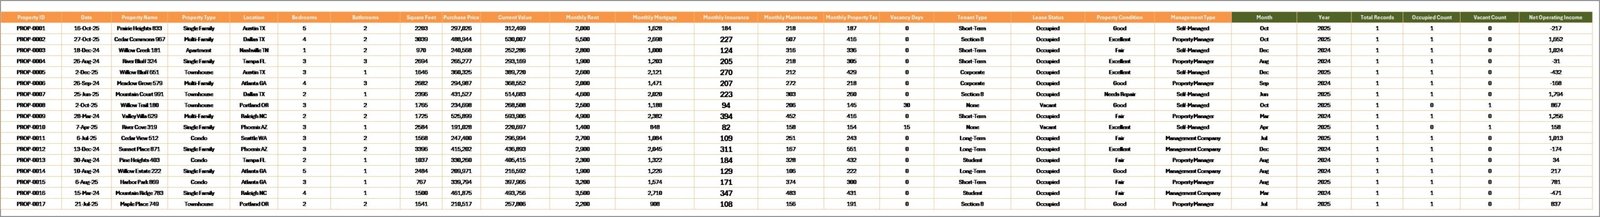 Data Sheet Tab
📌 Support Sheet – Contains multiple pivot tables that power the entire dashboard dynamically. After updating data, go to Data tab → Refresh All, and every chart and KPI card updates automatically. You can keep this sheet hidden.
 Support Sheet Tab
⚙️ How to Use the Rental Property Investment Dashboard in Excel
1️⃣ Open the downloaded Excel file in Microsoft Excel (desktop version recommended for full slicer and pivot functionality).
2️⃣ Navigate to the Data Sheet tab and replace the sample data with your own rental property records — including property type, location, rent income, NOI, investment, occupancy status, and more.
3️⃣ Go to the Data tab in the Excel Ribbon and click Refresh All to update all pivot tables and charts automatically.
4️⃣ Use the slicers on each dashboard page to filter by property type, location, bedrooms, management type, and other dimensions.
5️⃣ Explore each dashboard tab — Overview, Portfolio Analysis, Revenue Analysis, Occupancy Tracker, and ROI Analysis — for deep insights into your rental property portfolio.
👥 Who Can Benefit from This Rental Property Investment Dashboard in Excel
🏘️ Real Estate Investors – Track portfolio performance, ROI, and property appreciation across multiple rental properties.
🏢 Property Managers – Monitor occupancy rates, vacancy days, and tenant types to optimize property management decisions.
💼 Financial Analysts – Analyze rent income vs. investment, NOI trends, and revenue breakdowns for informed financial reporting.
🏠 Landlords – Get a clear snapshot of rental income, property values, and occupancy across your entire portfolio.
📊 Real Estate Consultants – Use this dashboard to present data-driven insights to clients for portfolio optimization.
❓ Frequently Asked Questions
What KPIs does the Rental Property Investment Dashboard in Excel track?
The Rental Property Investment Dashboard in Excel tracks 5 key performance indicators including Total Rent Income, Total NOI (Net Operating Income), Total Records, Total Portfolio Value, and Total Occupied properties. It also calculates Occupancy Rate %, Return on Investment %, Average Vacancy Days, and Property Appreciation across multiple dimensions.
Do I need advanced Excel skills to use this rental property dashboard?
No. Simply replace the sample data with your own rental property data in the Data Sheet and click Refresh All. All charts, KPI cards, and pivot tables update automatically — no formulas or macros to configure.
Can I filter the dashboard by specific property types or locations?
Yes. The dashboard includes multiple slicers that let you filter by Property Type, Location, Bedrooms, Management Type, Tenant Type, Lease Status, and Property Condition for focused analysis.
How many dashboard pages does this template include?
This template includes 5 interactive dashboard pages — Overview, Portfolio Analysis, Revenue Analysis, Occupancy Tracker, and ROI Analysis — plus a Data Sheet for data entry and a Support Sheet with pivot tables.
Is this template compatible with Google Sheets?
This template is built for Microsoft Excel with pivot tables and slicers. For a Google Sheets alternative, explore our Real Estate Property Portfolio Performance Dashboard in Google Sheets.
What is the best Excel template for tracking rental property investments?
The Rental Property Investment Dashboard in Excel is the best template for tracking rental property investments. It provides 5 analytical pages covering portfolio value, rent income, NOI, occupancy rates, ROI, and property appreciation — all powered by dynamic pivot tables that auto-update when you refresh your data.
🔗 Explore Related Templates
🔹 Real Estate Valuation Dashboard in Excel – Analyze property valuations, market comparisons, and investment potential with interactive charts and KPIs.
🔹 Real Estate Investment Trusts (REITs) Dashboard in Excel – Track REIT performance, dividend yields, and portfolio allocation with dynamic analytics.
🔹 Office Space Leasing KPI Dashboard in Excel – Monitor leasing KPIs, occupancy metrics, and revenue trends for commercial office spaces.
📖 Click here to read the Detailed Blog Post
🎥 Visit our YouTube channel to learn step-by-step video tutorials
👉 YouTube.com/@NextGenTemplates


Reviews
There are no reviews yet.