The renewable energy industry is expanding at an incredible pace. Solar farms, wind parks, hydropower stations, and hybrid renewable projects generate enormous volumes of operational and financial data every single day. However, many organizations still struggle to transform this complex data into meaningful insights that support fast and accurate decision-making.
That’s where the Renewable Energy Dashboard in Power BI becomes a game-changing solution.
This professionally designed, ready-to-use dashboard converts raw renewable energy data into powerful visual analytics. Instead of managing multiple spreadsheets or manual reports, decision-makers can monitor performance, revenue, generation efficiency, and operational trends from one centralized interactive dashboard.
Built using Power BI’s advanced visualization capabilities, this dashboard enables energy professionals to instantly identify performance gaps, reduce curtailment losses, and optimize renewable energy output. Whether you manage solar assets, wind farms, or diversified energy portfolios, this tool helps you take control of your operations through data-driven insights.
Organizations adopting this dashboard experience faster reporting, improved operational visibility, and smarter strategic planning — all without complicated setup.
🚀 Key Feature of Renewable Energy Dashboard in Power BI
✅ Interactive Power BI dashboard with dynamic slicers and filters
✅ Five analytical pages covering operational, financial, and strategic insights
✅ Real-time KPI monitoring for generation, export, and revenue performance
✅ Region-wise and plant-wise performance comparison
✅ Energy source profitability and efficiency analysis
✅ Monthly trend tracking for seasonal performance insights
✅ Curtailment monitoring to reduce energy losses
✅ User-friendly interface suitable for both technical and non-technical users
📦 What’s Inside the Renewable Energy Dashboard in Power BI
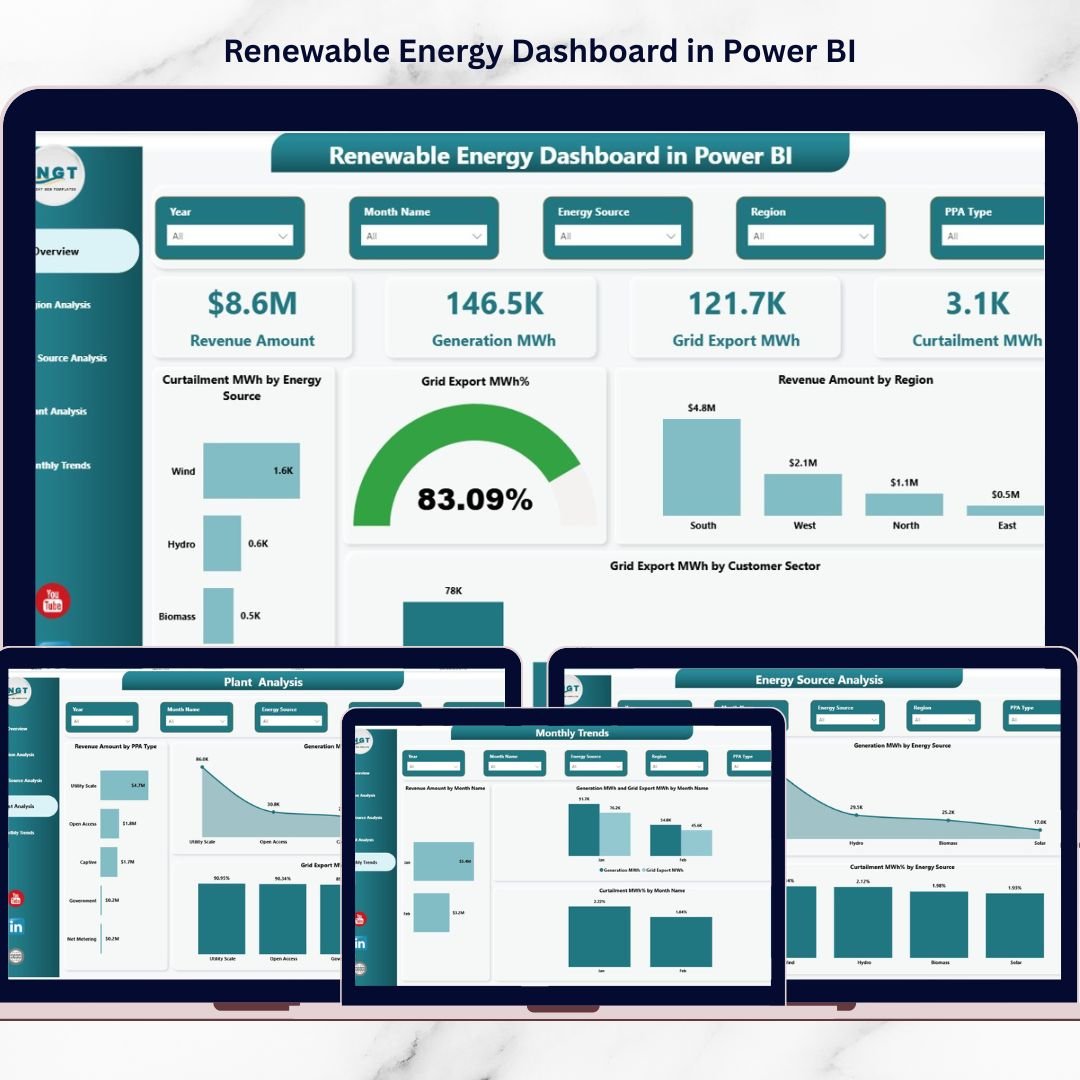
This dashboard includes five powerful analytical pages designed for complete renewable energy performance monitoring:
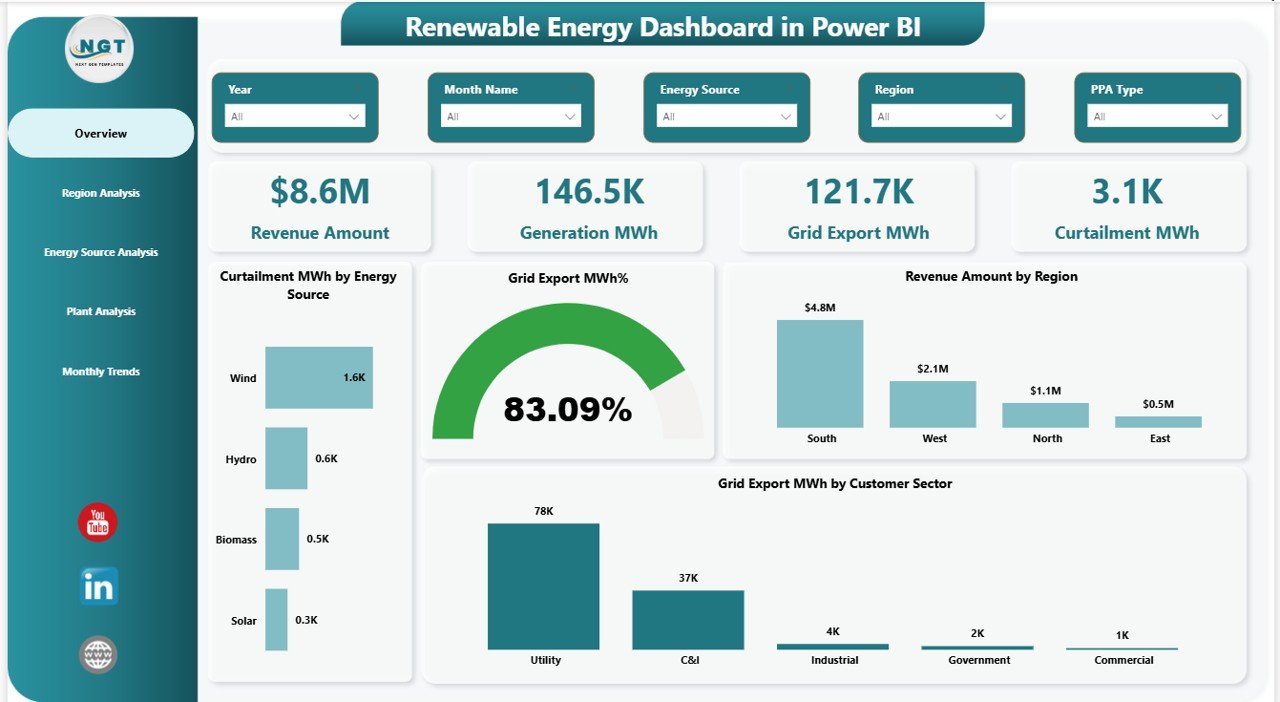
Overview Page – A centralized control panel displaying KPI cards such as Revenue Amount, Generation (MWh), Grid Export (MWh), and Curtailment metrics along with visual summaries.
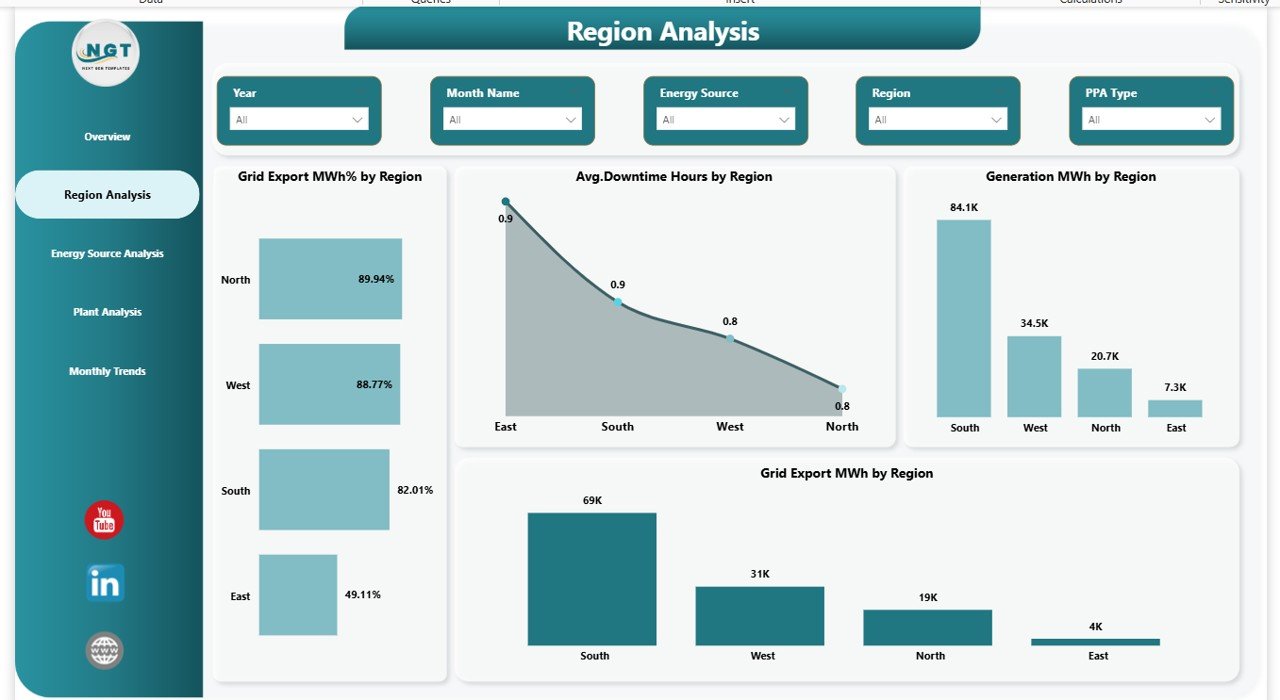
Region Analysis – Compare generation efficiency, downtime hours, and export performance across geographic regions.
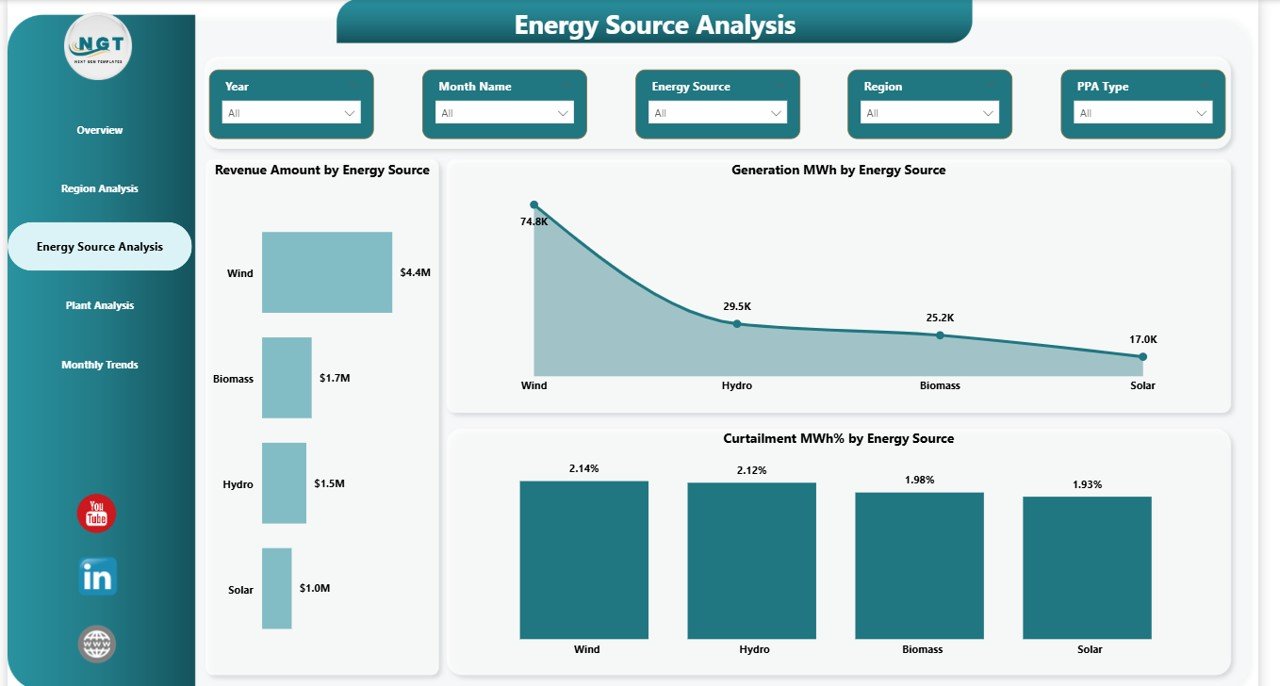
Energy Source Analysis – Evaluate solar, wind, hydro, and other energy sources to identify the most profitable and efficient assets.
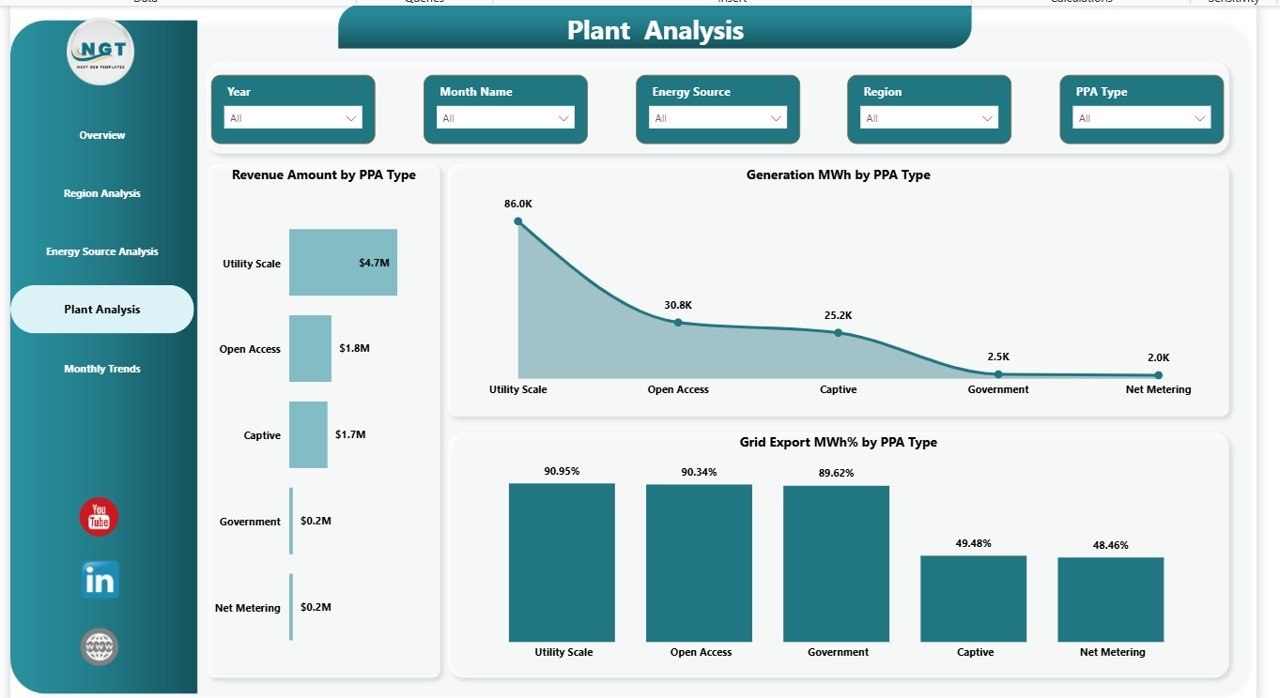
Plant / PPA Analysis – Analyze performance based on Power Purchase Agreement types and revenue impact.
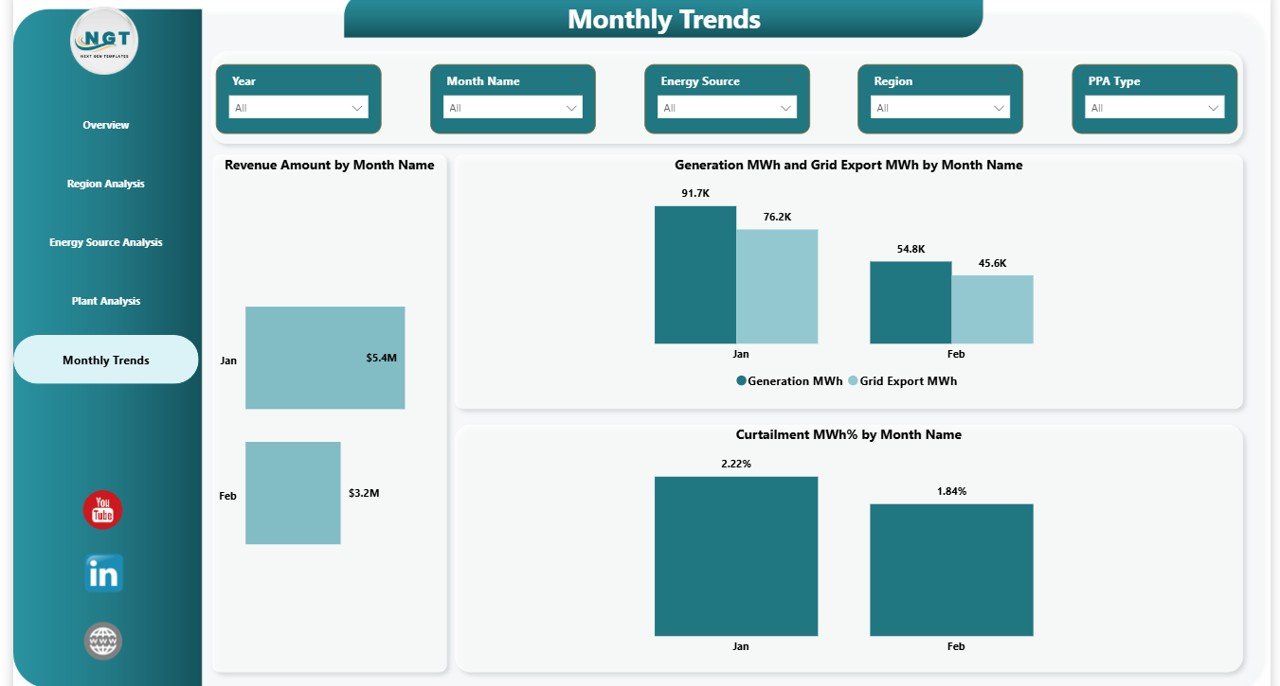
Monthly Trends Page – Track seasonal variations in generation, export, and revenue using trend visuals for better forecasting.
⚙️ How to Use the Renewable Energy Dashboard in Power BI
Using this dashboard is simple and requires minimal technical expertise:
-
Import your renewable energy operational data into Power BI.
-
Update datasets using structured tables.
-
Use slicers to filter by region, energy source, or time period.
-
Monitor KPIs instantly from the Overview page.
-
Drill down into detailed analysis pages for deeper insights.
-
Share reports securely with stakeholders for collaborative decision-making.
Within minutes, users can transform raw datasets into executive-level insights.
👥 Who Can Benefit from This Renewable Energy Dashboard in Power BI
This dashboard is ideal for professionals and organizations such as:
-
Renewable energy companies
-
Solar and wind farm operators
-
Energy analysts and consultants
-
Utility and power distribution companies
-
Sustainability managers
-
Government energy departments
-
Investors and project stakeholders
Anyone responsible for monitoring renewable energy performance can use this dashboard to simplify analysis and improve outcomes.
By implementing this dashboard, organizations gain clear visibility into operational efficiency, financial performance, and sustainability progress. Instead of reacting to problems late, teams proactively identify opportunities for optimization and growth.
The result? Better decisions, improved profitability, and stronger renewable energy management.
Click here to read the Detailed blog post
Watch the step-by-step video tutorial:


