


Religious and faith-based organizations manage several activities every single day—events, donations, volunteer programs, community outreach, and member support. But without a proper tracking system, leaders often struggle to understand growth, performance, and impact. The Religious & Faith-Based Organizations KPI Dashboard in Power BI is designed to solve exactly this challenge. It brings all essential KPIs together into a single, interactive dashboard that helps you make smarter decisions and improve your organization’s overall efficiency and community engagement.
This dashboard transforms complex data into easy-to-understand visuals. Whether you are tracking attendance trends, volunteer involvement, donation patterns, or outreach programs, the dashboard presents everything in a clean and structured format. It is ideal for churches, temples, mosques, ministries, and nonprofit faith-based institutions that want clarity, transparency, and real-time insights.Religious & Faith-Based Organizations KPI Dashboard in Power BI
✨ Key Features of Religious & Faith-Based Organizations KPI Dashboard in Power BI
📊 1. Fully Interactive Summary Page
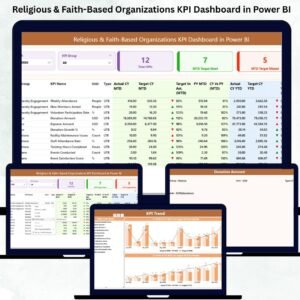
The Summary Page displays all performance indicators in one place. With dynamic slicers for Month and KPI Group, you can instantly analyze KPIs such as donations, attendance, membership, or volunteer activity. It also includes:
-
🔹 Total KPI Count
-
🔹 MTD Target Met
-
🔹 MTD Target Missed
A detailed KPI table shows Actuals, Targets, YTD, Previous Year comparison, and icon-based performance indicators.
📈 2. Trend Analysis Using Dynamic Combo Charts
The Trend Page helps leaders track performance improvements month by month. By selecting any KPI from the slicer, you can instantly compare:
-
Current Year vs Previous Year
-
Monthly Targets vs Actuals
-
YTD Patterns
This helps identify growth areas, seasonal trends, and performance gaps.
📘 3. KPI Definition Drill-Through Page
Every KPI is defined clearly through a powerful drill-through page. It includes:
-
KPI Name
-
KPI Number
-
KPI Group
-
KPI Definition
-
Unit
-
Formula
-
Type (UTB or LTB)
This ensures all teams follow consistent measurement standards.

📦 What’s Inside the Religious & Faith-Based Organizations KPI Dashboard in Power BI
This digital product includes:
✨ Power BI Dashboard File (.PBIX)
✨ Excel Data Source with Three Sheets:
-
KPI Definition
-
Input_Actual
-
Input_Target
✨ Interactive Visuals:
-
KPI Cards
-
Line/Column Charts
-
Trend Charts
-
Conditional Format Icons
-
Month & KPI Group Slicers
✨ Clean and Easy-to-Use Interface
Everything is structured so even beginners can update data easily.Religious & Faith-Based Organizations KPI Dashboard in Power BI
🛠️ How to Use the Religious & Faith-Based Organizations KPI Dashboard in Power BI
➡️ Step 1: Open the provided Excel file
Fill in the MTD and YTD values in the Input_Actual sheet and update targets in the Input_Target sheet.
➡️ Step 2: Open the Dashboard in Power BI
Power BI loads the updated Excel file automatically.
➡️ Step 3: Use the slicers
Select month or KPI group to analyze specific areas such as donations, events, members, volunteers, or finances.
➡️ Step 4: Review performance icons
Green ▲ means the KPI met the target.
Red ▼ indicates the KPI missed the target.
➡️ Step 5: Explore trend charts
Click on any KPI to compare current year vs previous year performance.
➡️ Step 6: Drill-through for KPI definitions
Right-click any KPI on the Summary Page to learn its formula, unit, and definition.
👥 Who Can Benefit from This Religious & Faith-Based Organizations KPI Dashboard in Power BI
This dashboard is designed for anyone involved in managing faith-based operations, including:
✨ Pastors and Spiritual Leaders – Track community engagement and program success.
✨ Church/Temple/Mosque Administrators – Monitor attendance, events, finances, and volunteer activity.
✨ Finance Committees – Understand donation trends and manage financial transparency.
✨ Program Coordinators – Improve outreach, youth programs, and community events.
✨ Volunteer Managers – Track volunteer hours, participation, and impact.
✨ Nonprofit Leadership Teams – Analyze performance for grants and donor reporting.
✨ Data-Driven Organizations – Use KPIs to strengthen trust and accountability.
Whether you run a small group or a large multi-location institution, this dashboard helps you organize operations, improve planning, and create a stronger community impact.
### Click here to read the Detailed blog post


Reviews
There are no reviews yet.