Managing purchasing operations in a refinery is complex and demanding. Refineries handle high-value procurement, multiple vendors, strict budgets, and continuous operational needs. When purchasing data is scattered across spreadsheets, invoices, and manual reports, teams lose visibility, costs increase, and decision-making slows down.
That is exactly why the Refinery Purchasing Dashboard in Excel is a powerful and essential solution. 🚀
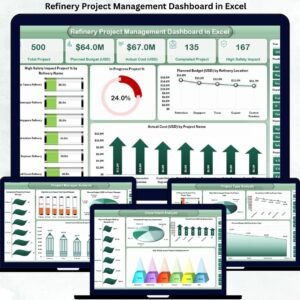
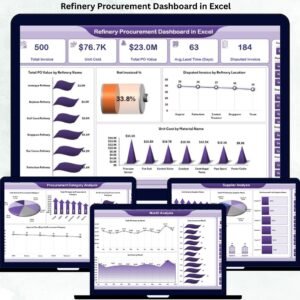
This professionally designed dashboard helps refinery teams track purchases, monitor spending, analyze supplier performance, and control costs — all from a single, easy-to-use Excel file.
With clear visuals, automated calculations, and structured analysis, this dashboard transforms raw purchasing data into meaningful insights that support faster and smarter decisions.
Key Features of Refinery Purchasing Dashboard in Excel 🔑
📊 Centralized Purchasing Control
Monitor all refinery purchasing activities from one consolidated dashboard.
📈 Real-Time Cost Visibility
Track total cost, baseline cost, high-priority spending, and budget utilization instantly.
🧭 Easy Page Navigation
Built-in page navigator allows smooth movement across dashboard sections.
📉 Category & Department Analysis
Identify which categories and departments consume the highest budget.
📅 Monthly Trend Monitoring
Track purchasing trends over time to improve forecasting and planning.
⚡ Quick Decision Support
Visual KPIs make it easy to identify cost overruns and priority purchases.
💼 Management-Ready Reporting
Perfect for reviews, audits, and procurement meetings.
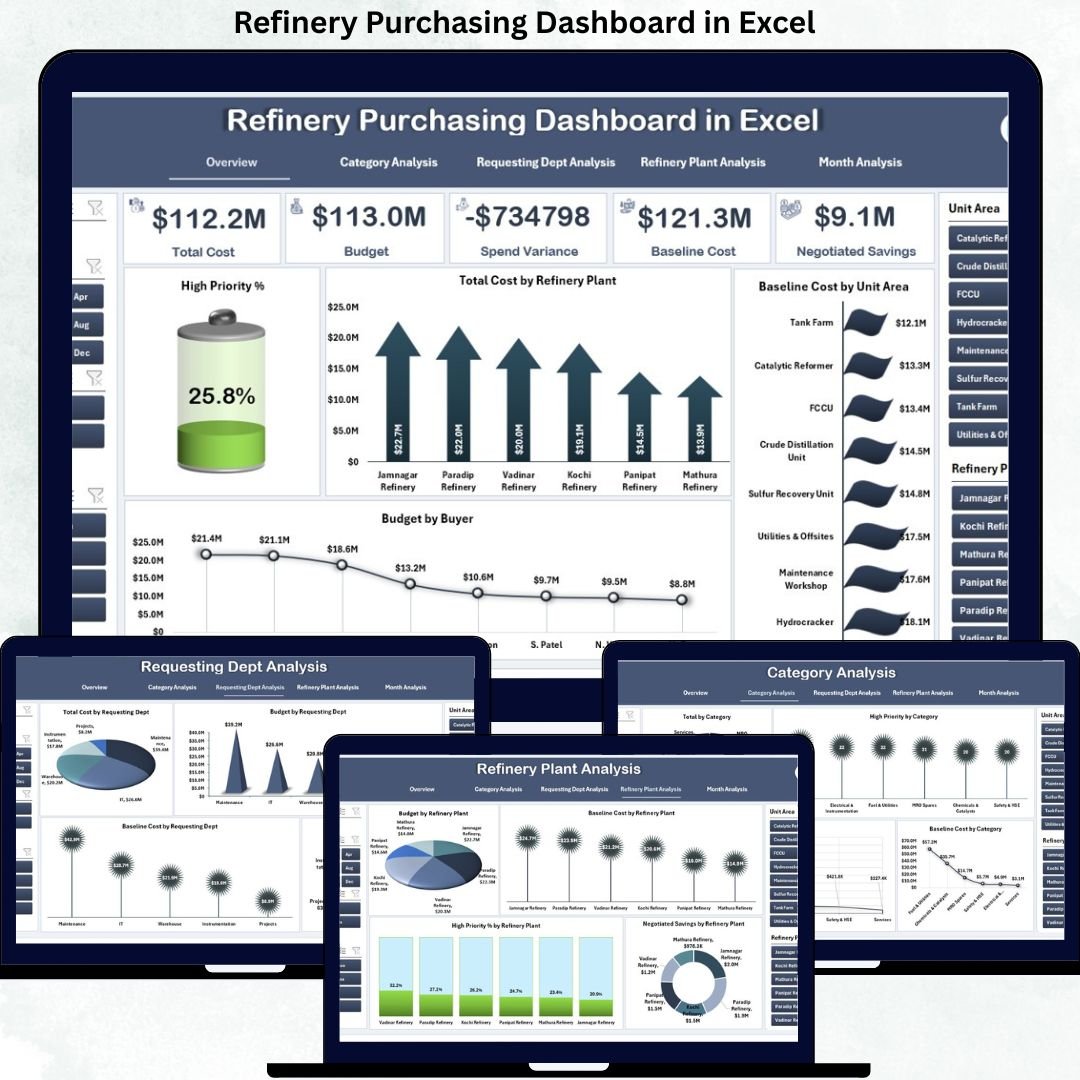
What’s Inside the Refinery Purchasing Dashboard in Excel 📁
This ready-to-use Excel dashboard contains multiple analytical pages designed for complete purchasing visibility.
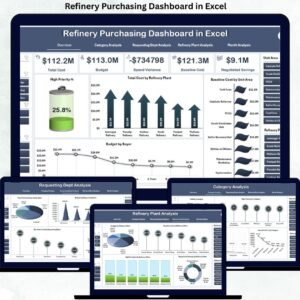
📄 Overview Page
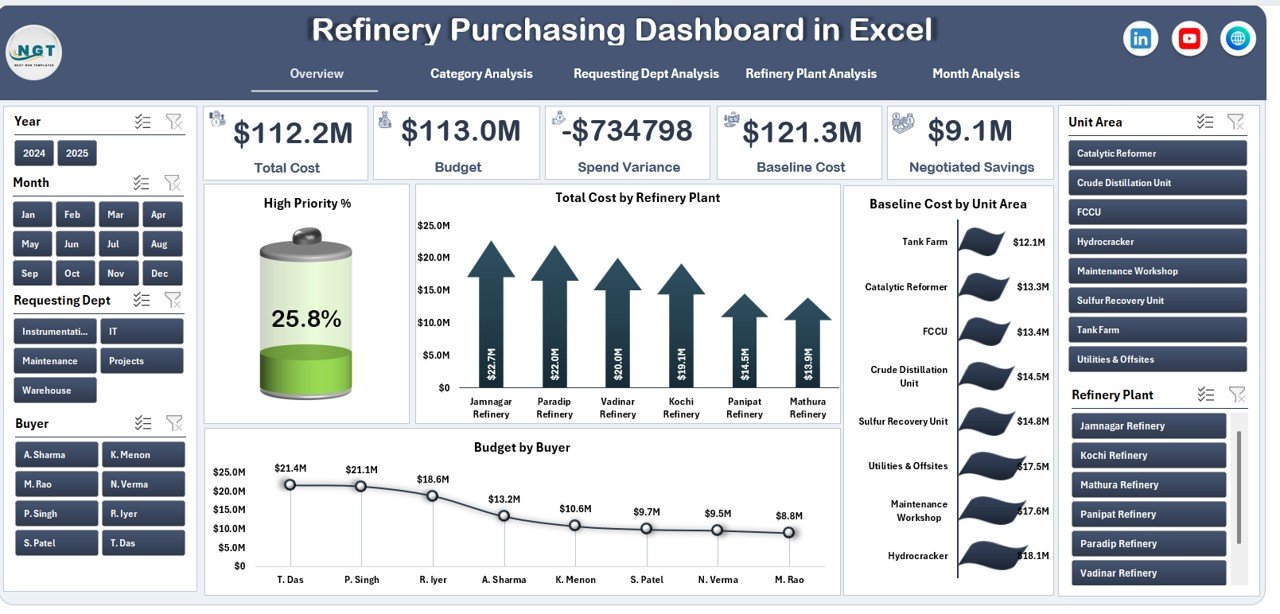
Acts as the control center of the dashboard and includes:
-
High Priority %
-
Total Cost by Refinery Plant
-
Baseline Cost by Unit Area
-
Budget by Buyer
This page gives instant insight into overall purchasing performance.
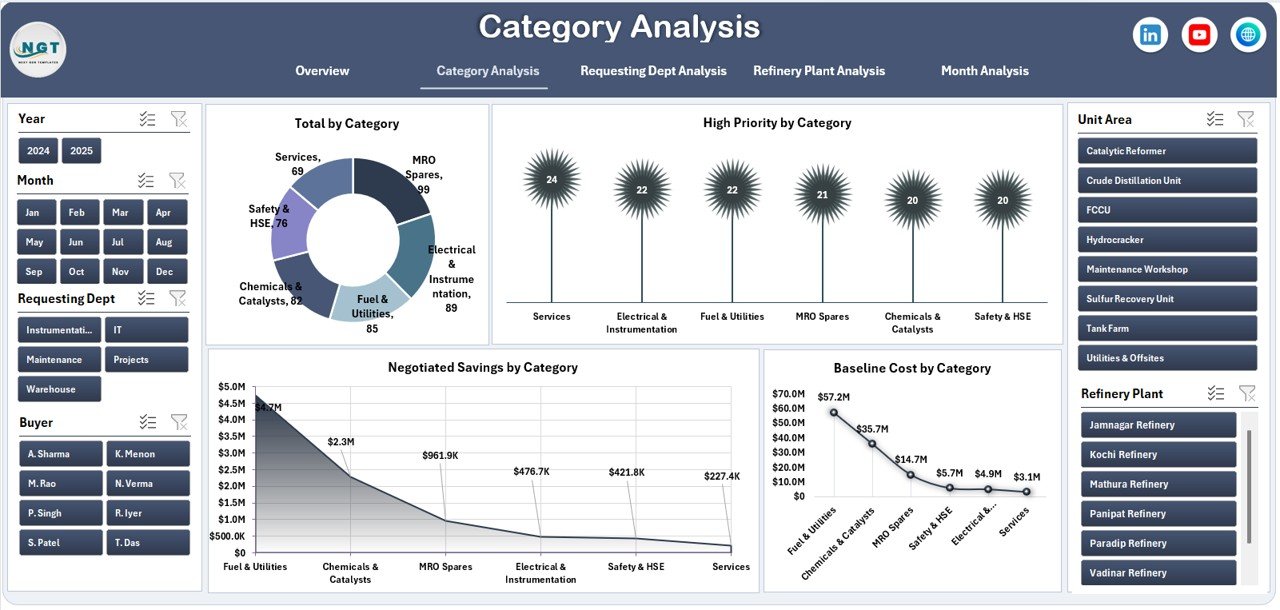
📄 Category Analysis Page
Shows spending patterns across purchasing categories using:
-
Total Cost by Category
-
High Priority Purchases
-
Negotiated Savings
-
Baseline Cost Comparison
Helps identify high-cost categories and optimization opportunities.
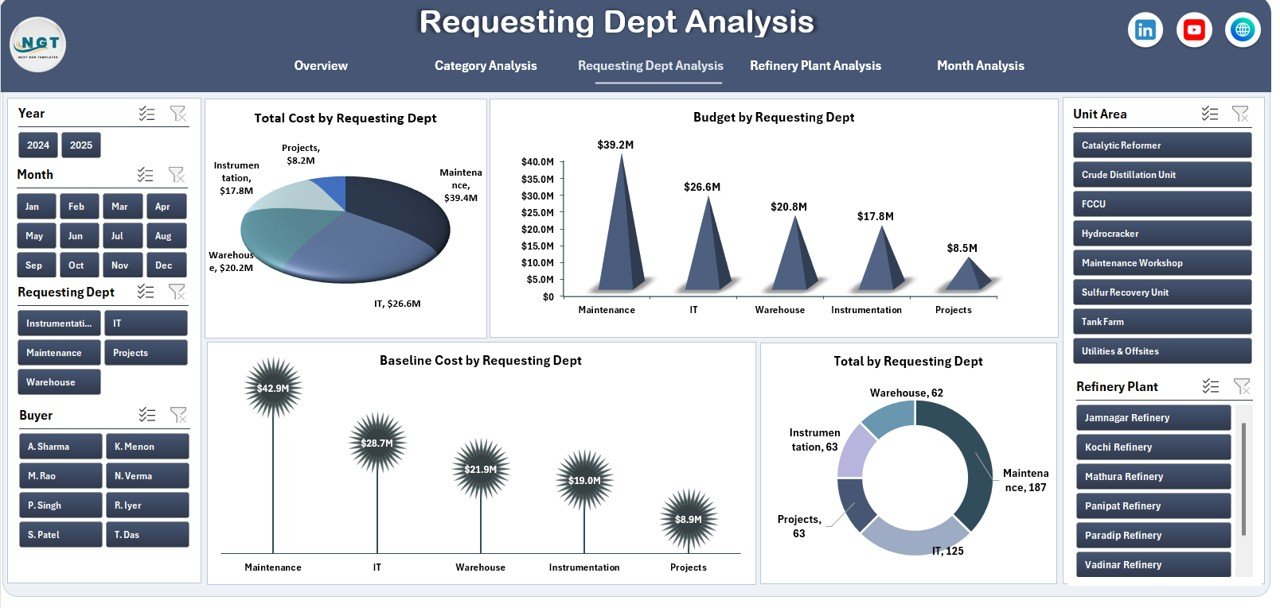
📄 Requesting Department Analysis Page
Tracks department-wise purchasing using:
-
Total Cost by Department
-
Budget Utilization
-
Baseline Cost
-
Purchase Request Volume
Improves accountability and budget control.
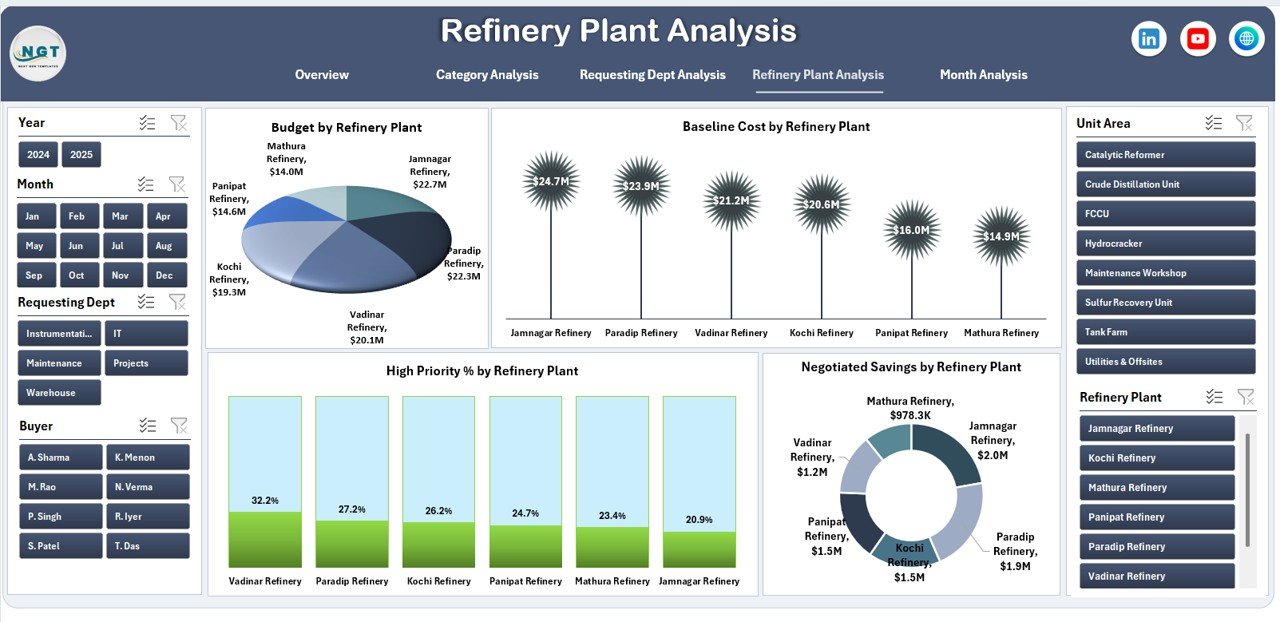
📄 Refinery Plant Analysis Page
Provides plant-level insights through:
-
Budget by Refinery Plant
-
Baseline Cost by Plant
-
High Priority %
-
Negotiated Savings
Supports cost optimization across refinery locations.
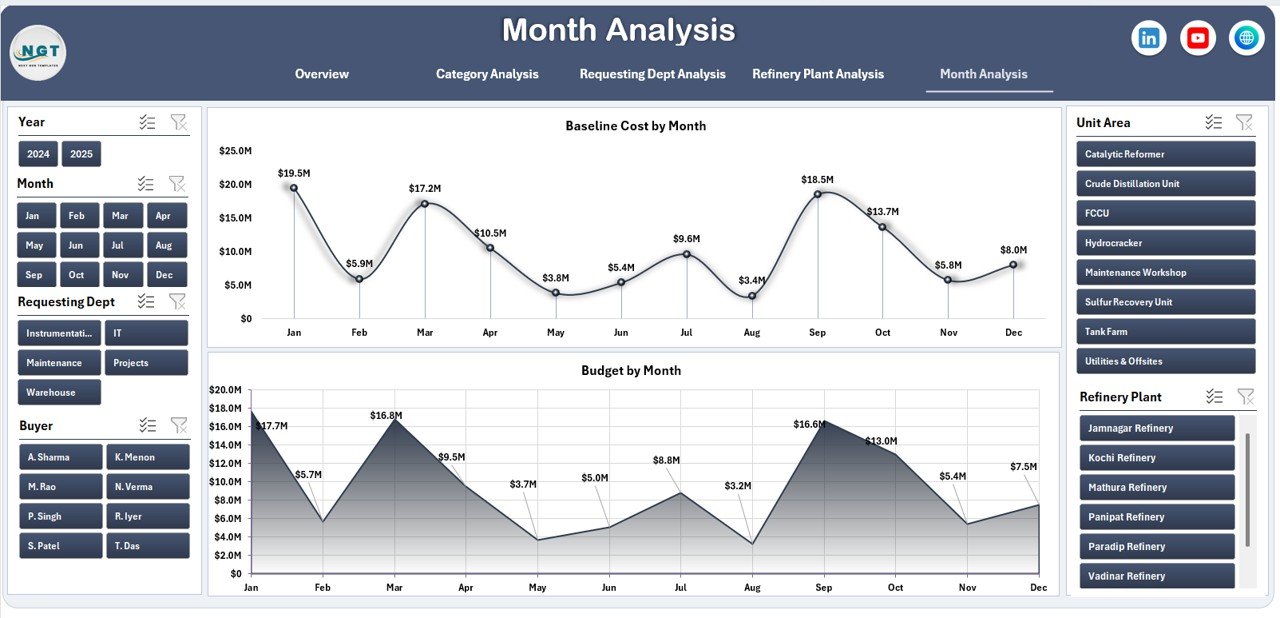
📄 Month Analysis Page
Tracks time-based purchasing trends using:
-
Budget by Month
-
Baseline Cost by Month
Helps forecast future expenses and control monthly spending.
📄 Data Sheet & Support Sheet
-
Stores raw purchasing data
-
Handles calculations and dropdowns
-
Powers all dashboard visuals automatically
How to Use the Refinery Purchasing Dashboard in Excel 🛠️
1️⃣ Enter or update purchasing data in the Data Sheet
2️⃣ Use slicers to filter by plant, category, department, or month
3️⃣ View charts and KPIs update instantly
4️⃣ Identify high-cost areas and priority purchases
5️⃣ Use insights for reporting and decision-making
No advanced Excel skills required — the dashboard works automatically.
Who Can Benefit from This Refinery Purchasing Dashboard 👥
🏭 Refinery Procurement Teams – Track purchases and vendor spending
📦 Supply Chain Managers – Control material and service costs
💰 Finance & Budget Teams – Monitor expenses and budget utilization
⚙️ Operations Managers – Improve purchasing efficiency
📊 Management & Auditors – Review spending and compliance
Ideal for both small and large refinery operations.


Reviews
There are no reviews yet.