


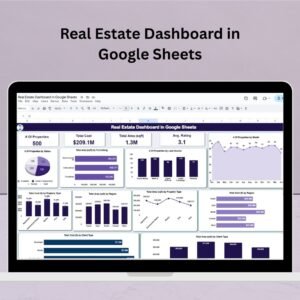
Managing properties, tracking performance, and visualizing data no longer require expensive software or complex tools. Say hello to the Real Estate Dashboard in Google Sheets—your all-in-one solution to stay on top of listings, costs, client types, and much more, all from the comfort of a dynamic spreadsheet.Real Estate Dashboard in Google Sheets
Whether you’re a realtor, agency, property manager, or investor, this dashboard is built to provide actionable insights, save time, and improve your decision-making process. 🔍📈Real Estate Dashboard in Google Sheets

💡 Key Features of Real Estate Dashboard in Google Sheets
1. Dashboard Tab – Instant Visual Insights
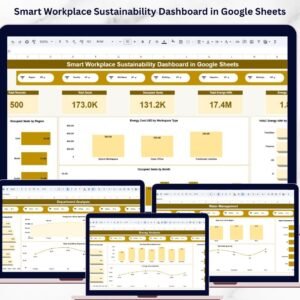
The Dashboard is the main tab of this tool, displaying all vital real estate KPIs with interactive cards and charts. Simply enter data into the Data tab, and the dashboard will automatically update with:
-
📌 # of Properties
-
💰 Total Property Cost
-
📏 Total Area (sqft)
-
⭐ Average Property Rating
You also get dynamic visual breakdowns like:
-
Properties by Status (Available, Sold, Under Offer)
-
Area by Furnishing (Furnished, Unfurnished, etc.)
-
Properties by Lead Source, Region, Client Type, and more.
📦 What’s Inside the Real Estate Dashboard
This template includes 3 well-structured worksheet tabs:
🟢 1. Dashboard Sheet Tab
Your visual command center with cards, charts, and real-time summaries.
🟡 2. Data Sheet Tab
Input all property listings here—address, price, area, status, furnishing, region, client type, and more. Each row updates the dashboard.
🔵 3. Support Sheet Tab
Manage all dropdown values here—ensures consistent data input and reduces spelling errors. Control values for status, furnishing, client types, etc.
Together, these tabs provide an ecosystem that’s clean, fast, and easy to manage!
🧭 How to Use the Real Estate Dashboard
Using this Google Sheets dashboard is as simple as 1-2-3:
-
Open the Google Sheet and navigate to the “Data” tab.
-
Add property listings row-by-row with all relevant fields.
-
Watch the Dashboard auto-update with charts and key figures!
No formulas to configure. No setup stress. Just plug and play.
💡 Pro Tip: Link a Google Form to automate data collection from your sales agents or field staff.
👥 Who Can Benefit from This Real Estate Dashboard?
This template is built for professionals across the real estate space:
-
🧑💼 Realtors & Agents – Track listings, sales, and performance metrics.
-
🏢 Property Managers – Monitor portfolios and property types.
-
💼 Agencies – Share the dashboard with internal teams and clients.
-
💰 Investors – Understand the value, area, and cost distributions easily.
-
📈 Marketing Teams – Monitor lead source performance visually.
Basically, if you’re in real estate—you need this!
✅ Advantages of This Dashboard
-
🔄 Real-Time Collaboration – Work with your team remotely on the same file.
-
📊 Automated Charts – Zero manual chart updates.
-
💡 Fully Customizable – Add columns, change visuals, or expand KPIs.
-
💵 Free & Accessible – Built in Google Sheets—no software cost.
-
📥 Easy Data Entry – Clean layout with dropdowns to minimize errors.
🛠 Opportunities for Enhancement
Take it to the next level with a few extra tweaks:
-
✉️ Google Apps Script to send alerts for status changes or unsold listings.
-
📆 Add Gantt view or timelines for renovation tracking.
-
📝 Add notes or comments for property feedback.
-
🔎 Enable filters or slicers for client segmentation.
-
📲 Optimize for mobile view or use Google Forms to populate data.
🧠 Best Practices
-
✅ Use dropdowns for status, furnishing, client type to avoid entry errors.
-
📅 Review and update the Data sheet weekly.
-
🎨 Use conditional formatting for urgent actions (e.g., unsold > 90 days).
-
🔐 Set appropriate sharing permissions (View vs Edit).
-
📤 Export monthly backups as Excel/PDF for records.
📚 Click here to read the Detailed blog post
Watch the step-by-step video Demo:


Reviews
There are no reviews yet.