Railway infrastructure is the backbone of national transportation systems. Governments and railway authorities manage extensive rail networks, tracks, signaling systems, bridges, stations, and operational assets. However, monitoring such a large infrastructure system becomes challenging when performance data is scattered across multiple spreadsheets and reports.
That is where the Railway Infrastructure KPI Dashboard in Excel becomes an essential performance monitoring solution.
This ready-to-use Excel dashboard allows railway organizations to track key infrastructure KPIs, compare targets with actual results, analyze trends, and monitor operational efficiency in a centralized environment. Instead of manually reviewing multiple reports, decision-makers can analyze infrastructure performance instantly using visual indicators, trend charts, and KPI comparisons.
Because the dashboard combines multiple KPI metrics into one interactive reporting system, railway managers gain better visibility into infrastructure performance and can make faster, data-driven decisions.
If you want to monitor railway infrastructure performance more effectively, this Excel dashboard provides a powerful and practical solution.
🚆 Key Feature of Railway Infrastructure KPI Dashboard in Excel
This structured Excel template includes 7 powerful worksheets designed to track railway infrastructure KPIs effectively.
🏠 Home Sheet Navigation – An index page with six navigation buttons for quick access to all dashboard sections.
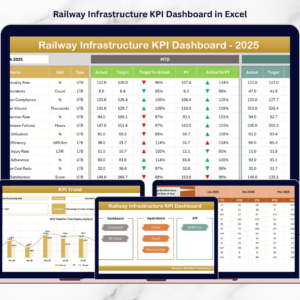
📊 Dynamic KPI Dashboard – Select the reporting month from the dropdown in Cell D3, and the entire dashboard updates automatically.
📈 MTD Performance Monitoring – Track Month-To-Date actual results, targets, and previous year performance.
📅 YTD Performance Tracking – Analyze Year-To-Date infrastructure performance and long-term trends.
🎯 Target vs Actual Analysis – Compare operational results against planned targets.
📉 Previous Year Benchmarking – Evaluate current performance against historical infrastructure data.
⬆️⬇️ Conditional Formatting Indicators – Up and down arrows instantly highlight performance improvement or decline.
📊 KPI Trend Analysis Charts – Visual charts show infrastructure performance trends across months.
Because the dashboard automatically updates calculations and visuals, managers can monitor railway performance without manual reporting.
📦 What’s Inside the Railway Infrastructure KPI Dashboard in Excel
The dashboard includes a complete KPI monitoring framework designed specifically for railway infrastructure operations.
Inside the template you will find:

✅ Home Sheet – Navigation center for easy dashboard access
✅ Dashboard Sheet – Main performance monitoring interface
✅ KPI Trend Sheet – Individual KPI performance analysis
✅ Actual Numbers Input Sheet – Data entry for operational results
✅ Target Sheet – KPI target management
✅ Previous Year Numbers Sheet – Historical KPI benchmarking
✅ KPI Definition Sheet – Documentation of KPI formulas and definitions
These worksheets work together to create a structured performance monitoring system.
Typical KPI data tracked in the dashboard includes:
Track availability
Signal system availability
Infrastructure inspection completion
Maintenance performance
Train punctuality rate
Safety incidents
Capacity utilization
Infrastructure maintenance costs
Because Excel supports formulas, pivot charts, and automation, the dashboard automatically updates insights whenever new data is entered.
⚙️ How to Use the Railway Infrastructure KPI Dashboard in Excel
Using the dashboard is simple and requires only basic Excel knowledge.
1️⃣ Define KPIs in the KPI Definition Sheet including name, unit, formula, and definition.
2️⃣ Enter KPI targets in the Target Sheet for each month.
3️⃣ Add previous year values in the Previous Year Numbers Sheet.
4️⃣ Enter current performance values in the Actual Numbers Input Sheet.
5️⃣ Select the reporting month from the dropdown in the Dashboard Sheet.
6️⃣ Review KPI comparisons, indicators, and trend charts.
Within seconds, the dashboard provides a complete overview of railway infrastructure performance.
Because calculations are automated, managers can focus on insights instead of manual analysis.
👥 Who Can Benefit from This Railway Infrastructure KPI Dashboard in Excel
This dashboard is designed for professionals responsible for railway infrastructure planning and monitoring.
It is particularly useful for:
🚆 Railway Authorities
🛠 Infrastructure Maintenance Teams
📊 Railway Operations Managers
🏛 Government Transportation Departments
📈 Railway Project Managers
📉 Infrastructure Performance Analysts
Because the dashboard presents complex operational data in a simple visual format, both operational teams and executives can easily analyze performance metrics.
💡 Why This Dashboard Improves Railway Infrastructure Management
✔ Centralized monitoring of infrastructure KPIs
✔ Faster identification of maintenance issues
✔ Improved decision-making using data insights
✔ Better planning of infrastructure investments
✔ Enhanced safety and reliability monitoring
✔ Clear comparison of targets and actual performance
✔ Long-term trend analysis for infrastructure planning
✔ Simple Excel-based implementation with no complex software
Instead of relying on manual reporting systems, railway organizations can monitor infrastructure performance through a structured analytics framework.
This dashboard transforms raw operational data into actionable insights that support better railway infrastructure management.
### Click here to read the Detailed blog post
Visit our YouTube channel to learn step-by-step video tutorials
Youtube.com/@PKAnExcelExpert