Railway cargo operations play a critical role in national and cross-border logistics. Railway Cargo KPI Dashboard in Power BI However, managing cargo efficiency, meeting strict targets, controlling operating costs, and maintaining service reliability has become increasingly complex. Manual Excel reports, delayed reviews, and fragmented KPI tracking make it difficult for railway authorities and freight operators to respond quickly.
That is exactly why the Railway Cargo KPI Dashboard in Power BI is a must-have performance management solution.
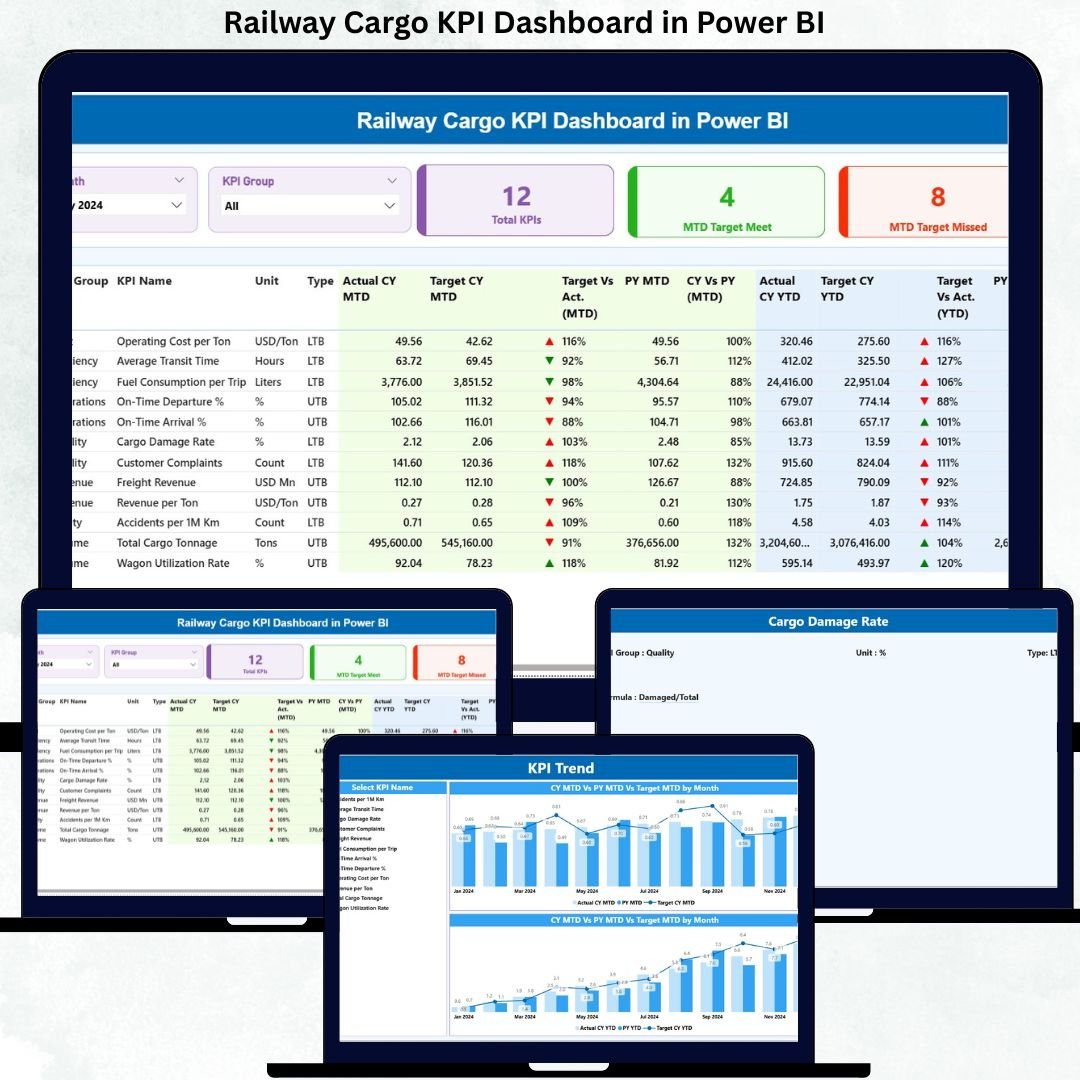
Railway Cargo KPI Dashboard in Power BI This ready-to-use Power BI dashboard converts raw cargo data into clear KPIs, interactive visuals, and meaningful trends. Instead of struggling with scattered files and static reports, decision-makers gain real-time visibility into target achievement, performance gaps, and historical comparisons—all in one professional dashboard. As a result, teams move from reactive reporting to proactive, data-driven control.
🔑 Key Features of Railway Cargo KPI Dashboard in Power BI
🚆 Centralized KPI Monitoring
Track all railway cargo KPIs in a single, interactive Power BI dashboard.
📊 MTD & YTD Performance Tracking
Monitor month-to-date and year-to-date actuals, targets, and variances instantly.
🎯 Target Met vs Target Missed Visibility
Visual indicators and counts show KPI achievement status at a glance.
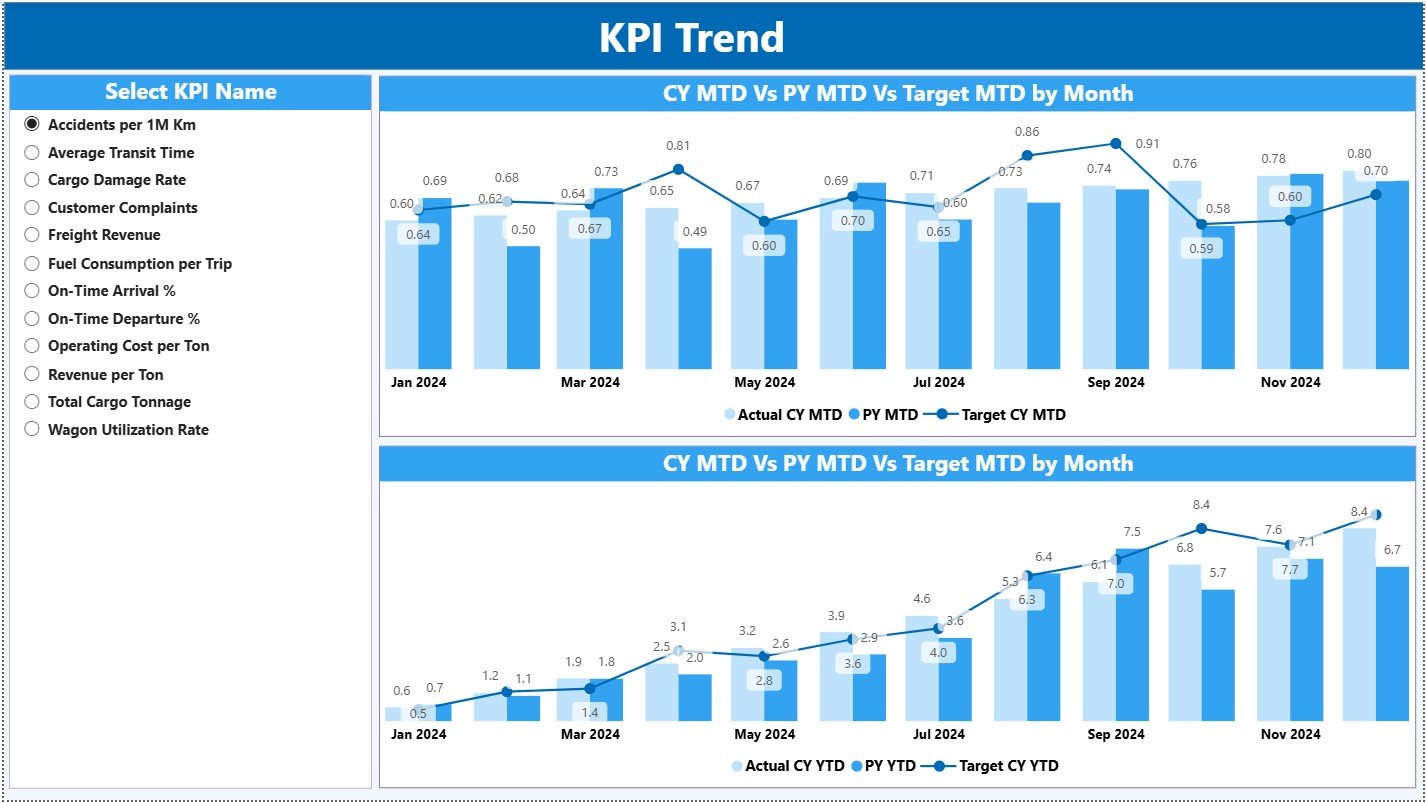
📈 Dynamic KPI Trend Analysis
Compare current year, previous year, and target values using combo charts.
🧭 Interactive Slicers
Filter insights by Month and KPI Group for focused analysis.
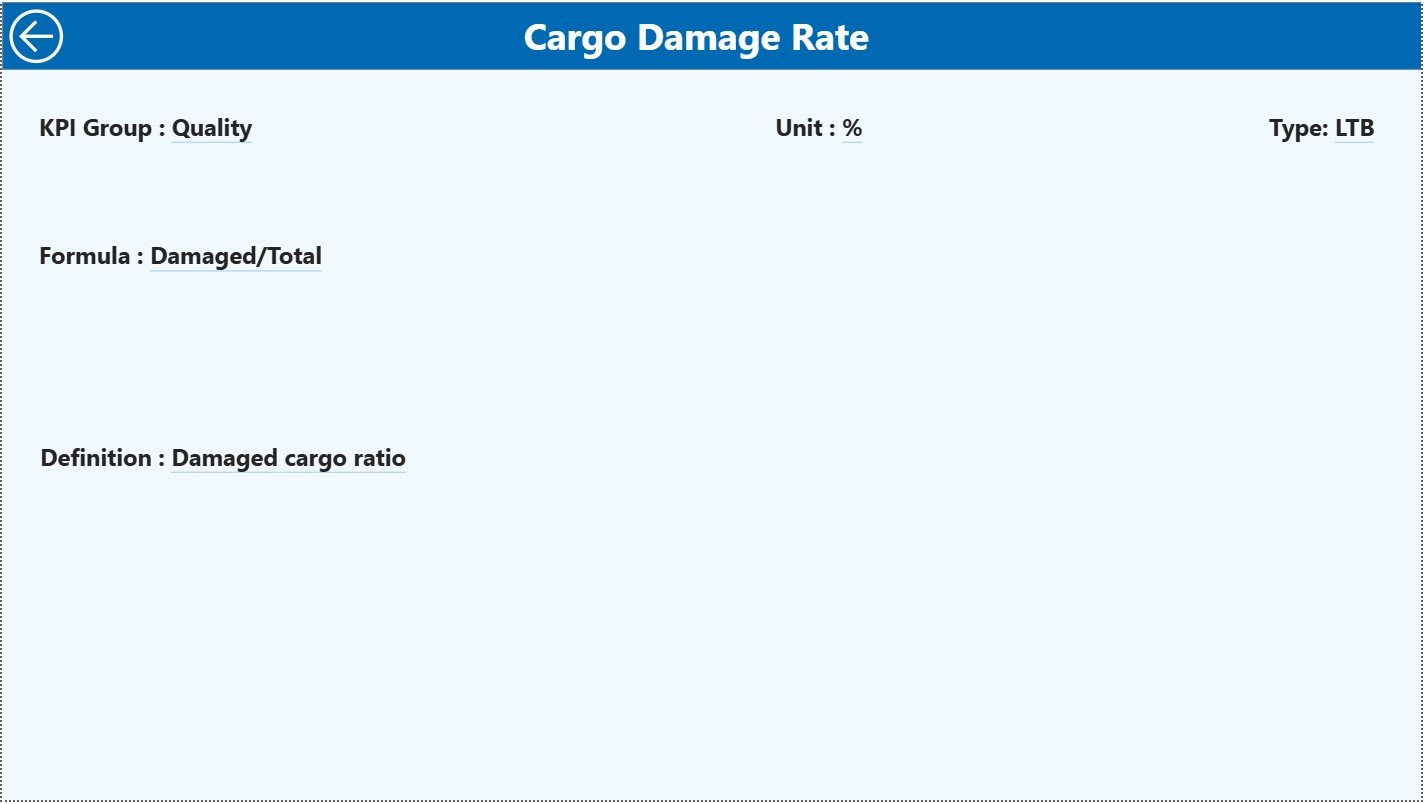
📘 Built-in KPI Definition Reference
Access KPI formulas, definitions, and LTB/UTB logic through drill-through.
⚙️ Excel-Based Data Source
Update data easily without complex systems or integrations.
📦 What’s Inside the Railway Cargo KPI Dashboard in Power BI
This dashboard includes three purpose-driven analytical pages:
📊 Summary Page
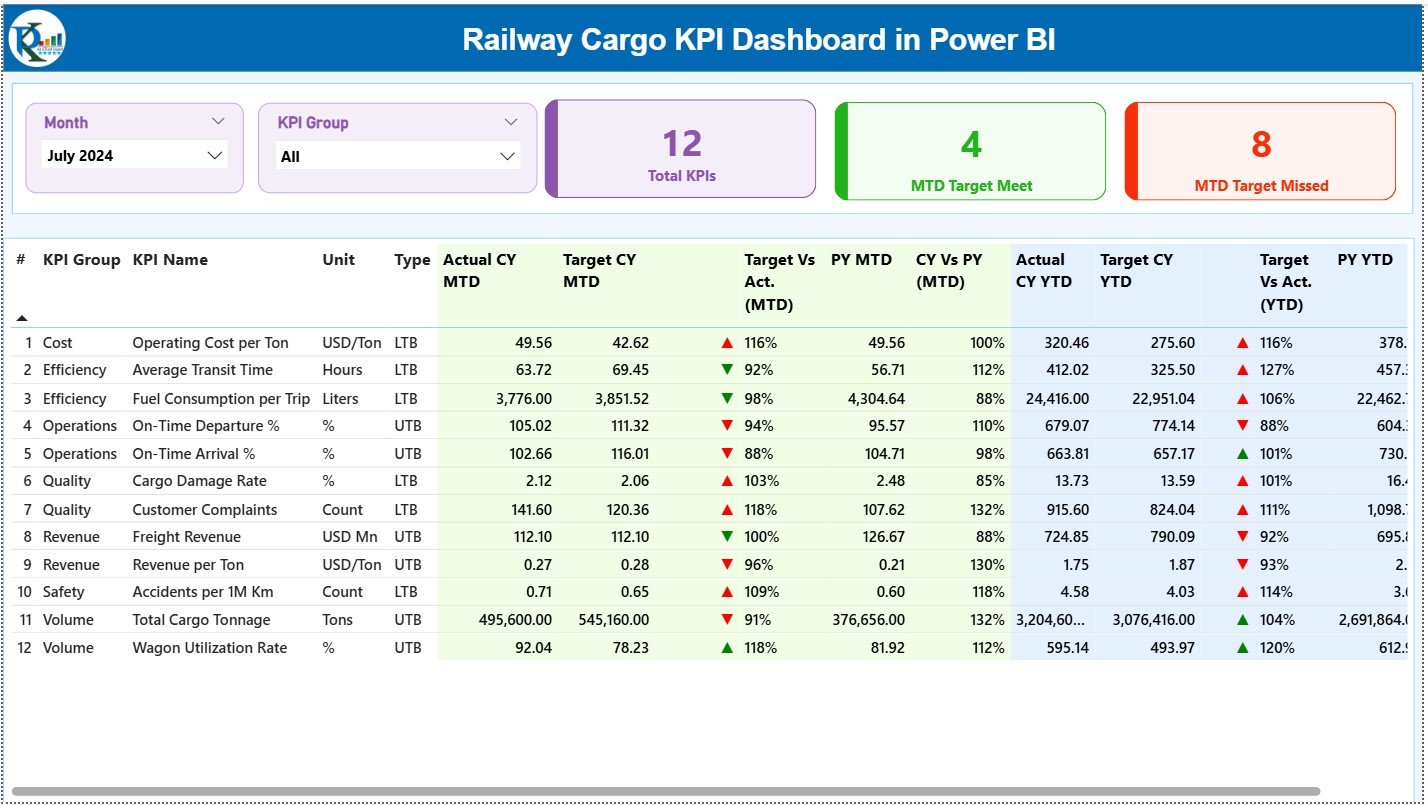
Acts as the performance control center with Month and KPI Group slicers.
Displays KPI cards for:
-
Total KPIs Count
-
MTD Target Met Count
-
MTD Target Missed Count
Below the cards, a detailed KPI table shows:
-
Actual vs Target (MTD & YTD)
-
CY vs PY comparisons
-
Status icons for quick decision-making
📈 KPI Trend Page
Focuses on time-based performance analysis using:
-
KPI Name slicer
-
Combo charts comparing CY Actual, PY Actual, and Targets
Helps identify seasonality, improvement trends, and performance gaps.
📘 KPI Definition Page
A hidden drill-through page that provides:
-
KPI Formula
-
KPI Definition
-
KPI Type (LTB or UTB)
Ensures consistency and clarity across teams.
▶️ How to Use the Railway Cargo KPI Dashboard in Power BI
Using this dashboard is simple and business-friendly:
1️⃣ Enter actual KPI data in the Input Actual Excel sheet
2️⃣ Enter target values in the Input Target Excel sheet
3️⃣ Maintain KPI master data in the KPI Definition sheet
4️⃣ Refresh the Power BI file
5️⃣ Apply slicers to analyze performance
6️⃣ Review KPI status, trends, and comparisons
7️⃣ Take corrective or strategic actions
No advanced Power BI expertise is required.
🎯 Who Can Benefit from This Railway Cargo KPI Dashboard in Power BI
🚆 Railway Operations Managers – Monitor efficiency and target achievement
📦 Freight & Cargo Planners – Track performance across KPI groups
📊 Logistics Analysts – Analyze trends and comparisons effortlessly
💰 Finance & Performance Teams – Align targets with results
🏢 Senior Railway Executives – Access decision-ready insights instantly
Whether you manage regional freight or national cargo operations, this dashboard scales with ease.
👉 Click here to read the Detailed Blog Post
🔔 Visit our YouTube channel to learn step-by-step video tutorials
👉 YouTube.com/@PKAnExcelExpert


Reviews
There are no reviews yet.