Managing railway freight operations is a complex task. Every day, railway companies transport large volumes of commodities such as coal, steel, grain, cement, and industrial goods across multiple regions. Because freight operations involve multiple stakeholders, operational costs, and revenue streams, organizations must continuously monitor performance.
However, many railway companies still rely on manual reports and scattered spreadsheets to track cargo operations. As a result, decision-makers struggle to analyze freight revenue, monitor operating costs, track invoice payments, and evaluate profitability.
That is exactly where the Railway Cargo Dashboard in Power BI becomes a powerful analytics solution.
This professionally designed Power BI dashboard allows railway operators, logistics managers, and financial analysts to analyze cargo performance through a single interactive interface. Instead of reviewing multiple reports, users can instantly monitor freight revenue, operating costs, invoice status, and profitability across zones, commodities, wagon types, and months.
With clear visualizations and powerful insights, this dashboard helps railway organizations make faster, smarter, and more data-driven decisions.
🚆 Key Feature of Railway Cargo Dashboard in Power BI
✨ 5 Interactive Dashboard Pages
Analyze railway cargo operations from multiple perspectives including overview performance, commodity analysis, wagon type analysis, zone performance, and monthly trends.
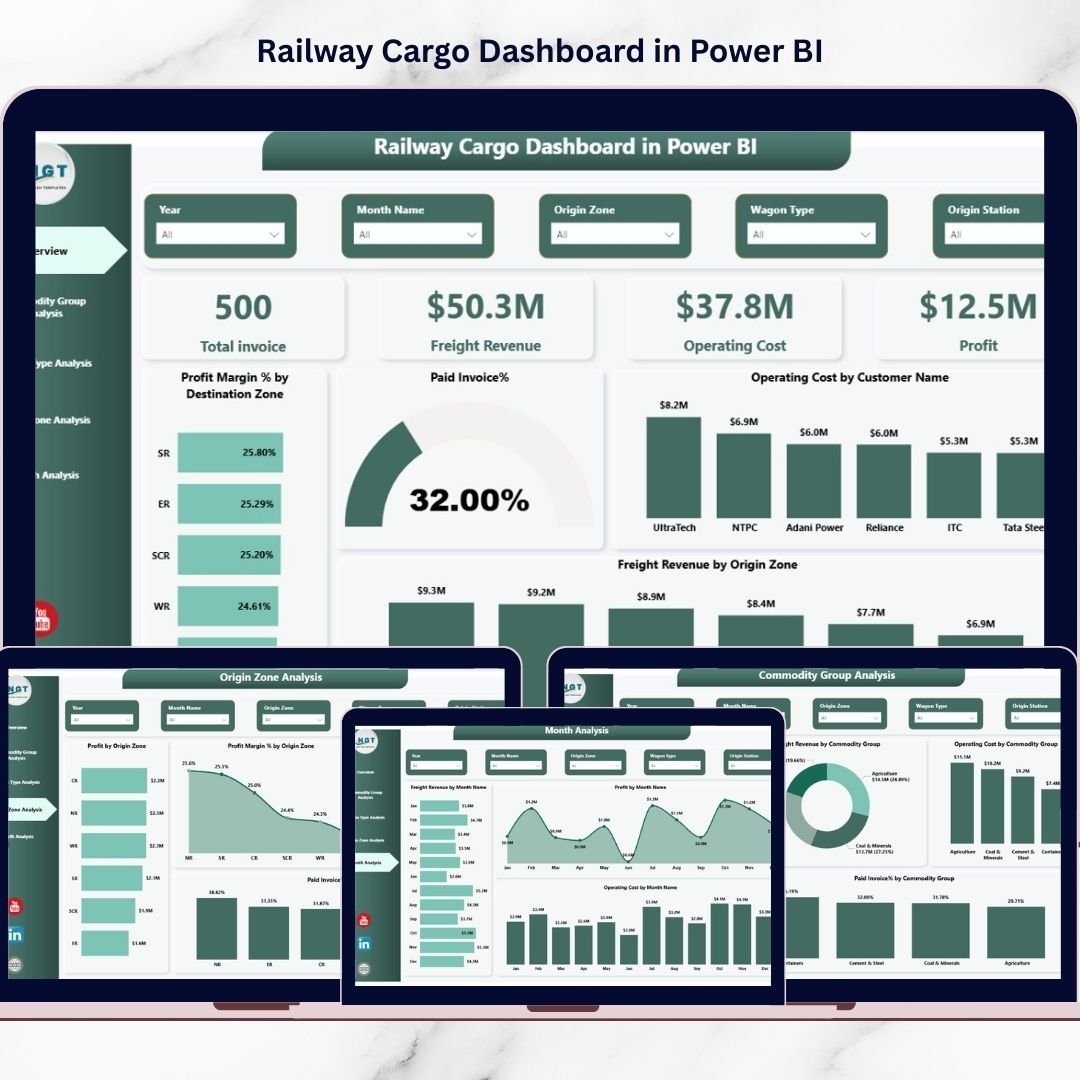
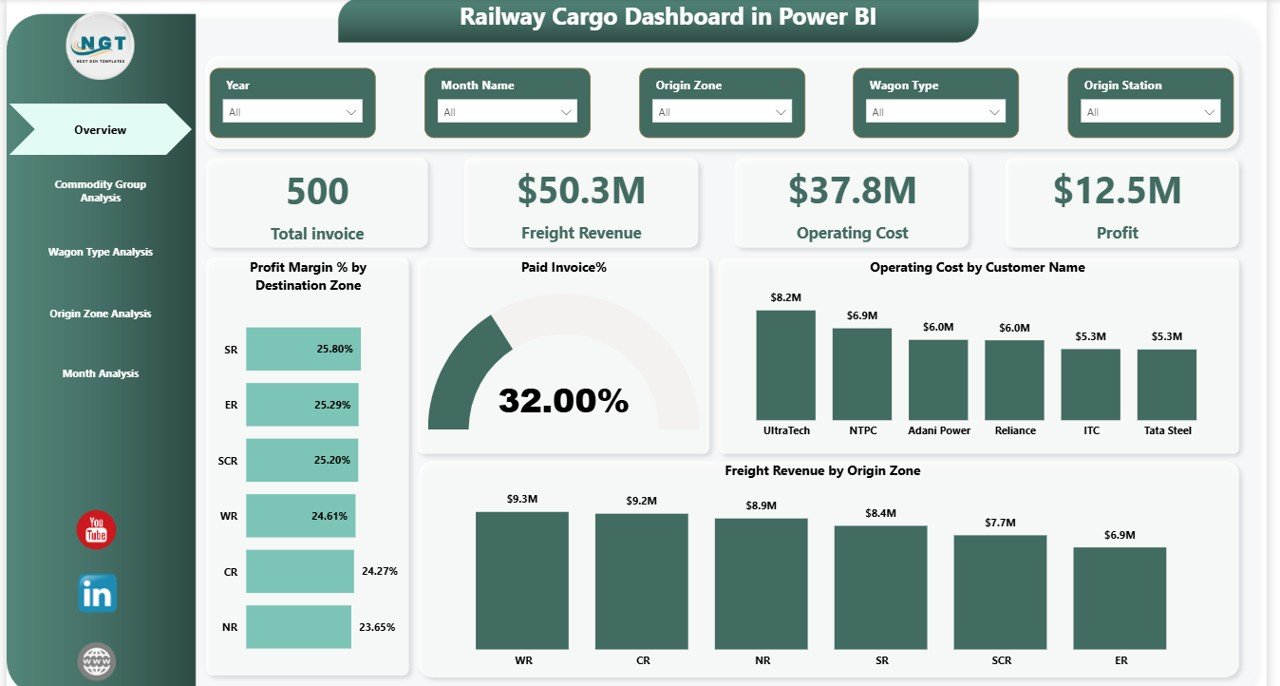
📊 Powerful KPI Monitoring
Track important KPIs such as Total Invoice, Freight Revenue, Operating Cost, Profit, and Profit Margin to evaluate operational performance quickly.
📈 Interactive Visual Charts
The dashboard includes dynamic charts such as Profit Margin by Destination Zone, Paid Invoice %, Operating Cost by Customer, and Freight Revenue by Origin Zone.
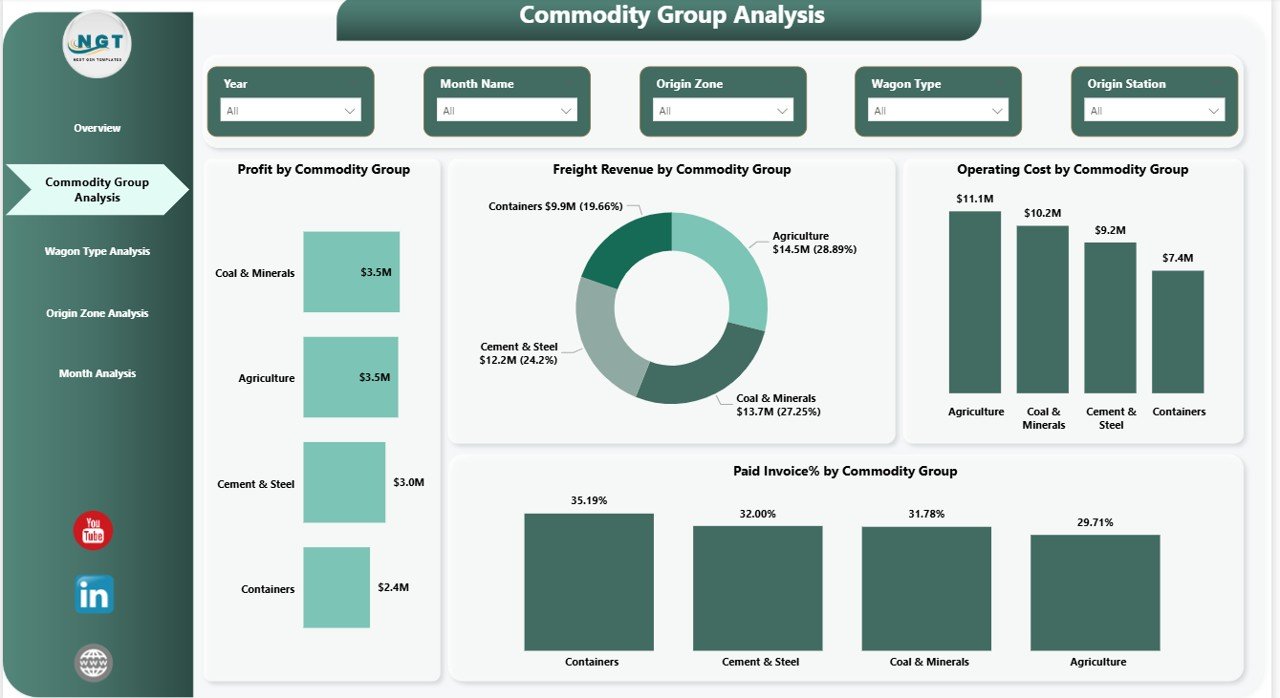
🔍 Commodity Group Analysis
Analyze profit, revenue, and cost distribution across different commodity categories transported through railway freight.
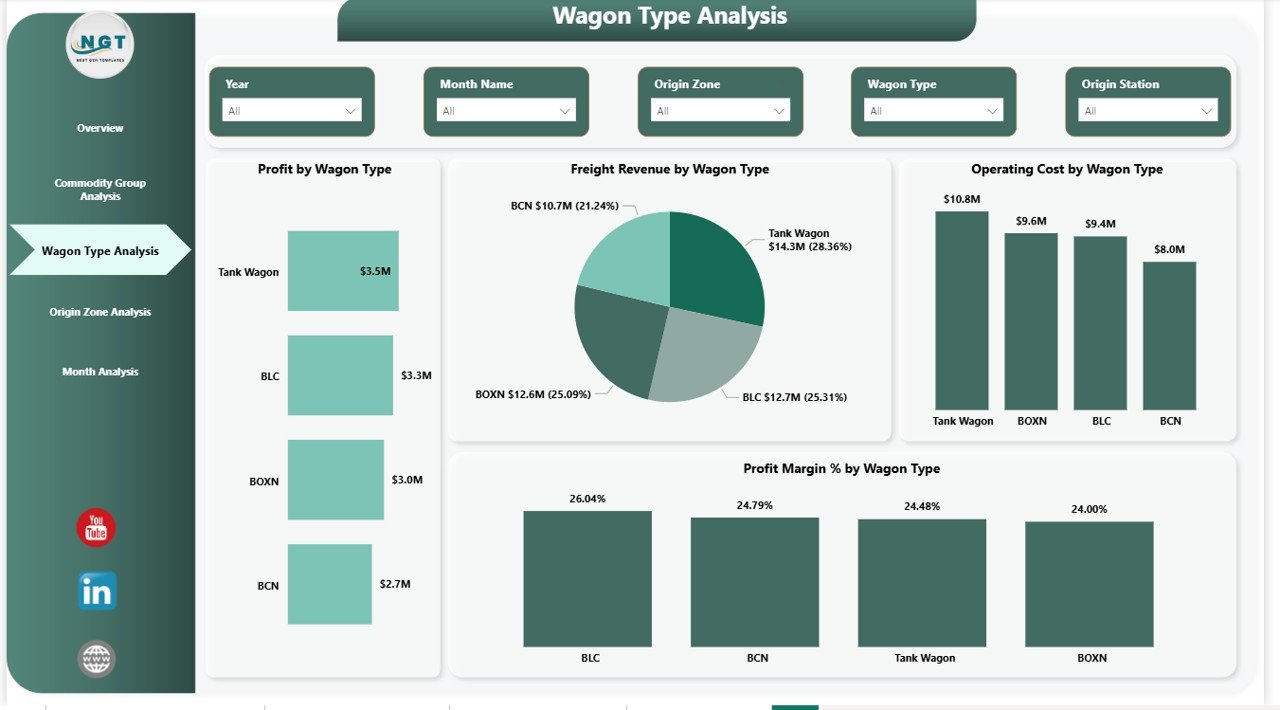
🚛 Wagon Type Performance Insights
Understand which wagon types generate the highest revenue and profitability while identifying high-cost wagon operations.
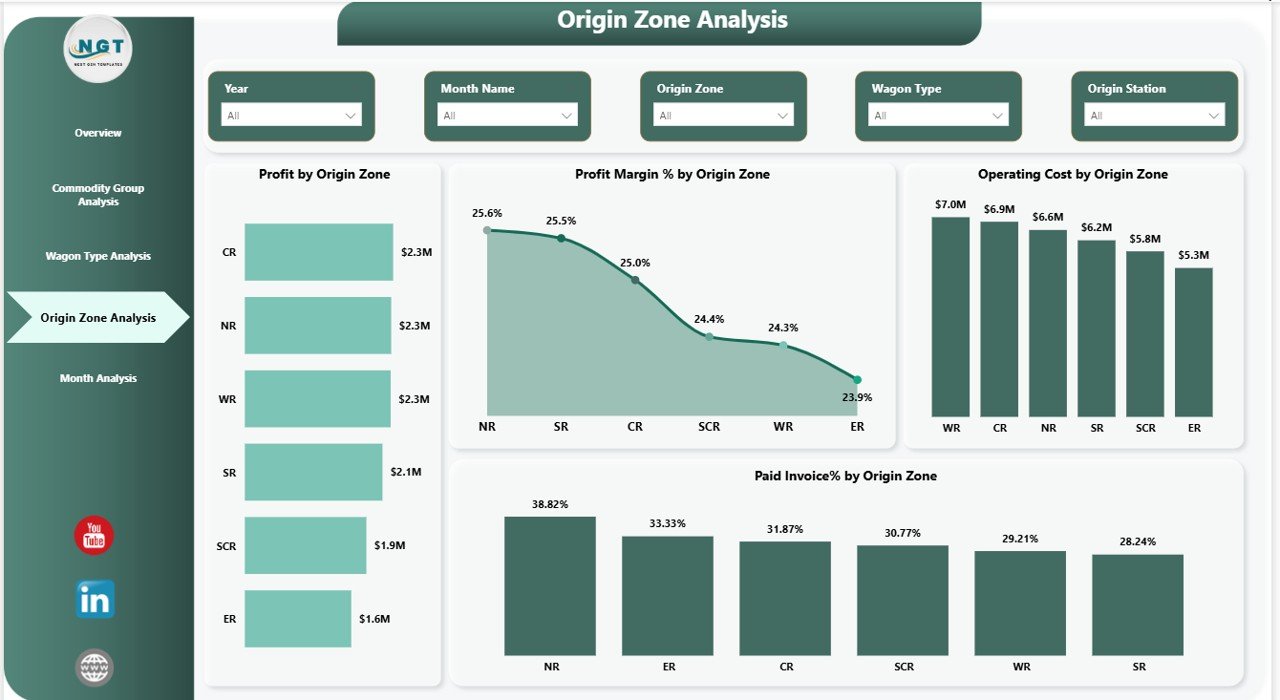
🌍 Zone-Wise Performance Tracking
Evaluate operational performance across different origin zones including revenue generation, operating cost distribution, and invoice payment rates.
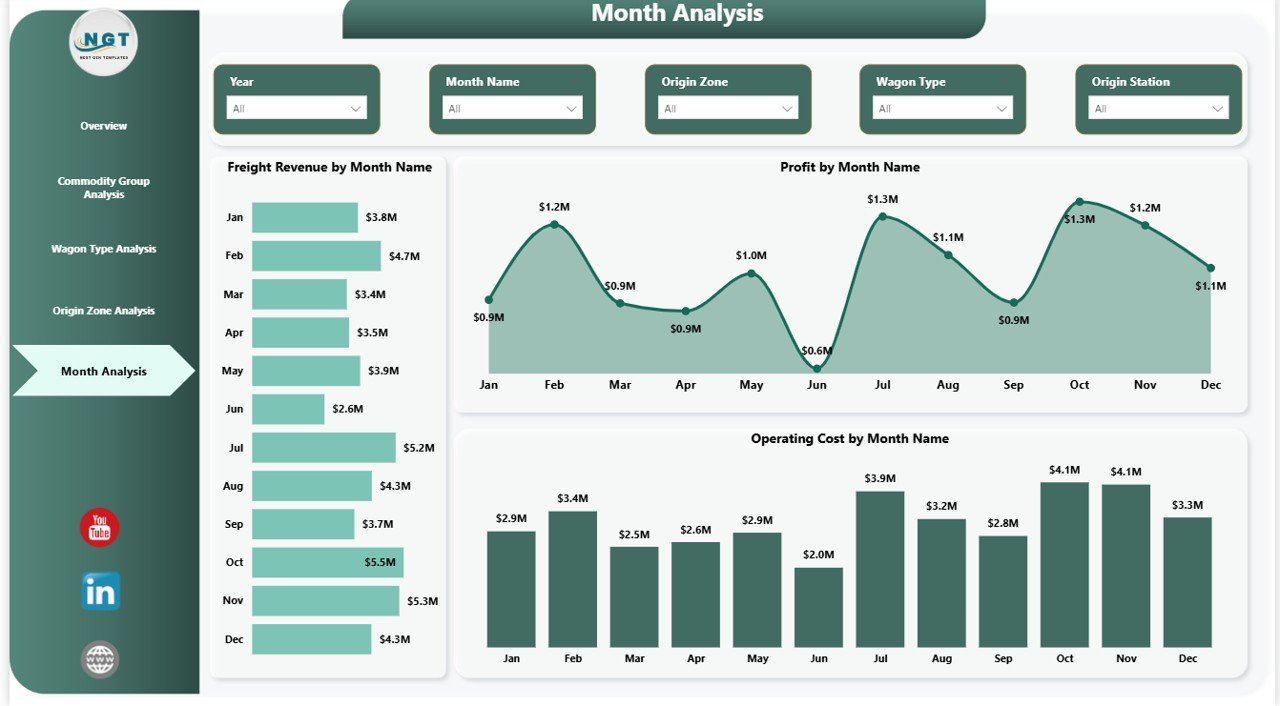
📅 Monthly Trend Analysis
Track freight revenue, profit, and operating cost trends across months to identify seasonal patterns and demand fluctuations.
⚡ Real-Time Data Visualization
Power BI’s interactive filters and slicers allow users to explore insights dynamically and drill down into operational data.
📦 What’s Inside the Railway Cargo Dashboard in Power BI
When you download this digital product, you receive a professionally built Power BI dashboard designed for railway freight analytics.
The template includes:
✔ 5 Fully Designed Dashboard Pages
1️⃣ Overview Page
Provides a quick snapshot of cargo performance with KPI cards and financial charts.
2️⃣ Commodity Group Analysis
Analyzes cargo performance across different commodity categories.
3️⃣ Wagon Type Analysis
Evaluates financial performance across various wagon types.
4️⃣ Origin Zone Analysis
Tracks freight revenue, cost, profit, and invoice performance by geographic zones.
5️⃣ Month Analysis
Displays monthly trends in freight revenue, operating costs, and profit.
✔ Interactive Filters (Slicers)
Users can analyze data by different dimensions such as zone, commodity group, wagon type, and month.
✔ Professionally Designed Layout
Clean design with business-ready visuals suitable for executive reporting and operational analysis.
✔ Ready-to-Use Power BI File
Simply import your data and start analyzing railway cargo performance instantly.
⚙️ How to Use the Railway Cargo Dashboard in Power BI
Using this dashboard is simple and user-friendly.
Step 1 – Download the Dashboard Template
Download the Power BI file from the product page after purchase.
Step 2 – Import Your Cargo Data
Connect the dashboard to your freight operations data such as invoices, revenue, operating costs, and shipment details.
Step 3 – Refresh the Dashboard
Update the dataset to populate charts and KPIs automatically.
Step 4 – Explore Interactive Insights
Use slicers and filters to analyze cargo performance by zone, commodity group, wagon type, and month.
Step 5 – Make Data-Driven Decisions
Use the insights to improve freight planning, optimize costs, and increase profitability.
👨💼 Who Can Benefit from This Railway Cargo Dashboard
This dashboard is designed for professionals working in railway freight, logistics, and transportation analytics.
🚆 Railway Operations Managers
Monitor cargo performance, freight volume, and operational efficiency.
💰 Finance & Accounting Teams
Track freight revenue, operating cost, profit margins, and invoice collection performance.
📦 Logistics Planners
Analyze commodity movement and optimize cargo scheduling.
📊 Business Analysts
Generate insights to improve operational strategies and resource allocation.
🏢 Senior Management & Executives
Evaluate financial and operational performance across railway cargo operations.
By using this dashboard, organizations can significantly improve operational visibility, cost control, and revenue optimization.
Click here to read the Detailed blog post
Watch the step-by-step video tutorial:
Visit our YouTube channel to learn step-by-step video tutorials
https://www.youtube.com/@PKAnExcelExpert