


Radiology and imaging departments play a critical role in modern healthcare. Every scan, report, and diagnostic decision directly impacts patient outcomes, clinical efficiency, and hospital performance. However, when performance data is scattered across spreadsheets and static reports, leaders struggle to identify delays, inefficiencies, and missed targets.
That is exactly why the Radiology & Imaging KPI Dashboard in Power BI is a must-have performance management solution for hospitals, diagnostic centers, and healthcare administrators.
This ready-to-use Power BI dashboard transforms raw radiology data into clear KPIs, interactive visuals, and actionable insights. Instead of reacting to problems after they occur, teams gain real-time visibility into operational, financial, and quality performance—all in one structured dashboard.
🔑 Key Features of Radiology & Imaging KPI Dashboard in Power BI
🚀 Centralized KPI Monitoring
Track all radiology and imaging KPIs in a single, executive-ready dashboard.
📅 MTD & YTD Performance Analysis
Monitor Month-to-Date and Year-to-Date actuals against targets and historical benchmarks.
🎯 Target vs Actual Comparison
Instantly identify KPI gaps using visual indicators and calculated ratios.
📊 Previous Year Performance Comparison
Analyze Current Year vs Previous Year trends to measure improvement or decline.
🧩 Interactive Slicers
Filter results by Month and KPI Group for focused analysis.
🧠 Clear Performance Indicators
Green and red status icons make KPI interpretation quick and intuitive.
📁 Excel-Based Data Input
Update actuals and targets easily without modifying Power BI formulas.
👨⚕️ Healthcare-Focused KPI Structure
Designed specifically for radiology and diagnostic imaging operations.
📦 What’s Inside the Radiology & Imaging KPI Dashboard in Power BI
This digital product includes a professionally designed Power BI report connected to a structured Excel data source, along with three analytical pages:
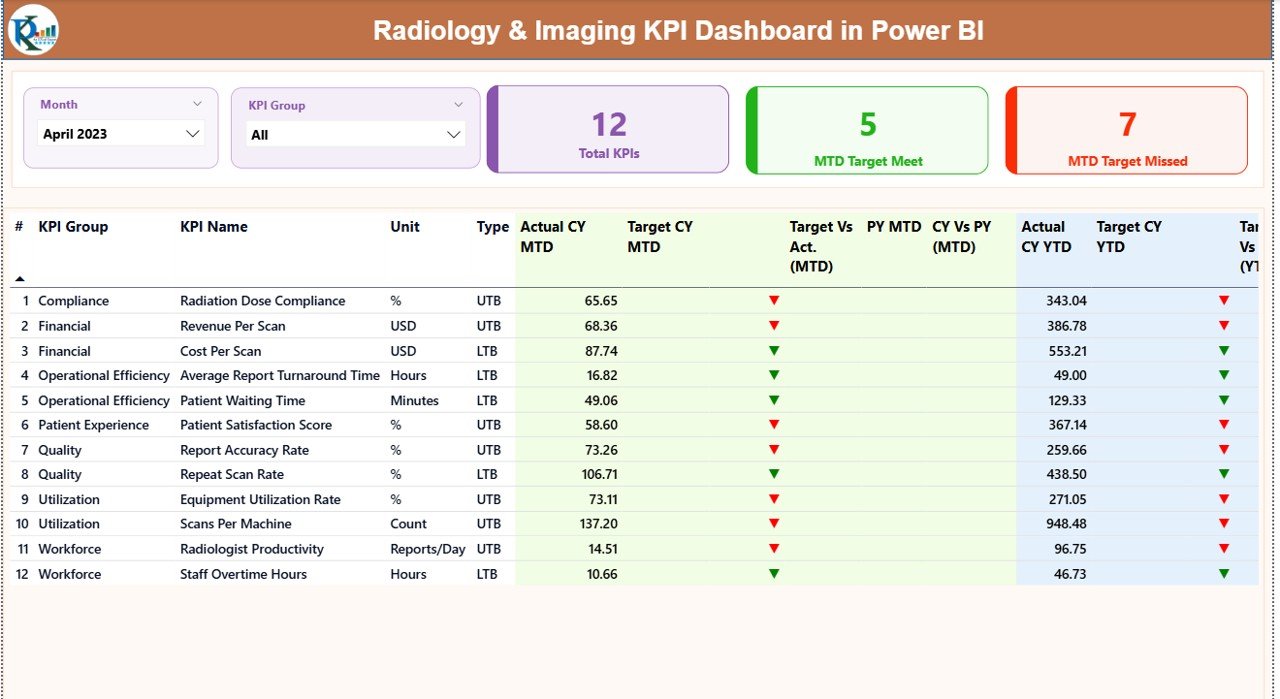
📌 Summary Page
Provides an instant overview of radiology performance with KPI cards, slicers, and a detailed KPI table showing MTD and YTD results, targets, and variances.
📈 KPI Trend Page
Displays MTD and YTD combo charts for selected KPIs, comparing current year actuals, previous year actuals, and targets over time.
📘 KPI Definition Page
Explains each KPI clearly with definitions, formulas, units, and KPI type (Lower-the-Better or Upper-the-Better), accessible via drill-through.
📊 Excel Input Sheets
-
Input_Actual: Enter MTD and YTD actual values
-
Input_Target: Maintain target values
-
KPI Definition: Define KPI structure and logic
⚙️ How to Use the Radiology & Imaging KPI Dashboard in Power BI
Using this dashboard is simple and user-friendly—even for non-technical users.
1️⃣ Enter actual performance data in the Excel input sheets
2️⃣ Update monthly and yearly targets in the target sheet
3️⃣ Refresh the Power BI file
4️⃣ Use slicers to filter by month or KPI group
5️⃣ Review KPI status, trends, and gaps instantly
Because calculations and visuals are pre-built, users focus on insights—not formulas.
👥 Who Can Benefit from This Radiology & Imaging KPI Dashboard
🏥 Hospital Administrators – Monitor departmental efficiency and service quality
🧪 Radiology Department Heads – Track workload, turnaround times, and KPI performance
📊 Healthcare Analysts – Analyze trends and performance gaps visually
👨⚕️ Diagnostic Imaging Centers – Improve accountability and operational control
📈 Healthcare Executives – Support data-driven strategic decisions
Click here to read the Detailed blog post
Watch the step-by-step video tutorial:


Reviews
There are no reviews yet.