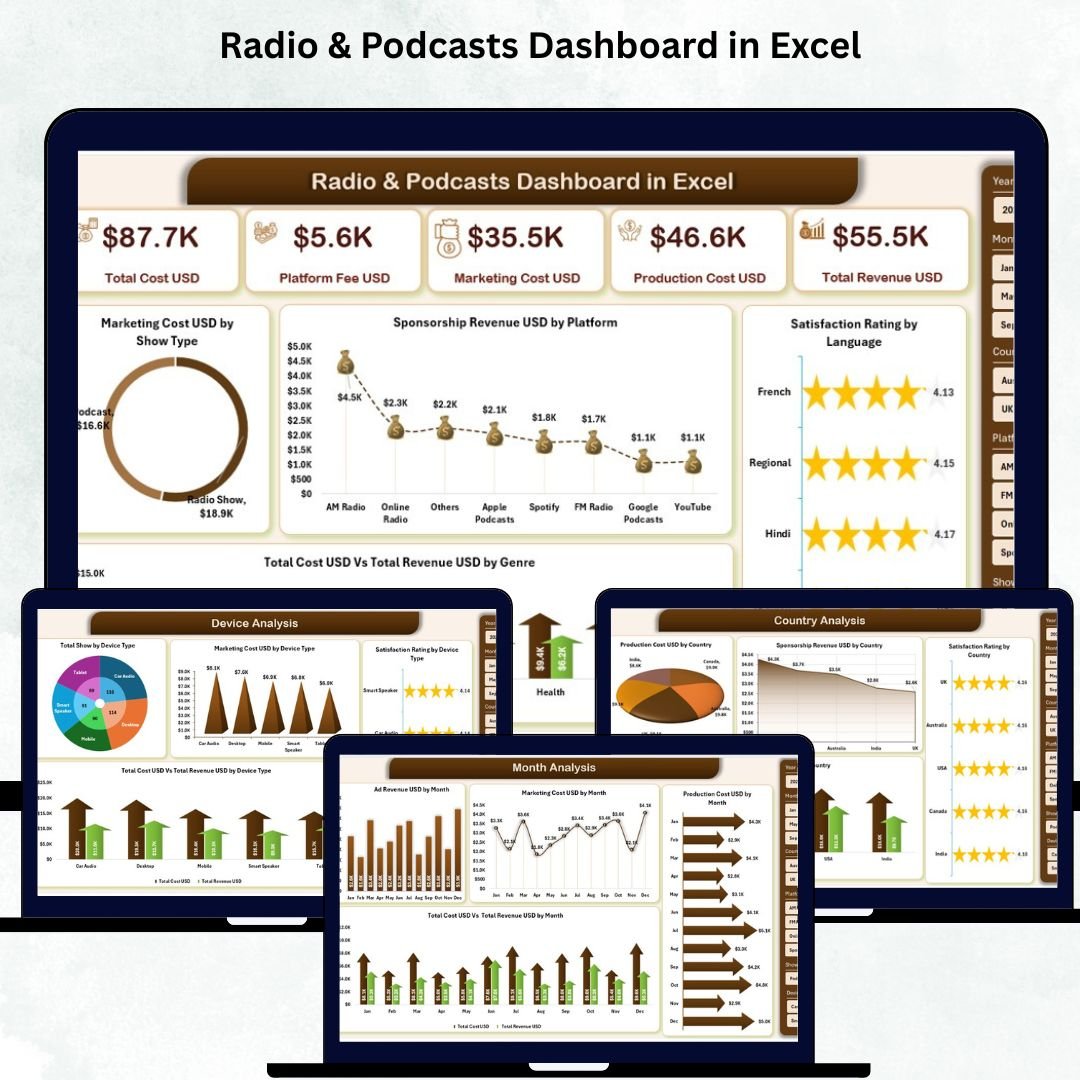
The radio and podcast world is growing faster than ever—millions of listeners tune in across platforms like Spotify, YouTube, Apple Podcasts, FM Radio, and more. But with so many shows, countries, devices, platforms, and cost factors involved, managing performance becomes difficult. That’s where the Radio & Podcasts Dashboard in Excel becomes your all-in-one performance powerhouse. 🎙️📊
This ready-to-use Excel dashboard helps you track everything that matters—Marketing Cost, Production Cost, Sponsorship Revenue, Genre Performance, Audience Satisfaction, Platform Analysis, Monthly Trends, and Device Usage. All insights appear in clean visuals, interactive slicers, and easy-to-navigate pages, allowing you to monitor your radio and podcast business in minutes, not hours.
Whether you are a content creator, podcast network, FM station, media agency, or influencer team, this dashboard gives you full control over your content performance and financial health.
🔑 Key Features of Radio & Podcasts Dashboard in Excel
This dashboard is designed to simplify analytics and reduce your workload instantly. Here’s what makes it powerful:
📍 Page Navigator for Smooth Navigation
Switch between any of the five analytical pages with a single click. No scrolling, no searching—everything stays organized.
🎛️ Smart Right-Side Slicers
Filter your entire dashboard by:
-
Month
-
Country
-
Platform
-
Device Type
-
Show Type
-
Genre
Just one click updates all charts—making your analysis simple, fast, and personalized.
📈 Instant KPI Cards
View your most important KPIs at a glance, including:
-
Total Revenue
-
Total Cost
-
Profit/Margin
-
Listener Satisfaction
-
Total Shows
These cards give immediate clarity for decision-making.
📊 Four Insightful Charts per Page
Every page includes four powerful visuals designed to explain performance, trends, and audience behavior with zero confusion.
📂 Dedicated Data Sheet
All data goes into one neatly structured sheet. When you update the raw data, the entire dashboard updates automatically.
📦 What’s Inside the Radio & Podcasts Dashboard in Excel
The dashboard includes five meaningful analytical pages, each showing a different view of your performance.
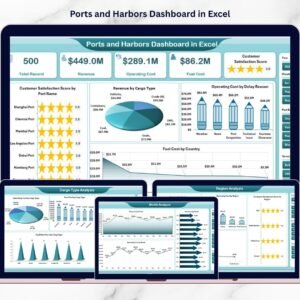
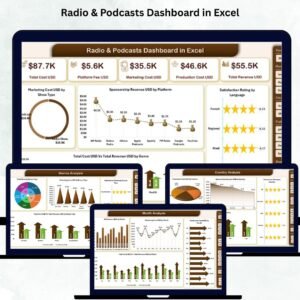
1️⃣ Overview Page – Your Main Control Center
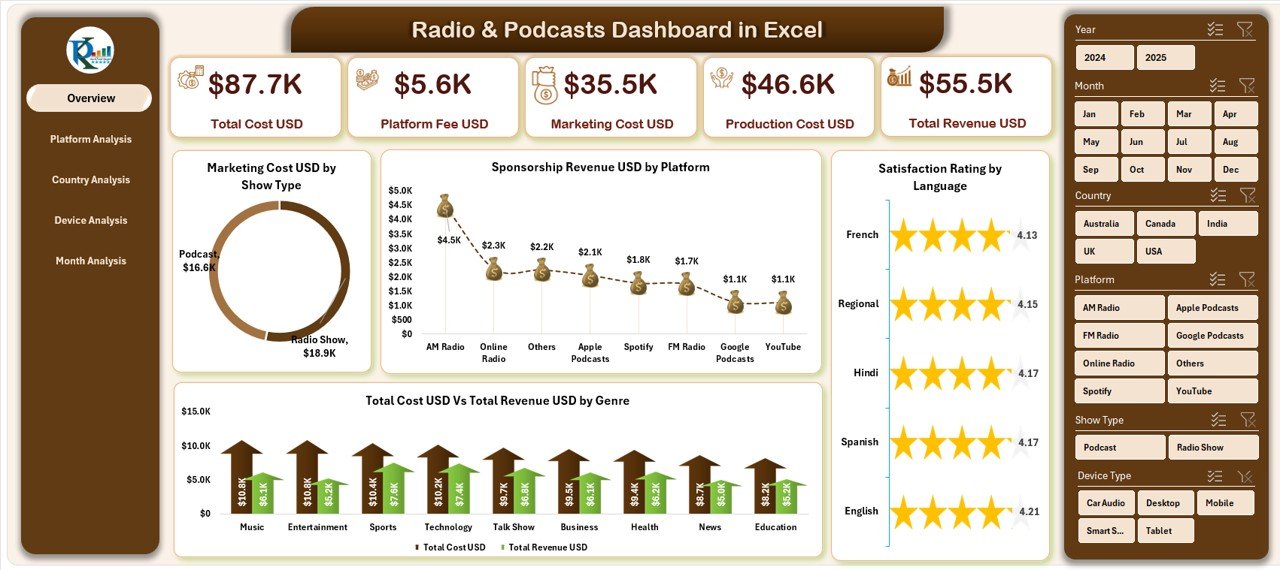
This page gives a summary of everything:
-
Slicers for filtering
-
Five KPI cards
-
Four key charts:
-
Marketing Cost USD by Show Type
-
Sponsorship Revenue USD by Platform
-
Satisfaction Rating
-
Total Cost vs Revenue by Genre
-
It is the perfect page for review meetings and weekly performance tracking.
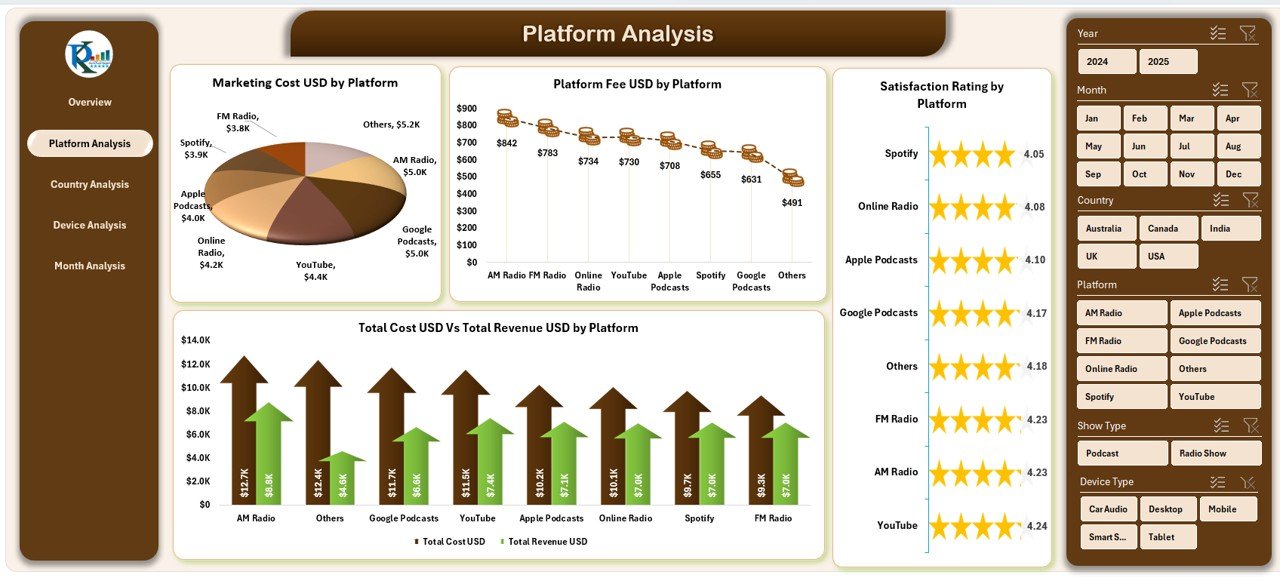
2️⃣ Platform Analysis Page – Compare Platform-Wise Success
See exactly which platform performs best in revenue, satisfaction, and cost.
Charts include:
-
Marketing Cost by Platform
-
Platform Fee
-
Satisfaction Rating
-
Cost vs Revenue by Platform
Ideal for choosing your most profitable distribution channels.
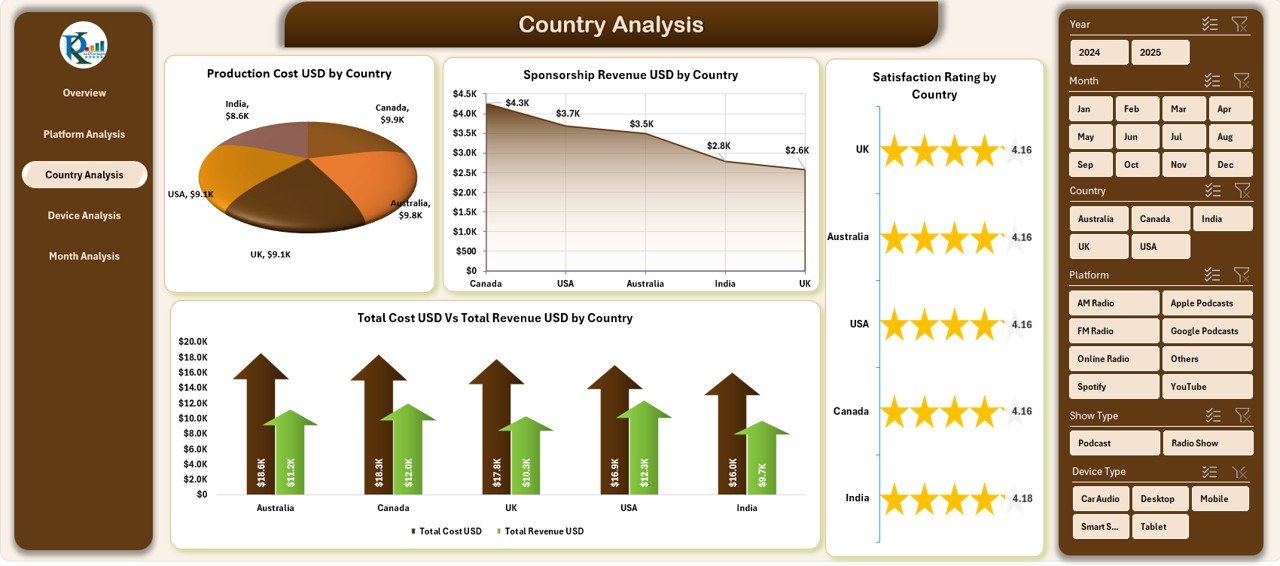
3️⃣ Country Analysis Page – Understand Regional Performance
Your global audience behaves differently—this page explains everything:
-
Production Cost by Country
-
Sponsorship Revenue by Country
-
Satisfaction Rating by Country
-
Cost vs Revenue by Country
Perfect for expansion planning and country-targeted marketing.
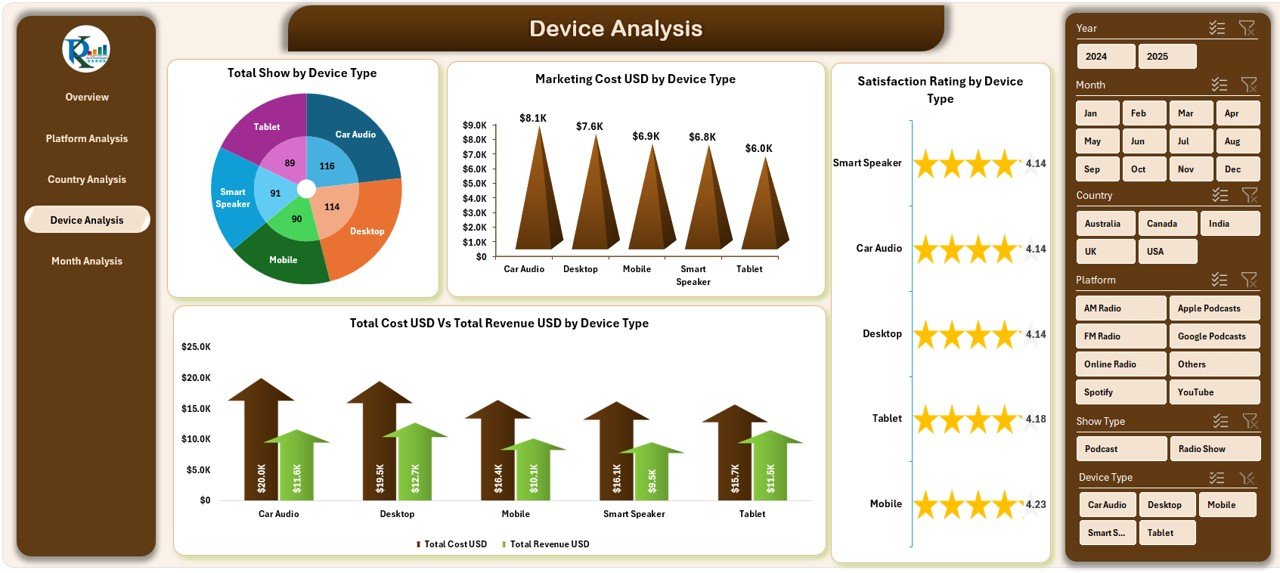
4️⃣ Device Analysis Page – Know Your Listeners Better
Track how audiences consume your content using:
-
Total Shows by Device Type
-
Marketing Cost by Device
-
Satisfaction Rating by Device
-
Cost vs Revenue by Device
Great for optimizing content format and targeting specific devices.
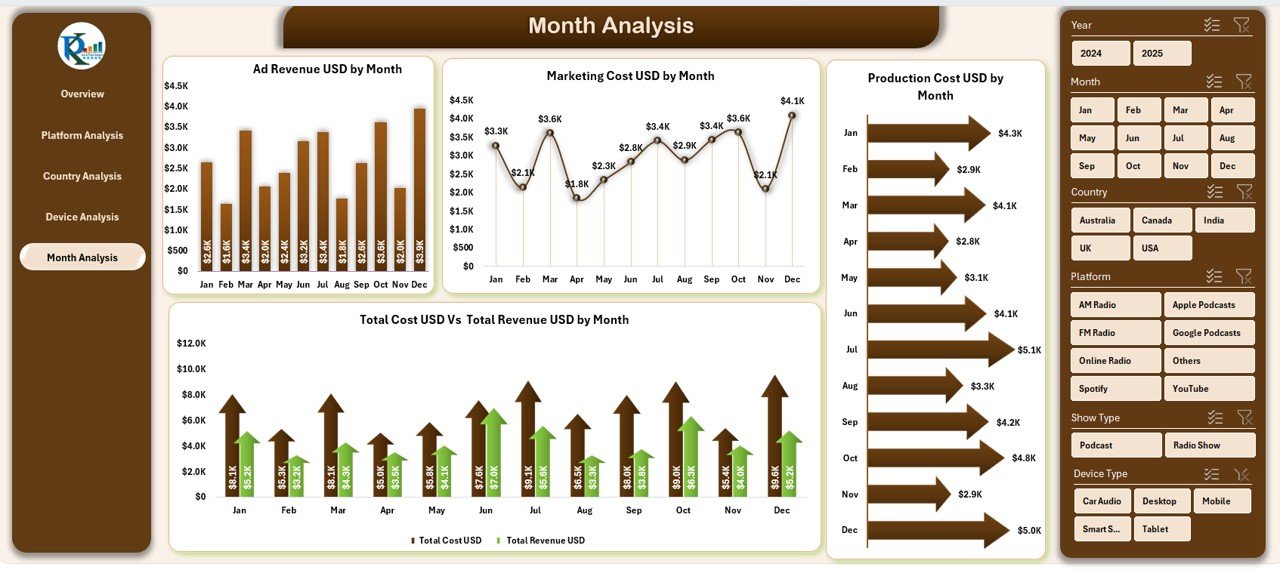
5️⃣ Month Analysis Page – Track Monthly Trends Clearly
Understand month-wise performance using:
-
Ad Revenue by Month
-
Marketing Cost by Month
-
Production Cost by Month
-
Total Cost vs Revenue by Month
This page helps teams plan budgets, campaigns, and future content strategies.
🧠 How to Use the Radio & Podcasts Dashboard in Excel
Using the dashboard is extremely simple:
-
Update your raw data in the Data Sheet
-
Refresh the dashboard
-
Use slicers to filter the visuals
-
Navigate between analysis pages for deeper insights
-
Review KPIs daily and monthly
-
Make data-driven decisions using cost, revenue & satisfaction trends
No formulas. No coding. No technical skills needed. ⚡
👥 Who Can Benefit from This Dashboard?
This dashboard is perfect for:
-
🎙️ Podcasters
-
📻 Radio Stations
-
📺 Media Production Houses
-
📢 Marketing Agencies
-
🌎 Global Content Creators
-
🎧 Streaming Platform Teams
-
💼 Content Managers & Strategists
Anyone managing shows, audiences, and revenue streams can benefit instantly.
### Click here to read the Detailed blog post
Visit our YouTube channel to learn step-by-step video tutorials
👉 Youtube.com/@PKAnExcelExpert


Reviews
There are no reviews yet.