Public broadcasting organizations operate in a complex environment where they must balance content quality, financial sustainability, and operational efficiency. These organizations produce educational, cultural, informational, and entertainment programs while managing production costs, advertising revenue, and audience reach across multiple channels and regions.
However, many broadcasting organizations still rely on disconnected spreadsheets, manual reports, and fragmented data systems to track operational performance. As a result, managers often struggle to evaluate program performance, monitor advertising sales, and analyze production costs effectively.
That is exactly where the Public Broadcasting Dashboard in Power BI becomes a powerful analytics and reporting solution.
This ready-to-use Power BI dashboard helps broadcasting organizations visualize operational and financial data through an interactive and centralized reporting interface. Instead of reviewing multiple reports, decision-makers can monitor program production, advertising revenue, ad slot sales, and operational performance from one dynamic dashboard.
Using Power BI’s advanced data visualization features, this dashboard converts complex broadcasting data into clear insights using KPI cards, charts, and analytical reports. Managers can analyze revenue distribution across channels, evaluate program performance by type, monitor advertising slot utilization, and understand regional broadcasting performance.
Whether you manage a public broadcasting network, television station, media organization, or advertising operations, this dashboard provides a structured platform to track and analyze broadcasting performance.
As a result, broadcasting organizations can make faster data-driven decisions, optimize advertising strategies, improve program planning, and enhance overall operational efficiency.
🚀 Key Feature of Public Broadcasting Dashboard in Power BI
📊 Centralized Broadcasting Analytics Dashboard
Monitor production costs, advertising revenue, program performance, and operational metrics from a single interactive dashboard.
📈 Powerful Data Visualization
Use KPI cards, interactive charts, and analytical reports to understand broadcasting performance quickly.
📅 Monthly Performance Monitoring
Track monthly trends in program production, revenue generation, and operational costs.
💰 Advertising Revenue Tracking
Analyze advertising slot sales performance and identify revenue opportunities.
📉 Unsold Ad Slot Analysis
Identify unsold advertising slots and optimize advertising strategies to increase revenue.
🌍 Regional Broadcasting Performance Analysis
Evaluate broadcasting performance across different geographic regions.
🗣 Language-Based Program Analysis
Analyze production costs, program volume, and advertising performance by language.
⚡ Interactive Filtering and Insights
Use interactive visuals to analyze broadcasting data from multiple perspectives.
📦 What’s Inside the Public Broadcasting Dashboard in Power BI
This Power BI dashboard includes five analytical pages, each designed to provide insights into different aspects of broadcasting operations.
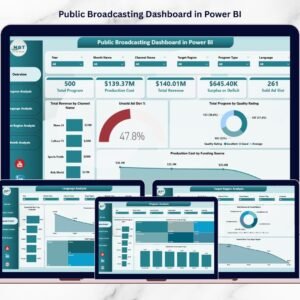
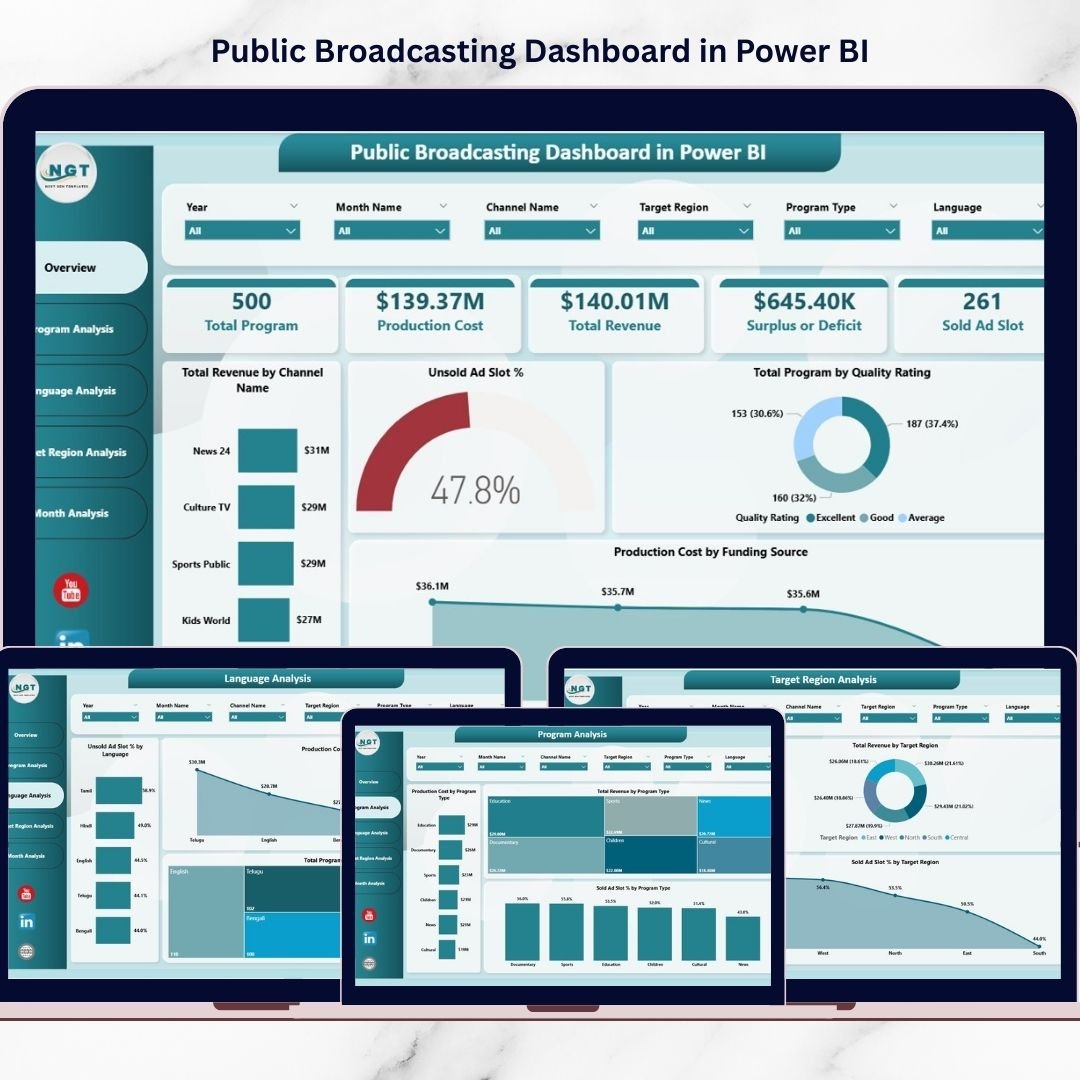
📍 Overview Page – Broadcasting Performance Summary
The Overview Page provides a high-level snapshot of broadcasting performance.
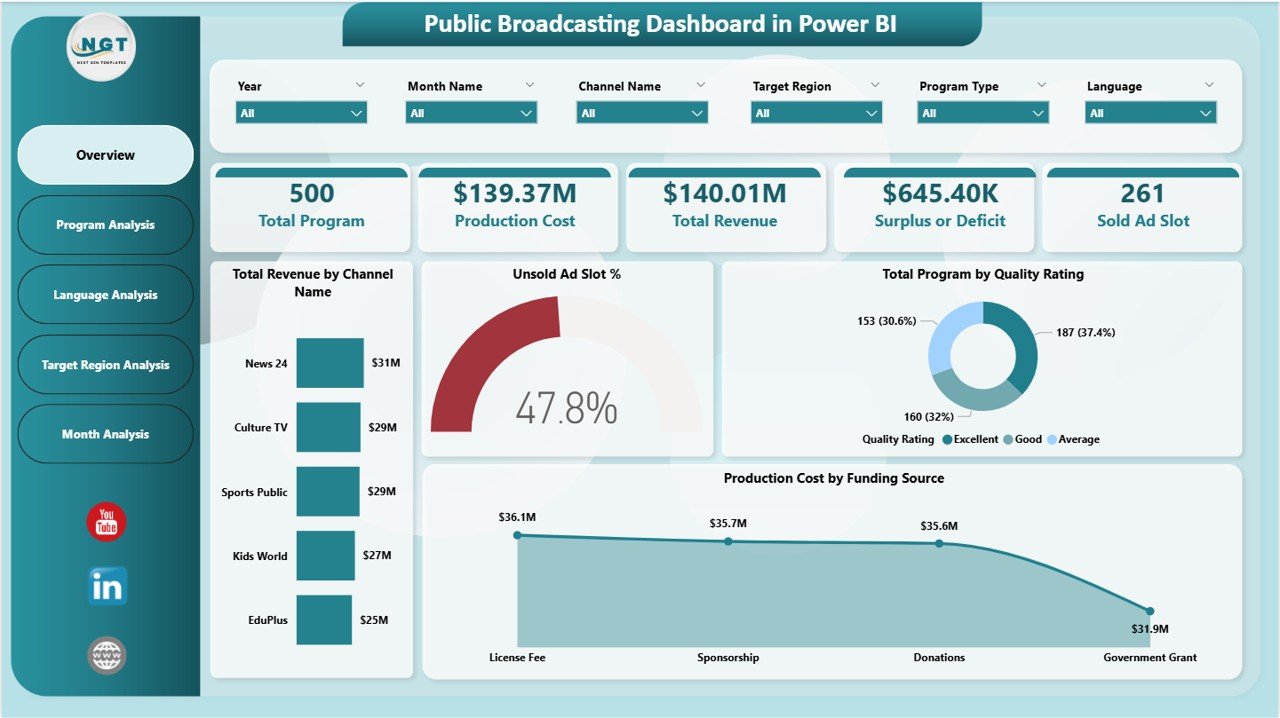
It includes five key KPI cards:
• Total Programs Produced
• Total Production Cost
• Total Advertising Revenue
• Surplus or Deficit
• Total Sold Advertising Slots
The page also includes analytical charts such as:
• Total Revenue by Channel
• Unsold Ad Slot Percentage
• Total Programs by Quality Rating
• Production Cost by Funding Source
This page allows managers to quickly evaluate overall operational and financial performance.
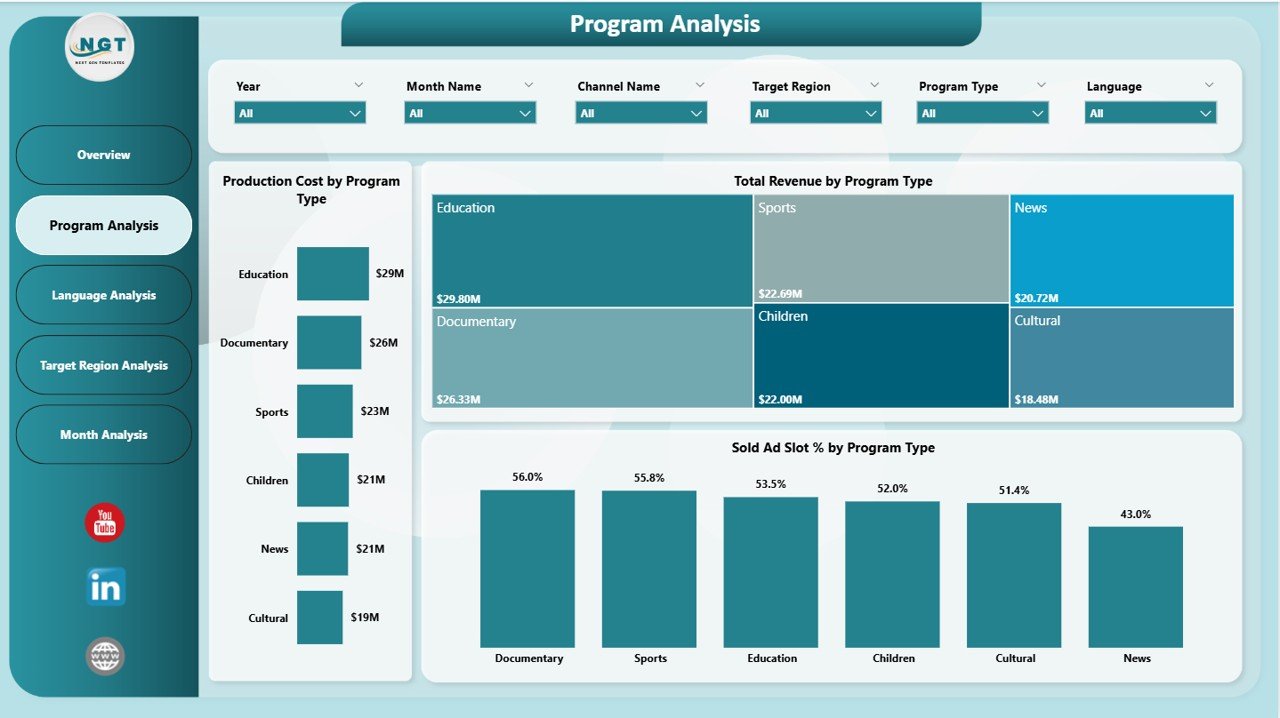
📍 Program Analysis Page – Program Performance Insights
The Program Analysis Page helps analyze the performance of different program categories.
Charts included:
• Production Cost by Program Type
• Total Revenue by Program Type
• Sold Ad Slot Percentage by Program Type
This page helps broadcasting organizations identify high-performing program categories and optimize content strategies.
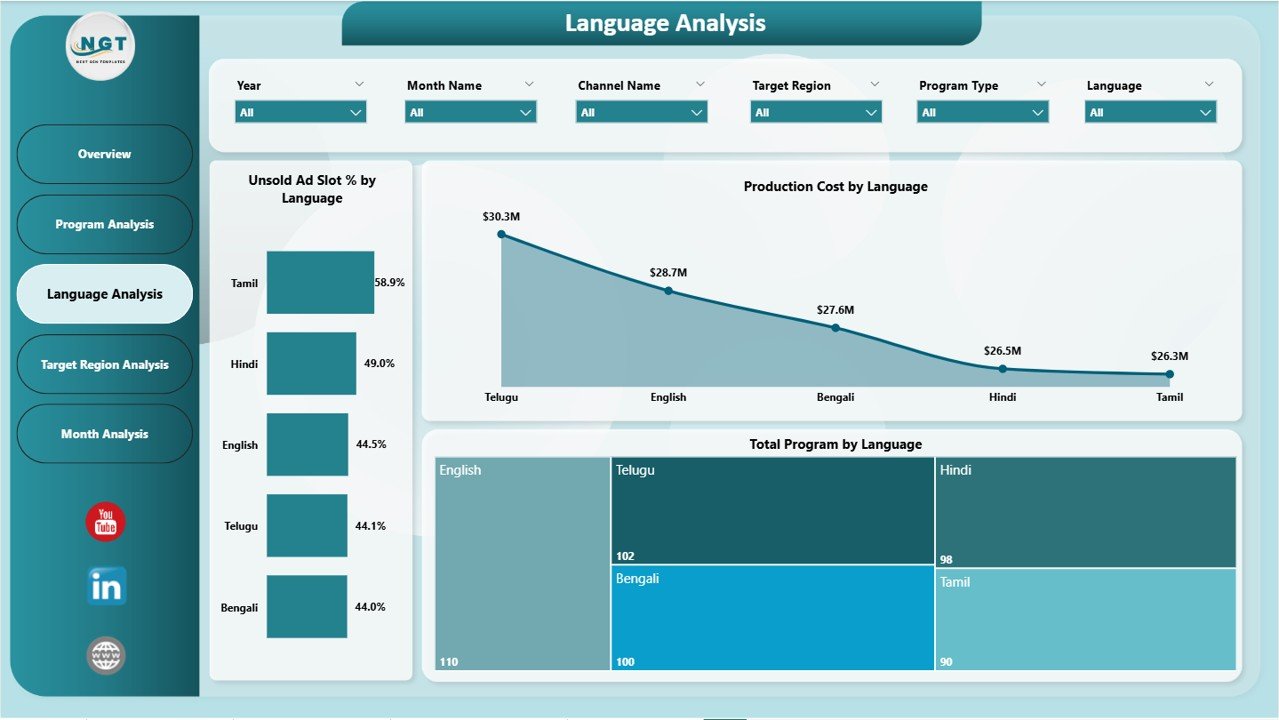
📍 Language Analysis Page – Multi-Language Broadcasting Performance
Many broadcasting organizations produce programs in multiple languages.
This page analyzes broadcasting performance based on language.
Charts included:
• Unsold Ad Slot Percentage by Language
• Production Cost by Language
• Total Programs by Language
Managers can identify which language segments generate better results.
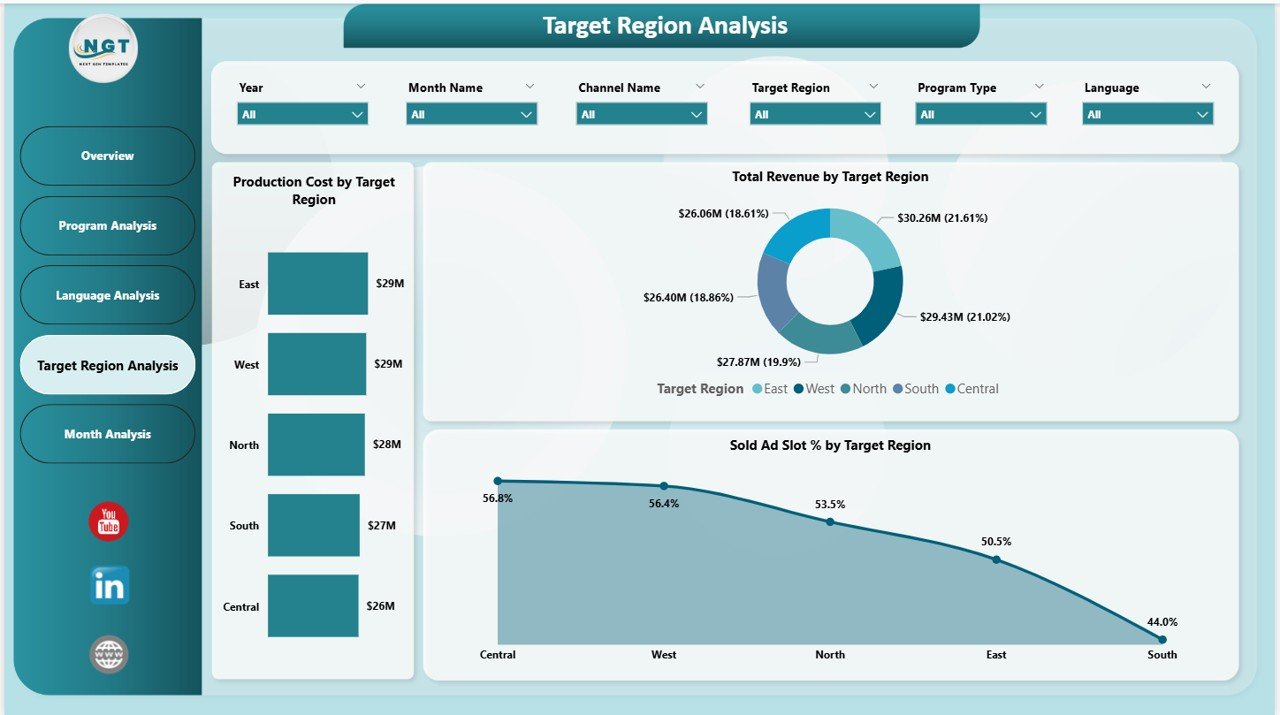
📍 Target Region Analysis Page – Regional Broadcasting Insights
This page analyzes broadcasting performance across geographic regions.
Charts included:
• Production Cost by Target Region
• Total Revenue by Target Region
• Sold Ad Slot Percentage by Target Region
This helps organizations evaluate regional audience engagement and revenue generation.
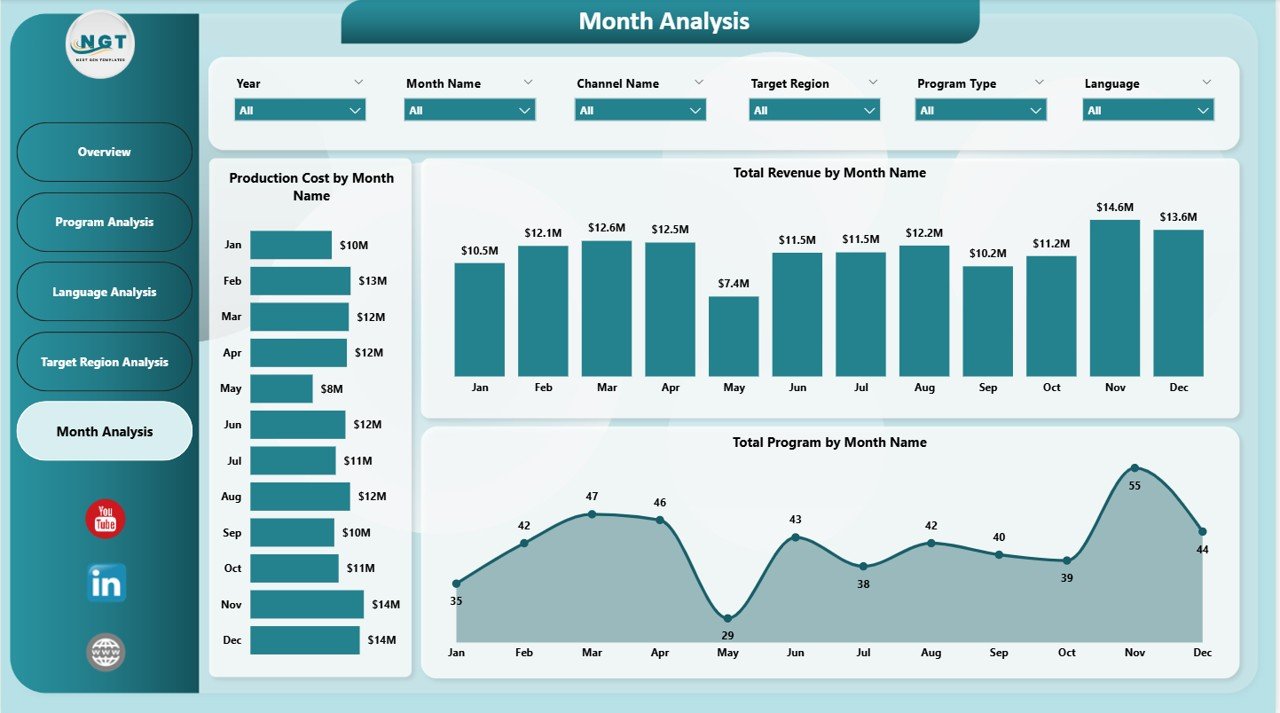
📍 Monthly Trends Page – Time-Based Broadcasting Analysis
The Monthly Trends Page analyzes broadcasting operations across months.
Charts included:
• Production Cost by Month
• Total Revenue by Month
• Total Programs Produced by Month
This page helps identify seasonal patterns and plan future programming schedules.
🛠 How to Use the Public Broadcasting Dashboard in Power BI
Using this dashboard is simple and effective.
Step 1 – Connect Data Sources
Import broadcasting operational and financial data into Power BI.
Step 2 – Refresh the Dashboard
Update the dashboard to load the latest data.
Step 3 – Analyze KPI Cards
Review high-level performance indicators on the Overview page.
Step 4 – Explore Analytical Pages
Analyze program performance, language insights, and regional metrics.
Step 5 – Use Insights for Decision Making
Use dashboard insights to improve advertising strategies, optimize programming, and manage production budgets.
👥 Who Can Benefit from This Public Broadcasting Dashboard in Power BI
This dashboard is ideal for professionals working in broadcasting and media management.
📺 Public Broadcasting Organizations – Monitor operational and financial performance.
📊 Media Companies and TV Networks – Track program performance and advertising revenue.
📈 Broadcasting Managers – Analyze program production, ad slot sales, and operational efficiency.
📢 Advertising Sales Teams – Monitor ad slot sales performance and revenue generation.
📋 Media Analysts – Evaluate broadcasting data and identify strategic insights.
🏢 Government Broadcasting Agencies – Track public broadcasting performance and funding utilization.
Click hare to read the Detailed blog post
Visit our YouTube channel to learn step-by-step video tutorials
https://www.youtube.com/@PKAnExcelExpert