
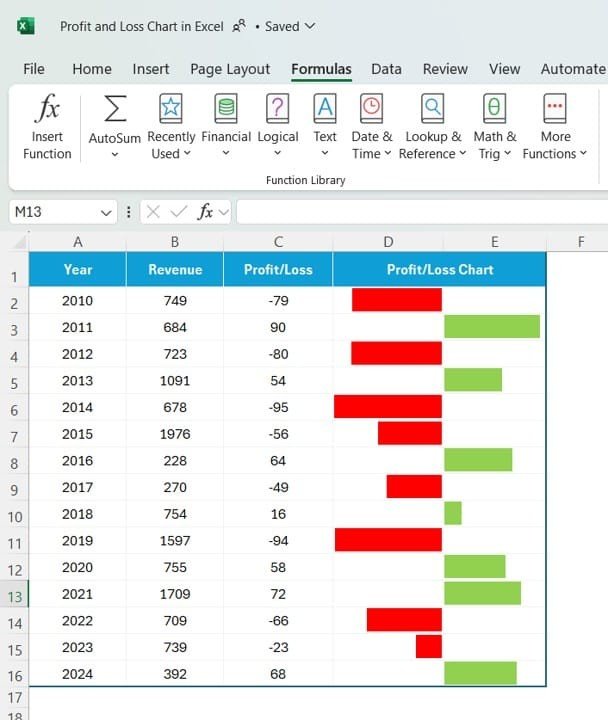
The Profit and Loss Chart in Excel with Examples is a powerful and visually engaging tool designed to help businesses track their financial performance in real-time. Whether you’re a small business owner, an accountant, or a financial analyst, this chart provides a clear, intuitive representation of your profit and loss (P&L) data.
This customizable Excel template allows you to visualize income, expenses, and overall profitability, making it easier to analyze your business’s financial health. With built-in examples, simple data entry, and dynamic charts, this tool helps streamline financial reporting and decision-making.
Key Features of the Profit and Loss Chart in Excel:
📊 Comprehensive Financial Tracking
Track your income, expenses, and overall profit and loss over any period. Visualize your financial data with easily interpretable charts and graphs.
📈 Dynamic Charts and Graphs
Use colorful and interactive charts to visually represent your P&L data, including bar charts, line graphs, and pie charts for different financial categories.
📅 Month-to-Date (MTD) and Year-to-Date (YTD) Analysis
Track your financial performance across different time periods, whether you need to analyze monthly or yearly trends in income and expenses.
🎯 Customizable for Your Business Needs
Easily adjust the template to suit your business model, whether you are tracking sales, expenses, or profitability in various departments.
🛠 Built-in Examples and Pre-Designed Layouts
The template comes with example data and pre-designed sections, making it easy for you to get started right away without any complex setup.
🔔 Instant Updates and Real-Time Reporting
As you input your financial data, the P&L chart will automatically update, providing you with real-time insights into your business’s financial health.
💼 Professional Financial Reporting
Generate professional and clean financial reports for presentations, meetings, or tax filing, with all your P&L data visualized in easy-to-read charts.
🚀 Why You’ll Love the Profit and Loss Chart in Excel with Examples:
✅ Track Profitability – Easily monitor your business’s profits and losses across different periods to make better financial decisions.
✅ Simplify Financial Analysis – The easy-to-understand graphs and charts provide instant insights into your income, expenses, and profitability.
✅ Customizable for Any Industry – Whether you’re in retail, service, or manufacturing, tailor the chart to fit your business’s financial structure and reporting needs.
✅ Generate Professional Reports – Present your P&L data in an engaging and professional format to stakeholders, clients, or for internal reviews.
✅ Quick Setup – The template comes with example data, so you can quickly get started without complicated setup processes.
What’s Inside the Profit and Loss Chart in Excel with Examples:
- Income Tracking: Monitor income from all revenue streams, including sales, services, and other business activities.
- Expense Tracking: Track fixed and variable expenses such as payroll, rent, utilities, marketing, and materials.
- Profit and Loss Calculation: Automatically calculate your net profit or loss based on income and expenses, providing you with real-time profitability insights.
- Month-to-Date and Year-to-Date Comparison: Track and compare your P&L data on a monthly and yearly basis to see growth trends and identify areas for improvement.
- Category Breakdown: Break down income and expenses by categories to easily analyze which areas of your business are performing well and which need attention.
How to Use the Profit and Loss Chart in Excel:
1️⃣ Download the Template – Instantly access your Excel file upon purchase.
2️⃣ Input Your Data – Enter your income and expense data into the pre-designed fields.
3️⃣ Customize for Your Business – Adjust categories, names, and values to fit your specific business structure.
4️⃣ Track Performance – Monitor your profits and losses in real-time with dynamic charts that automatically update as you enter new data.
5️⃣ Generate Reports – Use the P&L data to generate reports for tax purposes, management reviews, or stakeholder meetings.
Who Can Benefit from the Profit and Loss Chart in Excel:
- Small Business Owners
- Accountants
- Financial Analysts
- CFOs
- Entrepreneurs
- Startup Founders
- Tax Professionals
- Business Consultants
The Profit and Loss Chart in Excel with Examples is the perfect tool for anyone looking to monitor and manage their financial performance with ease and clarity.
Click here to read the Detailed blog post
https://www.pk-anexcelexpert.com/profit-and-loss-chart-in-excel-with-examples/
Visit our YouTube channel to learn step-by-step video tutorials
Youtube.com/@PKAnExcelExpert


Reviews
There are no reviews yet.