In today’s fast-paced business environment, organizations know that continuous learning is the key to success. But how do you measure whether your professional training or coaching programs are actually improving performance?
That’s exactly where the Professional Training & Coaching KPI Dashboard in Excel comes in 🎯
This ready-to-use Excel dashboard empowers training managers, HR professionals, and learning consultants to track, analyze, and visualize critical KPIs — all in one interactive, easy-to-use interface. Whether you’re monitoring completion rates, participant feedback, or cost per trainee, this dashboard gives you the insights you need to improve outcomes and demonstrate ROI with confidence.
💡 Key Features of the Professional Training & Coaching KPI Dashboard in Excel
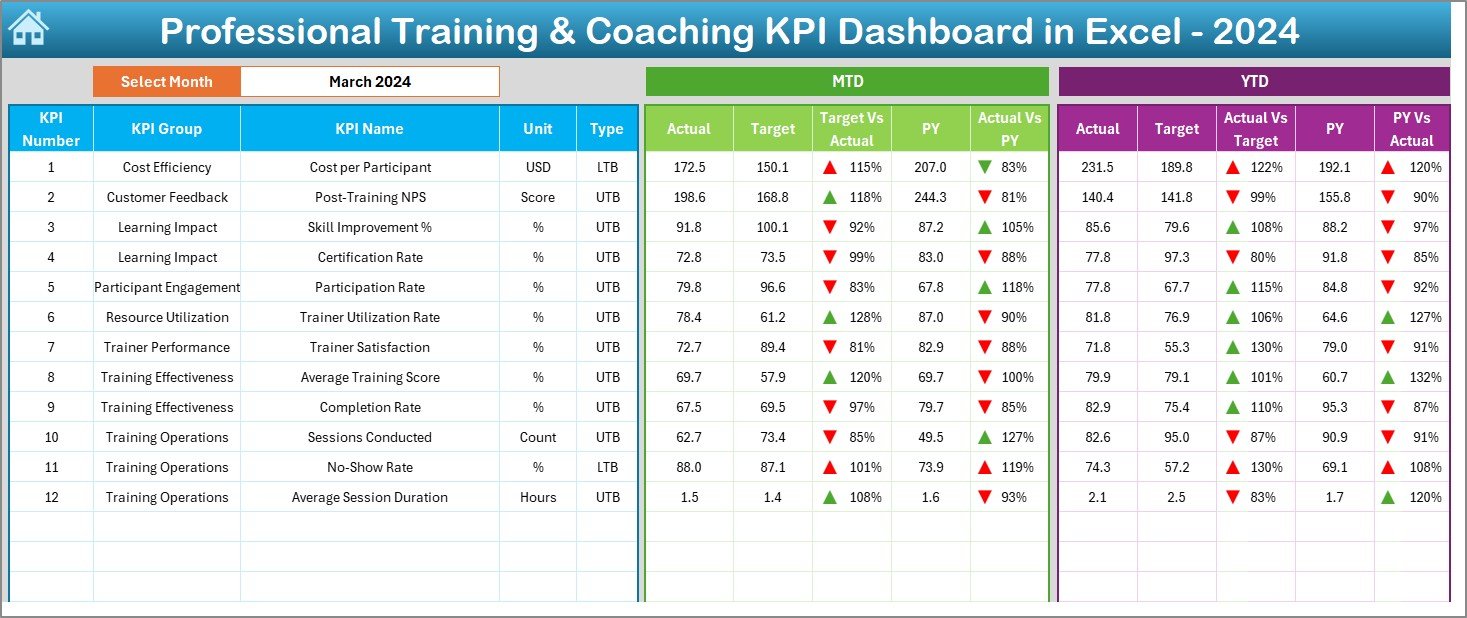
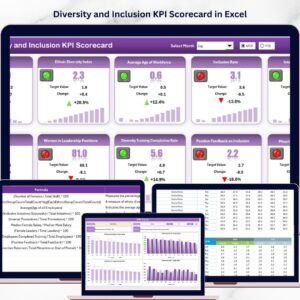
✅ Interactive Dashboard Interface: Select any month from a drop-down list, and the entire dashboard updates instantly with Month-to-Date (MTD) and Year-to-Date (YTD) results.
✅ Comprehensive KPI Analysis: View Actual vs. Target and Previous Year comparisons with automatic variance calculations and visual indicators.
✅ Conditional Formatting & Arrows: Instantly identify performance trends with intuitive green (up) and red (down) arrows showing progress or decline.
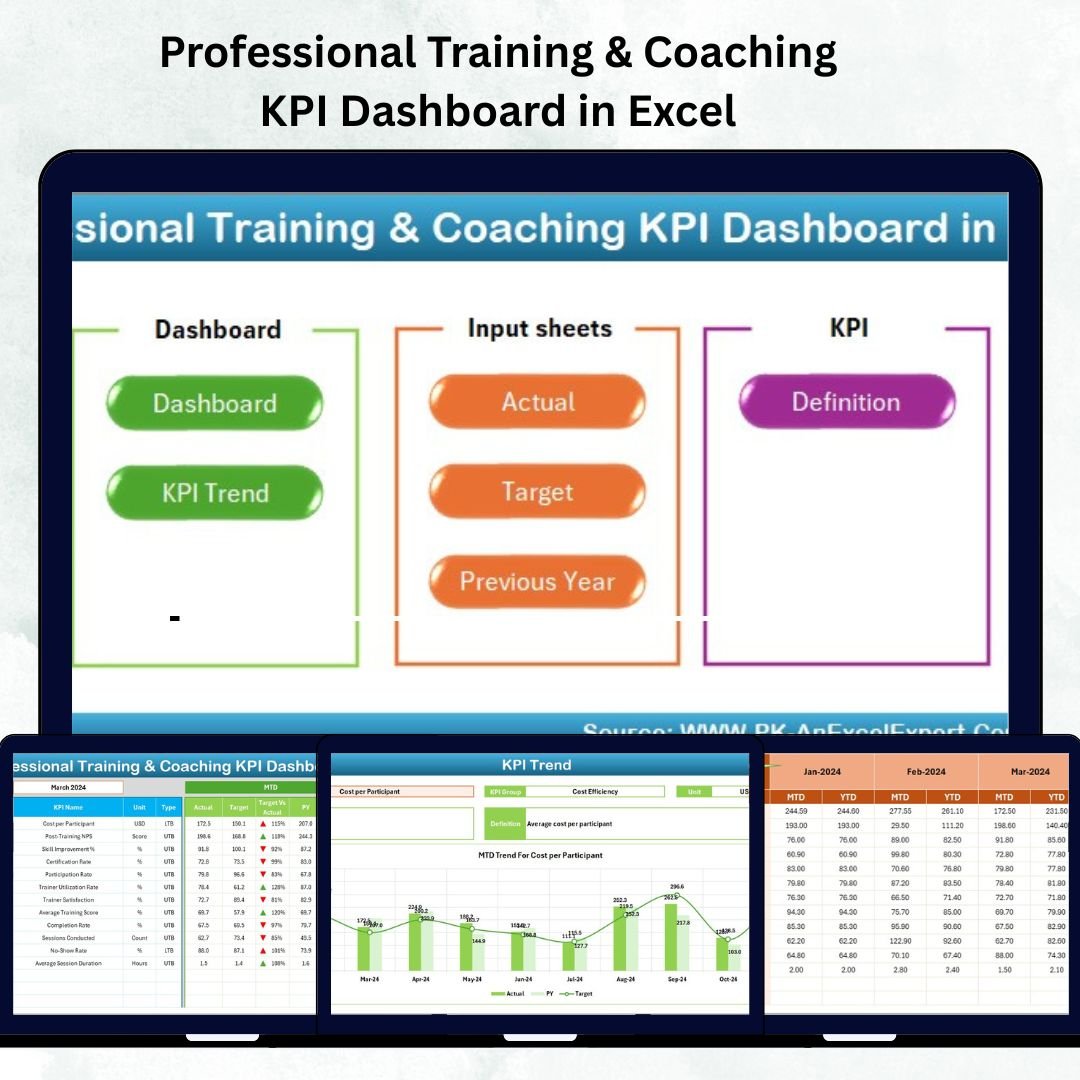
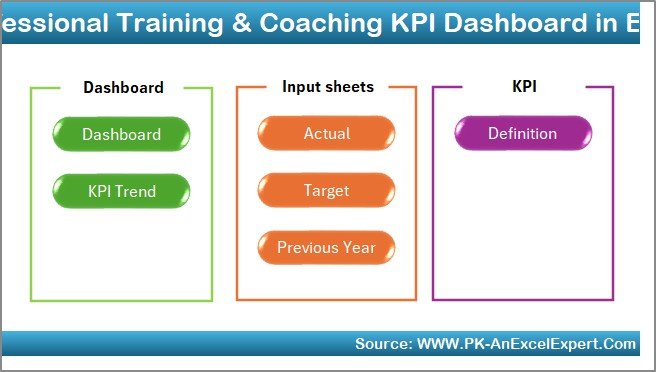
✅ Seven Organized Sheets: Includes dedicated tabs for Dashboard, KPI Trends, Actuals, Targets, Previous Year Data, KPI Definitions, and Home Navigation.
✅ One-Click Navigation: The Home sheet comes with quick-access buttons to jump to each section — no scrolling or searching required.
✅ Data Accuracy & Automation: Built-in Excel formulas and data validation ensure consistency and eliminate manual reporting errors.
✅ Completely Customizable: Modify KPIs, categories, or visuals to match your organization’s structure and performance metrics.
✅ No Coding Needed: 100% Excel-based — perfect for non-technical users who want powerful analysis without complex setup.
📦 What’s Inside the Professional Training & Coaching KPI Dashboard in Excel
When you download this dashboard, you’ll get:
📊 Dashboard Sheet: The main analytics page showcasing MTD and YTD KPI comparisons with charts, arrows, and performance cards.
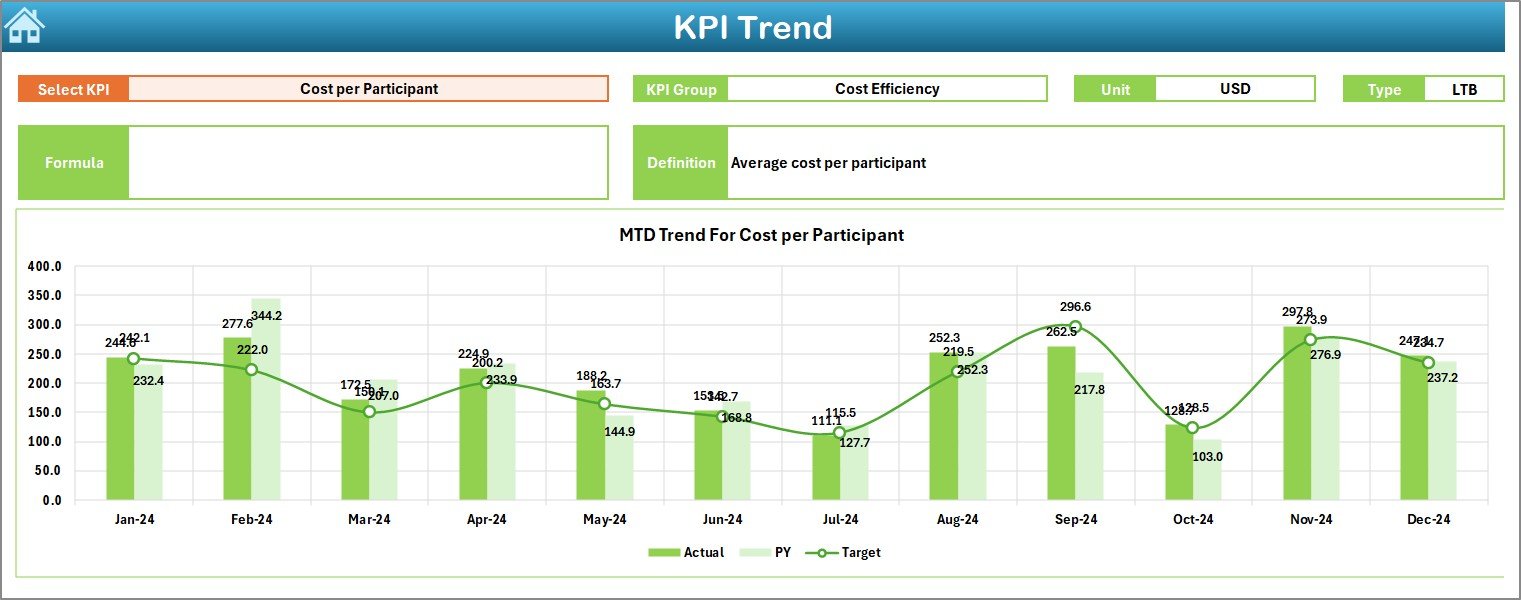
📈 KPI Trend Sheet: A dynamic sheet to analyze the progress of individual KPIs over time. Simply pick a KPI name from a drop-down and view performance trends instantly.
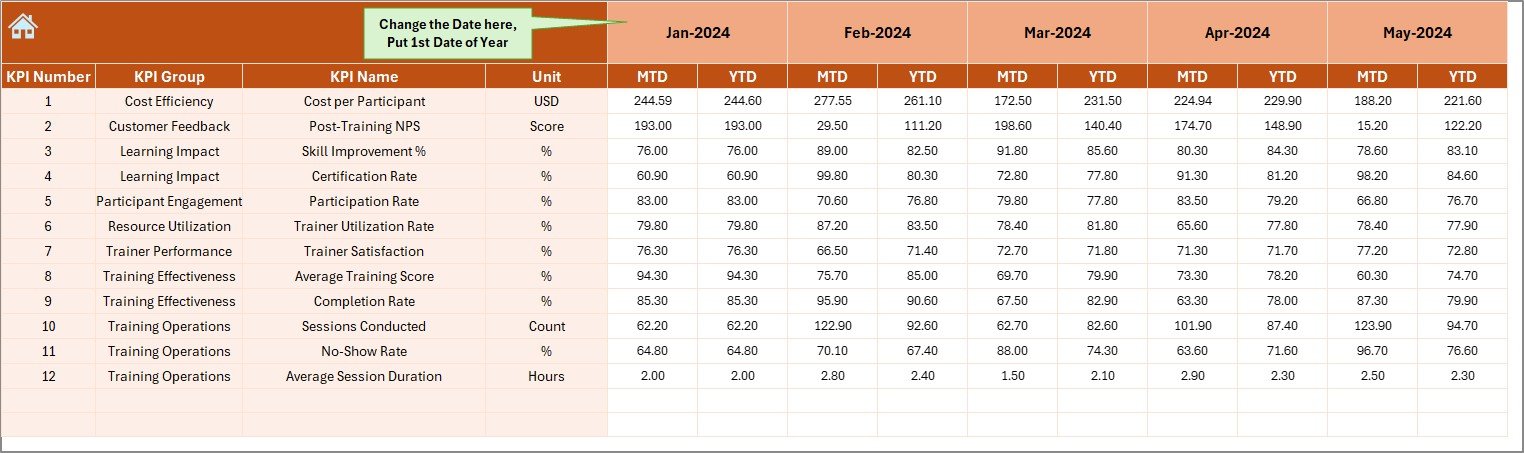
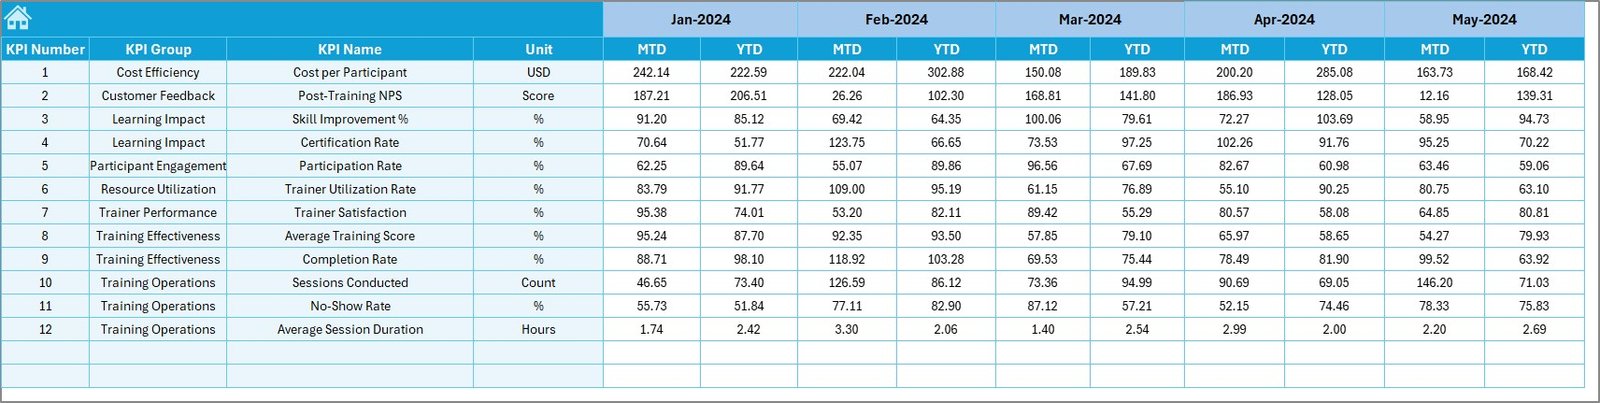
🧾 Actual Numbers Sheet: Input monthly MTD and YTD actuals — the dashboard will automatically pull and visualize the data.
🎯 Target Sheet: Define your monthly and yearly goals for each KPI to track variance against performance.
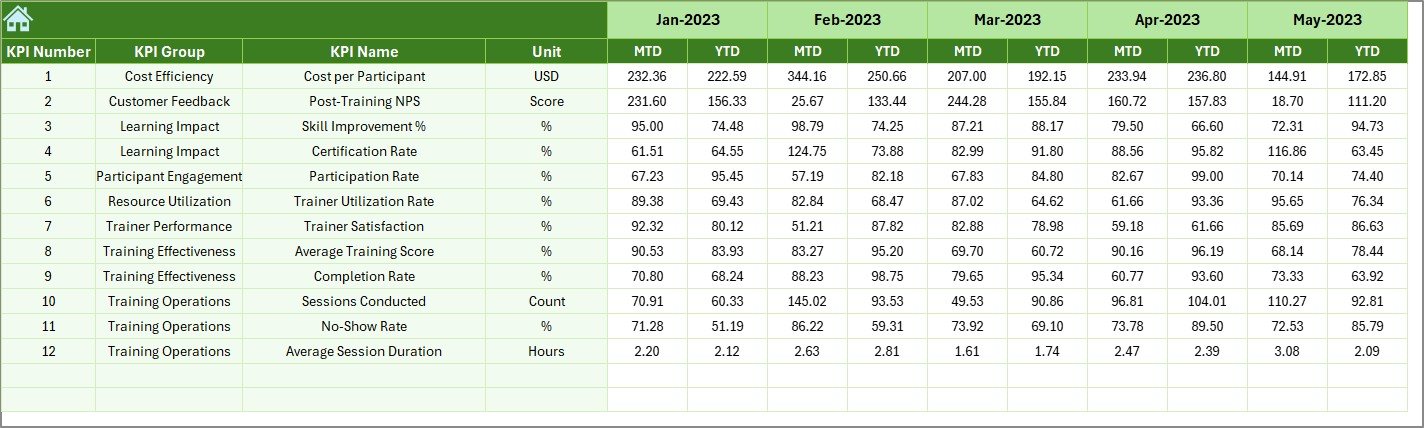
📉 Previous Year Sheet: Store historical data for side-by-side comparison and trend analysis.
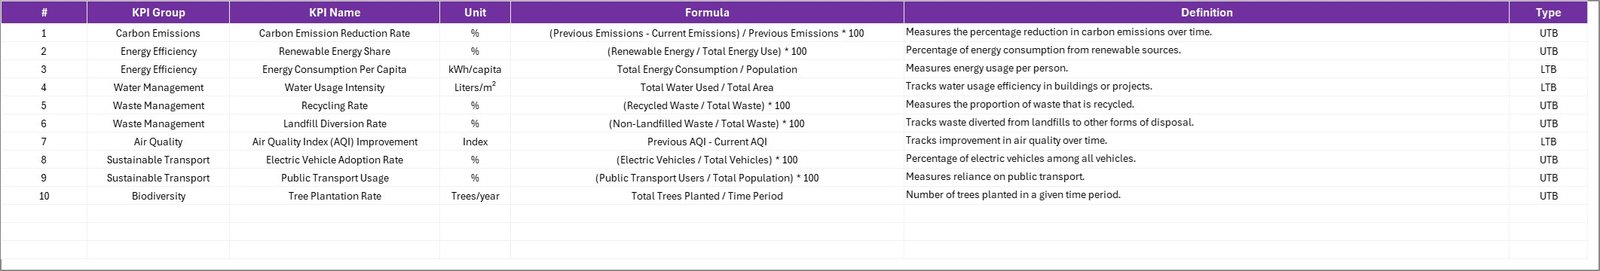
📘 KPI Definition Sheet: A clear reference of all KPIs — including name, unit, formula, and type (UTB/LTB) — for easy understanding.
🏠 Home Sheet: A clean, user-friendly index page with navigation buttons to access all key sections effortlessly.
⚙️ How to Use the Professional Training & Coaching KPI Dashboard in Excel
1️⃣ Input Data: Enter actuals, targets, and previous year values in their respective sheets.
2️⃣ Select Month: Choose a month from the drop-down in cell D3 — the entire dashboard refreshes automatically.
3️⃣ Analyze Trends: Visit the KPI Trend tab to examine each KPI’s month-over-month performance.
4️⃣ Review Insights: The main Dashboard tab highlights KPIs performing above or below target.
5️⃣ Present Results: Use the dashboard visuals for management reports, HR reviews, or performance presentations.
No complex setup or coding required — just plug in your data and start analyzing instantly ⚡
🎯 Who Can Benefit from This Professional Training & Coaching KPI Dashboard in Excel
👩💼 HR Managers & L&D Leaders: Monitor employee training performance, participation, and satisfaction.
🧑🏫 Corporate Trainers & Coaches: Track training completion rates, feedback scores, and ROI metrics.
🏢 Business Owners & Department Heads: Identify skill gaps, optimize training budgets, and align learning programs with strategic goals.
📊 Consultants & Analysts: Provide professional reporting and analytics services for clients in training and development sectors.
This dashboard is a must-have tool for anyone looking to measure learning effectiveness and drive continuous improvement through data-driven decisions.


Reviews
There are no reviews yet.