🎓 Professional training and coaching are essential for developing talent and driving organizational success. But without structured monitoring, training programs can become costly, ineffective, and hard to measure.
That’s why the Professional Training & Coaching Dashboard in Excel 🚀 is the perfect solution.
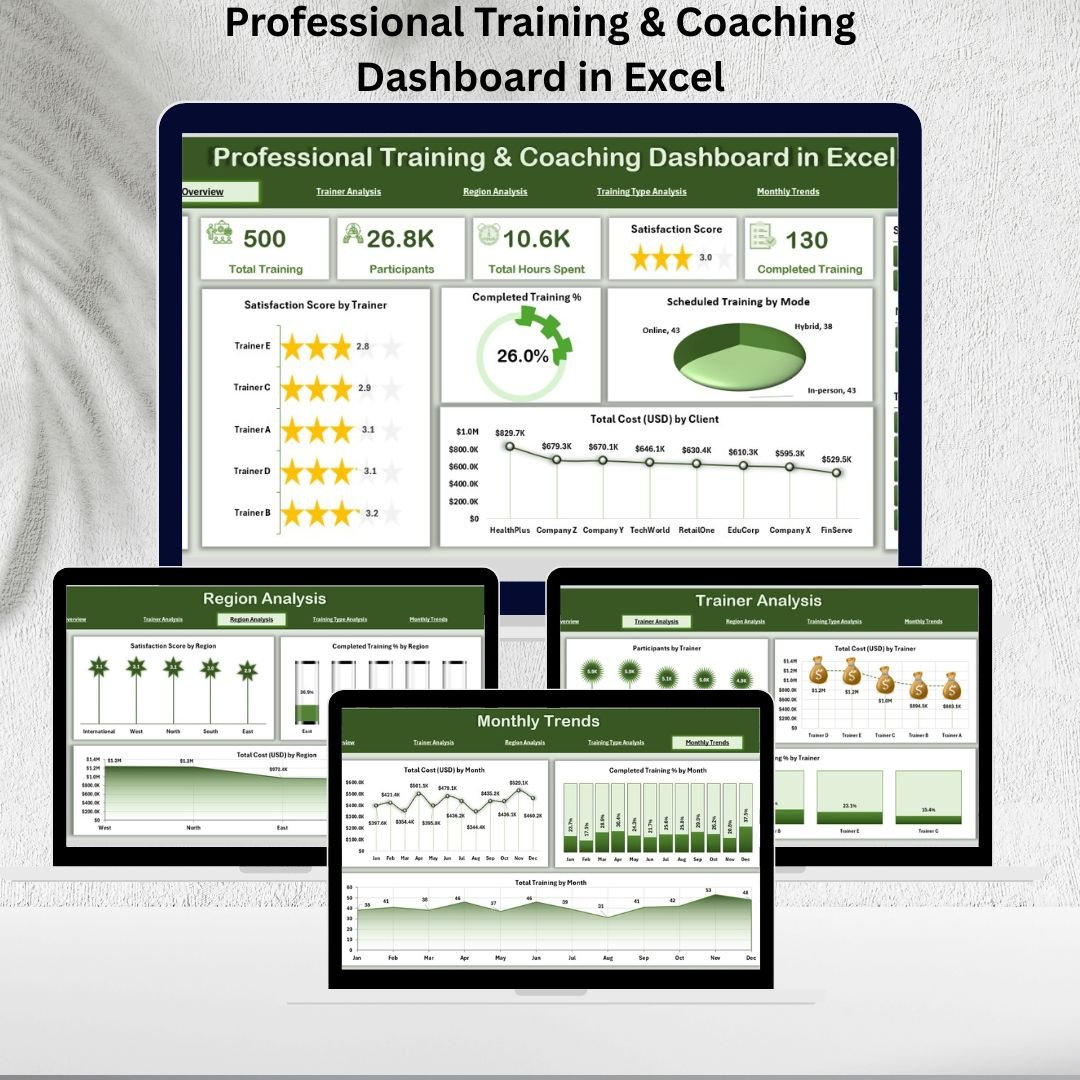
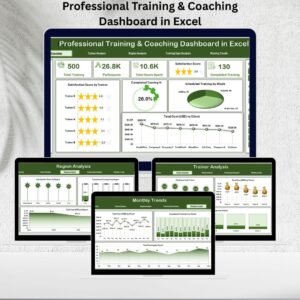
This interactive, Excel-based tool consolidates training and coaching data into one central file. With built-in KPIs, charts, slicers, and filters, it helps HR teams, L&D managers, and training providers track participation, measure satisfaction, evaluate costs, and compare trainer performance.
Instead of working with scattered spreadsheets, this dashboard transforms raw data into clear, actionable insights—all within Microsoft Excel.
🌟 Key Features of Professional Training & Coaching Dashboard in Excel

-
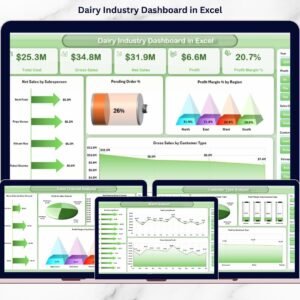
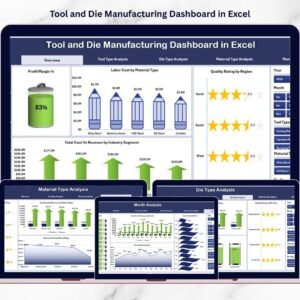
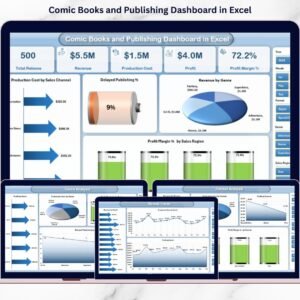
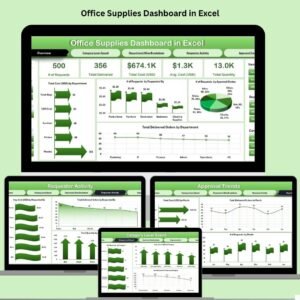
📊 Overview Page: A snapshot of training performance. Includes KPI cards (completed % and total cost), slicers for filtering, and charts for satisfaction scores, training completion, scheduled sessions, and costs by client.
-
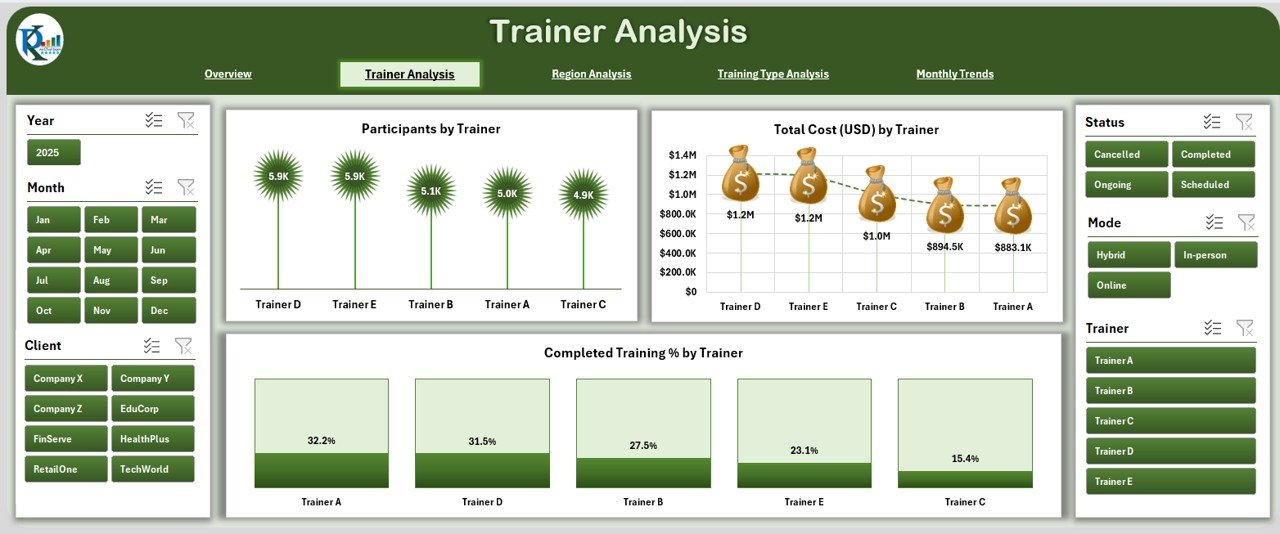
👨🏫 Trainer Analysis Page: Evaluate trainer effectiveness with charts showing participants, costs, and completion rates by trainer. Identify top performers and areas for improvement.
-
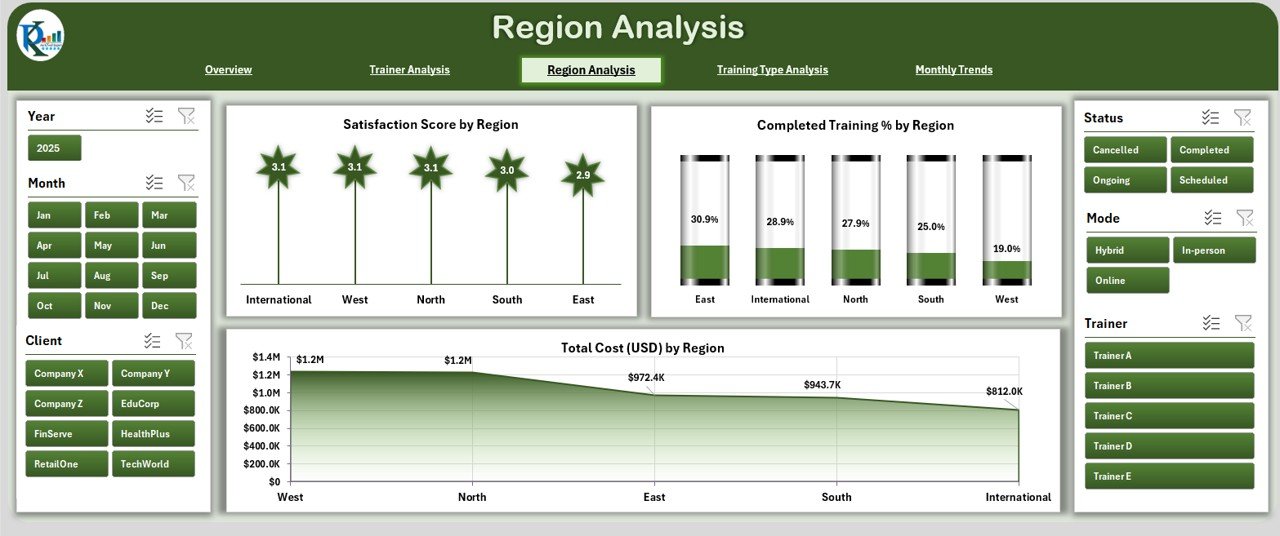
🌍 Region Analysis Page: Compare training results across regions. Charts display satisfaction scores, completion %, and costs for each location.
-
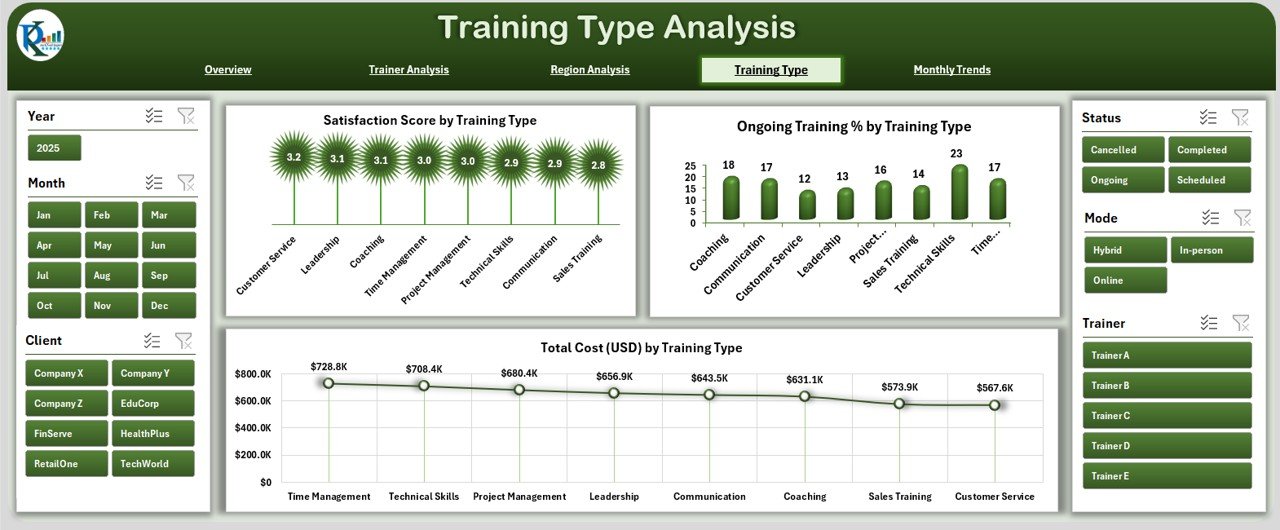
📚 Training Type Analysis Page: Break down performance by type of training—technical, leadership, compliance, or soft skills. View satisfaction, ongoing training %, and costs by category.
-
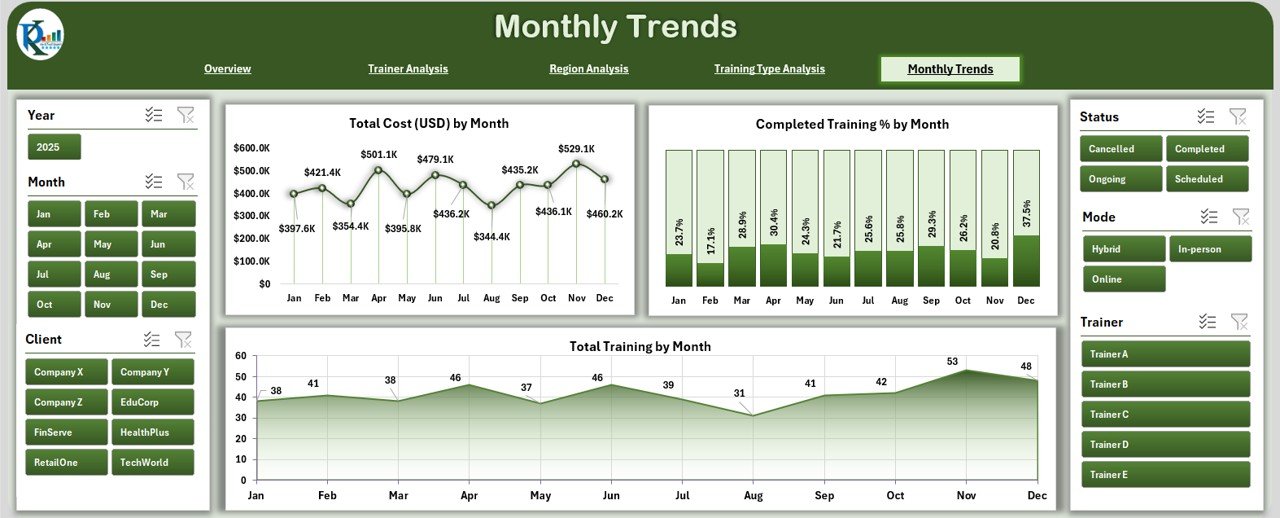
📅 Monthly Trends Page: Spot seasonal patterns and long-term trends with charts showing monthly costs, training completion %, and training volume.
-
⚙ Support Sheet: Ensures consistency with drop-down lists, categories, and controlled values for clean reporting.
📦 What’s Inside the Professional Training & Coaching Dashboard
When you download this template, you’ll get:
-
✅ A ready-to-use Excel dashboard with 5 analytical pages + Support Sheet.
-
✅ Built-in KPIs, slicers, and charts for instant insights.
-
✅ Predefined layouts for Trainer, Region, Training Type, and Monthly analysis.
-
✅ A structured framework you can customize to your organization’s needs.
-
✅ Professional visuals that are easy to present in meetings or reports.
🛠 How to Use the Professional Training & Coaching Dashboard
-
Update Data Sheets: Add training details (trainers, regions, costs, satisfaction scores, and participation).
-
Refresh Pivots: Update pivot tables so charts and KPIs reflect new data.
-
Navigate Pages: Switch between Overview, Trainer, Region, Training Type, and Monthly Trends using the page navigator.
-
Apply Filters: Use slicers to drill down into specific regions, trainers, or training types.
-
Review KPIs: Track training completion, cost efficiency, and satisfaction rates.
-
Share Reports: Export dashboards as PDF or PowerPoint for management or stakeholders.
💡 With Excel’s flexibility, no extra software or coding skills are required!
👥 Who Can Benefit from This Dashboard
The Professional Training & Coaching Dashboard in Excel is ideal for:
-
👩💼 HR Teams & L&D Managers: Gain visibility into training investments and effectiveness.
-
👨🏫 Coaching Providers: Evaluate trainer performance and client satisfaction.
-
🏢 Business Leaders: Monitor costs and ROI of professional development programs.
-
🌍 Regional Managers: Compare training results across multiple locations.
-
📊 Training Consultants: Present professional insights to clients with clean visuals.
If your goal is to maximize ROI, boost employee development, and track training outcomes, this dashboard is the tool you need.
📖 Click here to read the Detailed Blog Post
🎥 Visit our YouTube channel to learn step-by-step video tutorials


Reviews
There are no reviews yet.