
In today’s digital-first marketplace, customer opinions decide success or failure. Star ratings, written reviews, and customer feedback directly influence buying decisions, brand trust, and revenue growth. However, when reviews remain scattered across platforms and spreadsheets, businesses lose valuable insights. That is exactly where the Product Reviews and Ratings KPI Dashboard in Power BI becomes a powerful game-changer.
This professionally designed Power BI dashboard transforms raw customer reviews and ratings into clear KPIs, trend visuals, and performance comparisons. Instead of manually reading hundreds of reviews, you get a single, interactive dashboard that shows how your products perform against targets, past performance, and customer expectations.
Designed for decision-makers, this dashboard helps businesses measure customer satisfaction, identify improvement areas, and drive better product decisions—all from one centralized Power BI solution.
Key Features of Product Reviews and Ratings KPI Dashboard in Power BI ⭐
📊 Centralized KPI Monitoring
Track all product review and rating KPIs in one unified Power BI dashboard.
🎯 Target vs Actual Performance Tracking
Instantly see whether KPIs meet or miss targets using visual indicators and percentages.
📅 MTD & YTD Analysis
Monitor Month-to-Date and Year-to-Date performance for short-term control and long-term strategy.
📈 Current Year vs Previous Year Comparison
Understand improvement or decline in customer perception over time.
🔍 Interactive Filters & Slicers
Filter data by Month, KPI Group, or KPI Name for focused analysis.
📉 Trend Visualization
Analyze performance patterns using MTD and YTD combo charts.
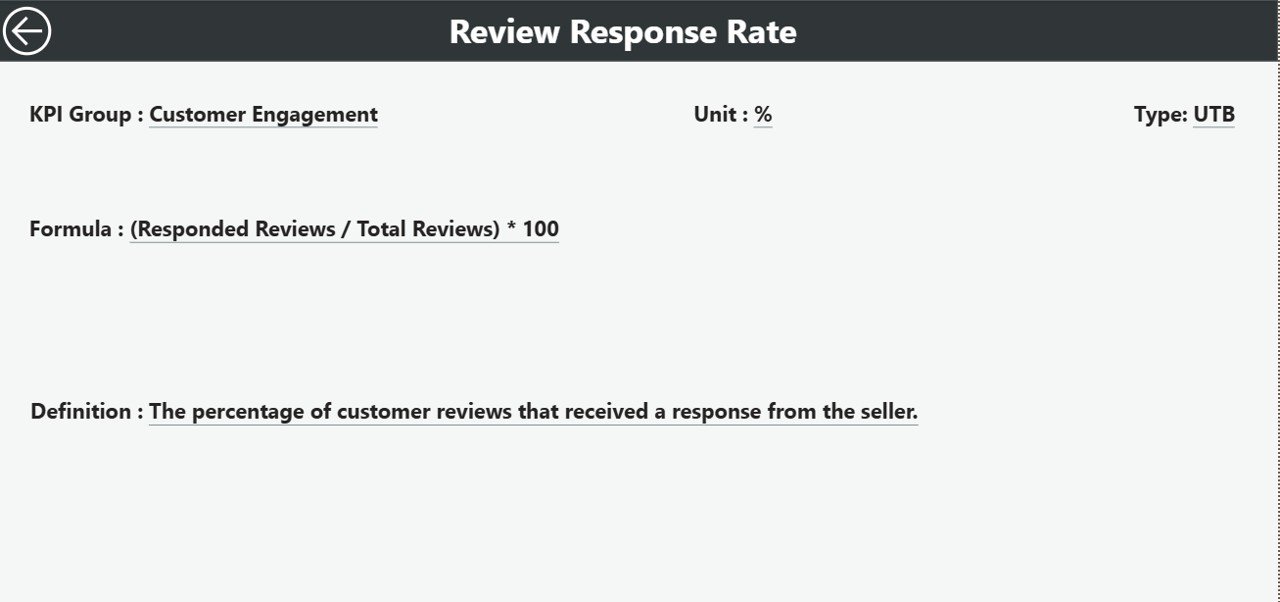
📘 KPI Definition Drill-Through Page
Understand every KPI clearly with definitions, formulas, and KPI type (UTB / LTB).
🔄 Excel-Driven & Auto-Refresh
Update Excel data and refresh Power BI visuals instantly without manual reporting.
What’s Inside the Product Reviews and Ratings KPI Dashboard in Power BI 📂
📌 Summary Page
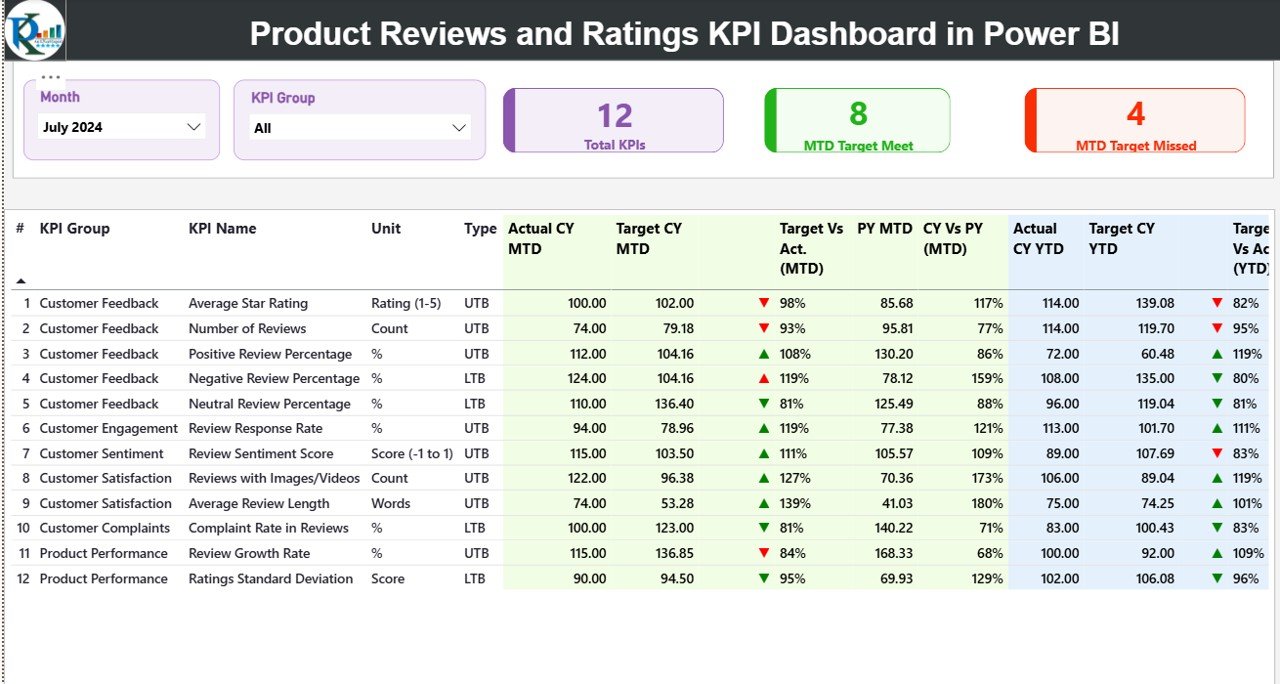
A high-level overview with KPI cards showing Total KPIs, MTD Target Met, and MTD Target Missed counts, along with a detailed KPI performance table.
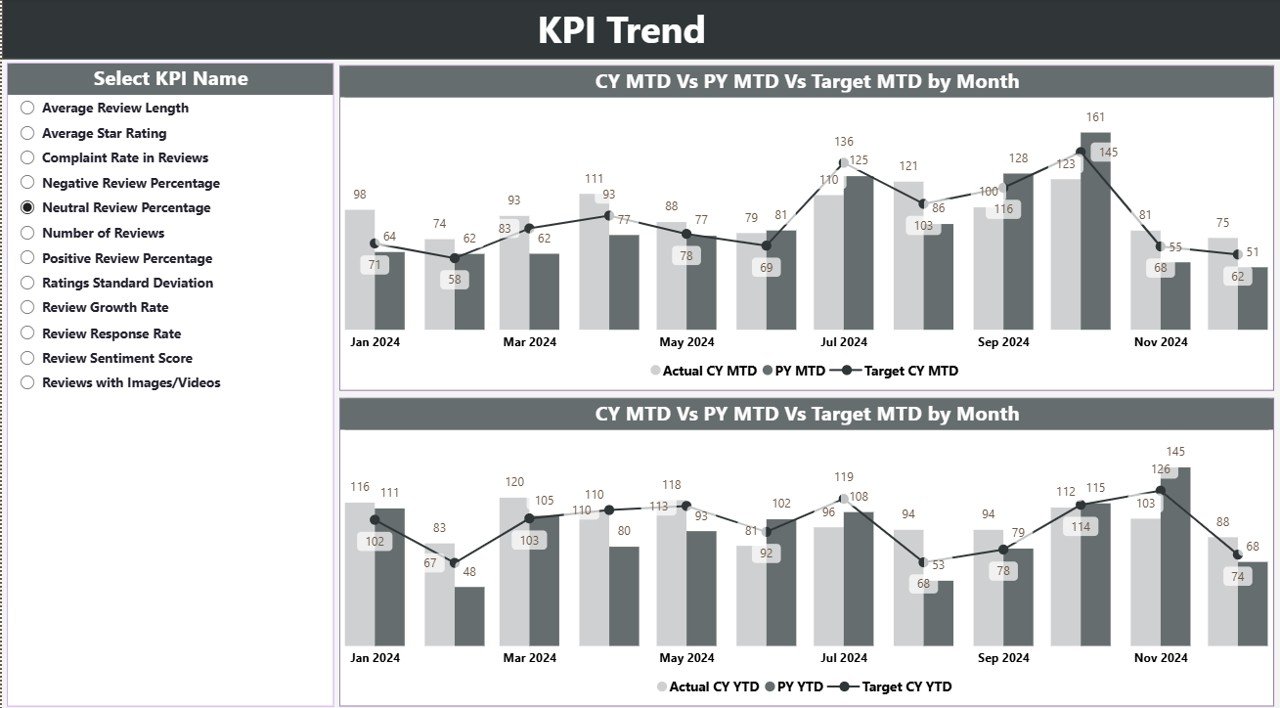
📌 KPI Trend Page
Visual trend analysis comparing Actual, Target, and Previous Year performance for both MTD and YTD values.
📌 KPI Definition Page
A hidden drill-through page displaying KPI number, group, unit, formula, definition, and KPI type.
📌 Excel Data Source File
Structured Excel sheets including:
-
Input_Actual
-
Input_Target
-
KPI Definition
📌 Standardized KPI Logic
Supports UTB (Upper the Better) and LTB (Lower the Better) KPIs for accurate evaluation.
How to Use the Product Reviews and Ratings KPI Dashboard in Power BI 🧭
1️⃣ Enter Actual KPI values into the Input_Actual Excel sheet
2️⃣ Define monthly and yearly targets in the Input_Target sheet
3️⃣ Maintain KPI structure in the KPI Definition sheet
4️⃣ Refresh the Power BI file
5️⃣ Use slicers to analyze performance by month, KPI group, or KPI name
No advanced Power BI skills are required. If you can update Excel, you can use this dashboard confidently.
Who Can Benefit from This Product Reviews and Ratings KPI Dashboard in Power BI 👥
✔ Product Managers
✔ Customer Experience Teams
✔ Quality Assurance Teams
✔ E-commerce & Retail Businesses
✔ SaaS & Subscription-Based Companies
✔ Marketing & Brand Teams
✔ Senior Management & Leadership
Any organization that values customer feedback and data-driven decisions will benefit from this dashboard.
Click here to read the Detailed Blog Post
🔗 Visit our YouTube channel to learn step-by-step video tutorials
Visit our YouTube channel to learn step-by-step video tutorials


Reviews
There are no reviews yet.