
In today’s fast-moving business environment, procurement teams are under constant pressure to control costs, manage suppliers, reduce delivery delays, and improve efficiency. However, when procurement data remains scattered across spreadsheets, ERP systems, and emails, decision-making becomes slow, reactive, and risky. That is exactly where the Procurement Analytics Dashboard in Power BI becomes a powerful business solution.
The Procurement Analytics Dashboard in Power BI is a ready-to-use, interactive analytics tool designed to monitor, analyze, and optimize procurement performance from a single centralized dashboard. Instead of manually reviewing raw purchase data, this dashboard converts complex procurement information into clear KPIs, insightful charts, and actionable trends.
Built using Power BI for visualization, this dashboard enables procurement teams to analyze actual cost, planned cost, cost variance, lead time, delivery delays, and departmental spending in real time. As a result, organizations gain instant visibility into procurement inefficiencies and cost leakages.
Most importantly, this dashboard helps procurement leaders move from reactive reporting to proactive cost control. With interactive slicers and page-wise insights, teams can quickly identify high-spend areas, delayed deliveries, and regions or departments with consistent variances.
Whether you are managing procurement for manufacturing, retail, services, or enterprise operations, this dashboard empowers you to make faster, data-driven decisions with confidence.
⭐ Key Features of Procurement Analytics Dashboard in Power BI
📊 Centralized Procurement KPIs – All metrics in one dashboard
💰 Actual vs Planned Cost Analysis – Control budget overruns
📉 Cost Variance Tracking – Identify inefficiencies instantly
⏱️ Lead Time & Delivery Delay Analysis – Improve supplier performance
🌍 Region-Wise & Department-Wise Insights – Better cost governance
📅 Monthly Trend Analysis – Forecast and plan effectively
🎯 Interactive Slicers – Drill down by category, region, or department
🚀 Decision-Ready Visuals – Faster insights, smarter actions
📦 What’s Inside the Procurement Analytics Dashboard
📌 Overview Page
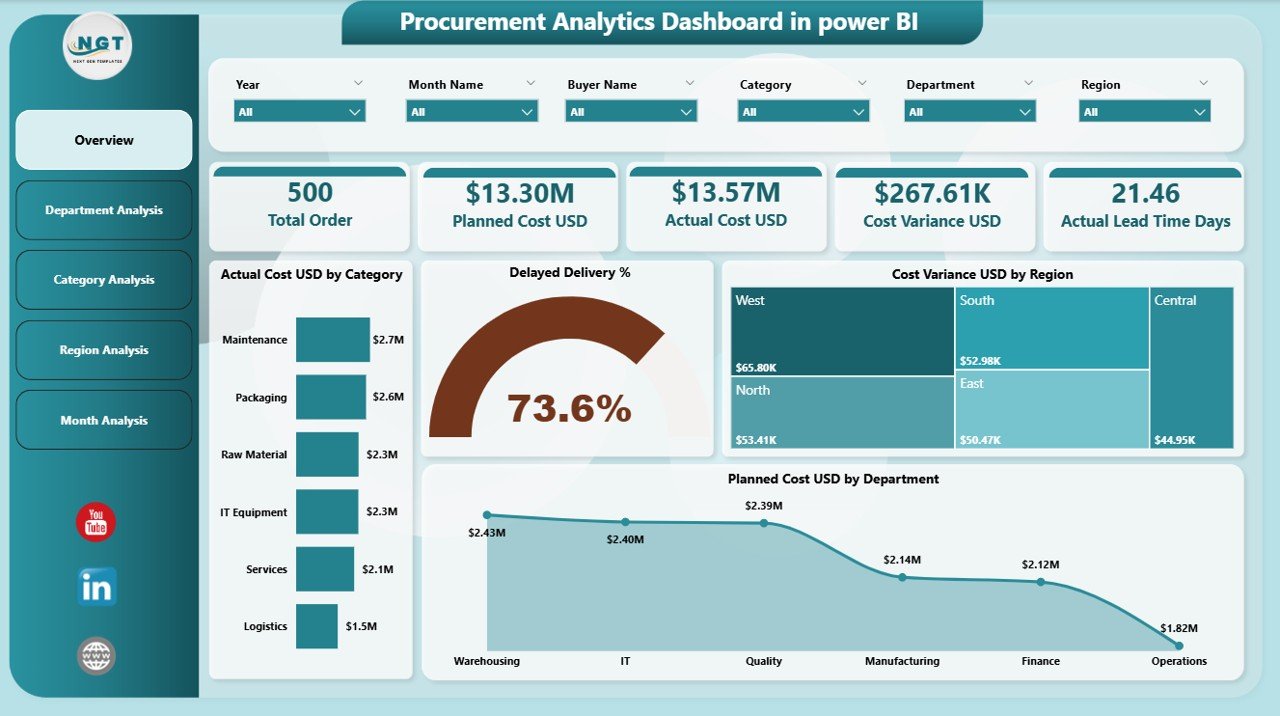
The Overview Page serves as the executive summary of the dashboard.
It includes:
-
Interactive slicers for quick filtering
-
KPI cards showing procurement health
-
High-impact charts such as:
-
Actual Cost USD by Category
-
Delayed Delivery %
-
Cost Variance USD by Region
-
Planned Cost USD by Department
-
This page allows leadership to assess procurement performance at a glance.
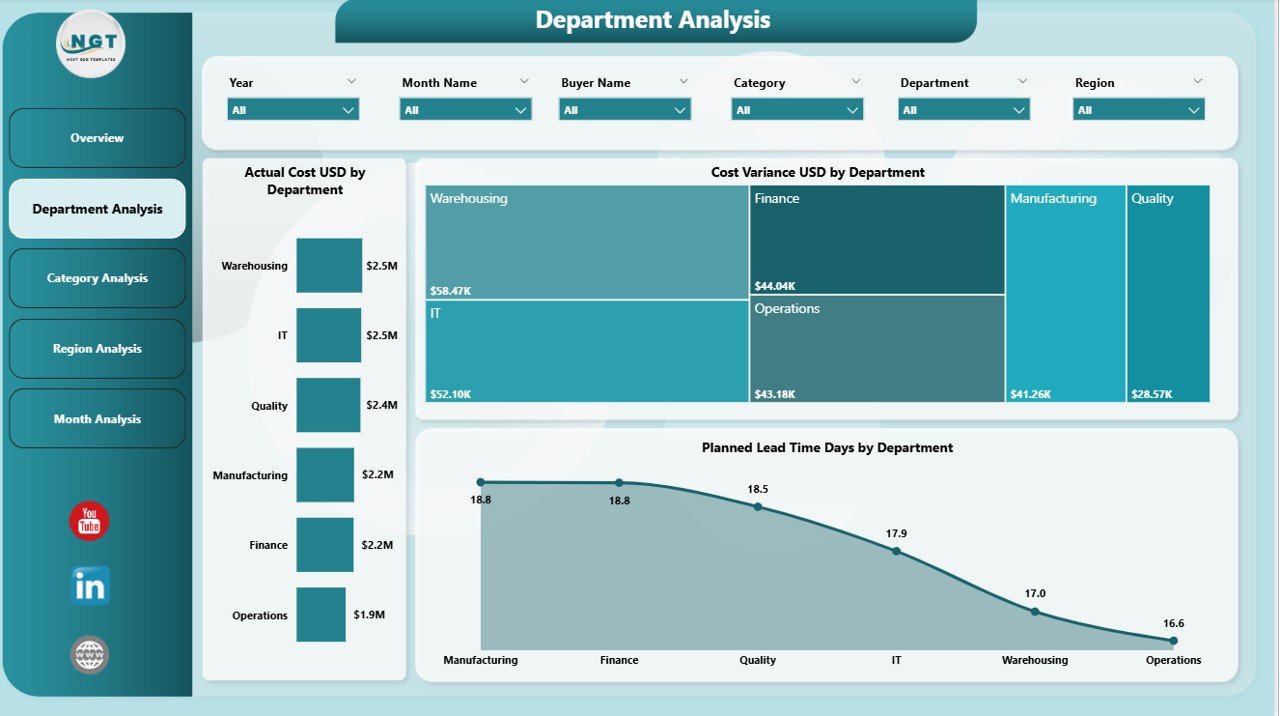
🏢 Department Analysis Page
This page focuses on procurement performance across departments.
It shows:
-
Actual Cost USD by Department
-
Cost Variance USD by Department
-
Planned Lead Time (Days) by Department
As a result, organizations can identify overspending departments and improve accountability.
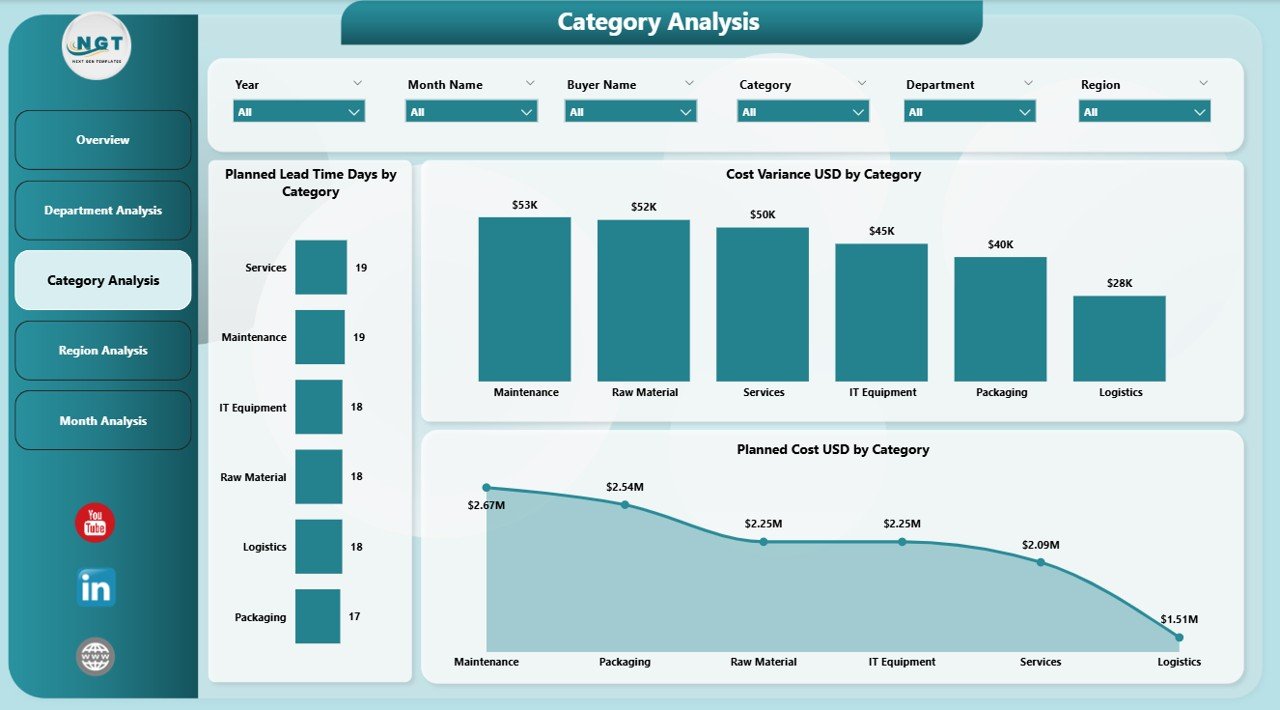
🧱 Category Analysis Page
The Category Analysis Page evaluates procurement categories such as materials, services, IT, or logistics.
It includes:
-
Planned Lead Time by Category
-
Cost Variance USD by Category
-
Planned Cost USD by Category
This page supports smarter sourcing and negotiation strategies.
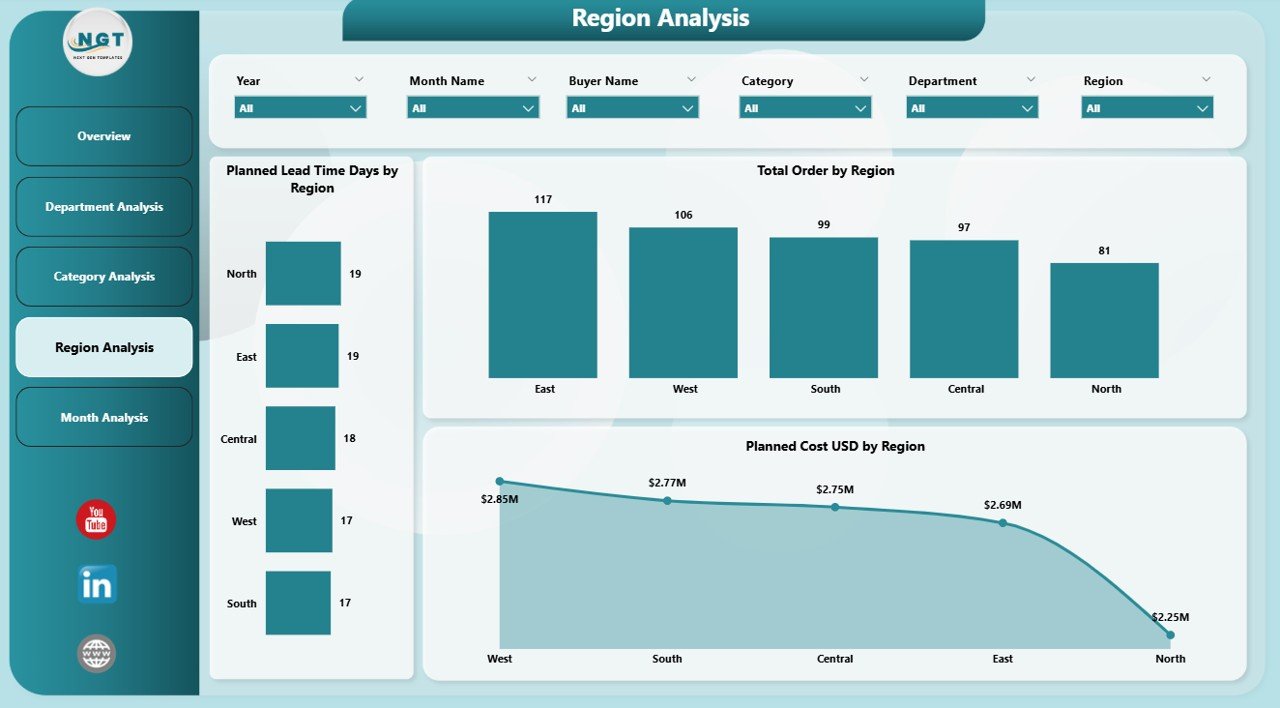
🌍 Region Analysis Page
Procurement performance often varies by geography. This page highlights:
-
Planned Lead Time Days by Region
-
Planned Cost USD by Region
-
Actual vs Planned Cost comparison
Therefore, organizations gain better regional procurement control.
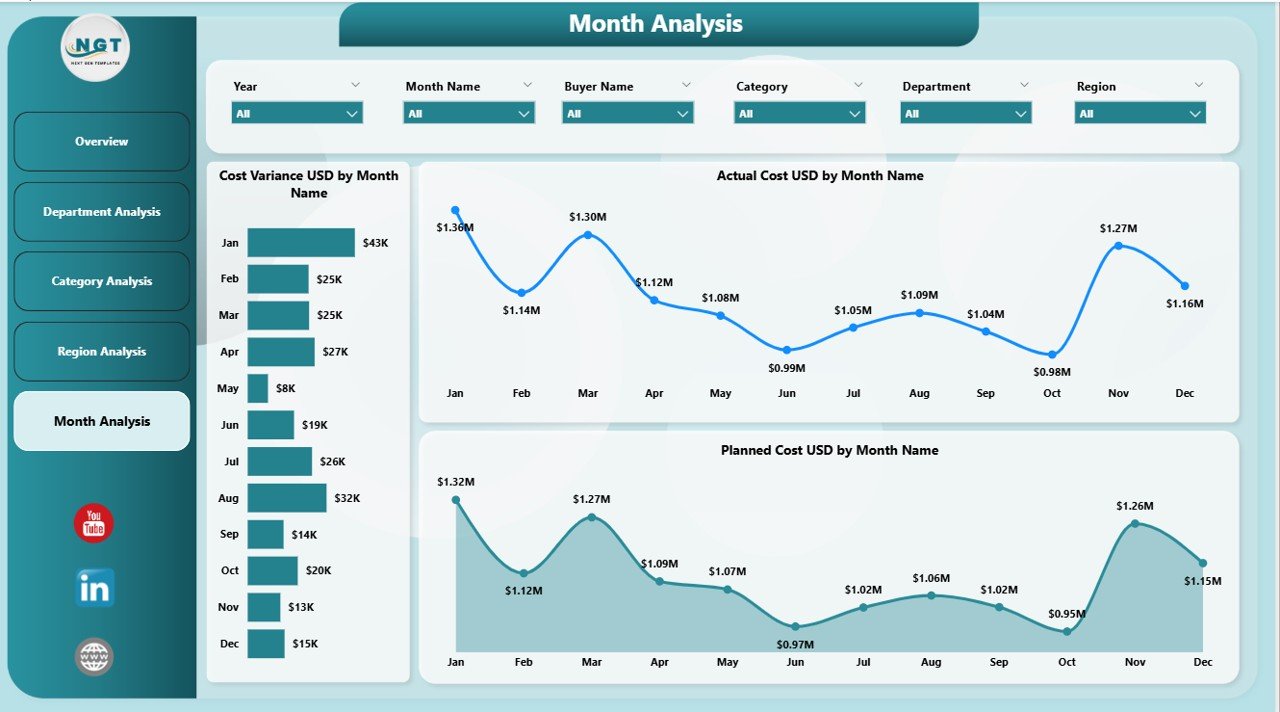
📈 Monthly Trends Page
This page focuses on time-based analysis.
It tracks:
-
Cost Variance USD by Month
-
Actual Cost USD by Month
-
Planned Cost USD by Month
As a result, procurement teams can identify trends, seasonality, and long-term patterns.
🛠️ How to Use the Procurement Analytics Dashboard
1️⃣ Load procurement data from Excel or ERP
2️⃣ Refresh Power BI dataset
3️⃣ Apply slicers for focused analysis
4️⃣ Review cost variances and delays
5️⃣ Take corrective procurement actions
6️⃣ Monitor trends and improvements over time
👥 Who Can Benefit from This Dashboard
-
Procurement Managers
-
Supply Chain Teams
-
Finance & Budgeting Teams
-
Operations Managers
-
Senior Leadership
-
Internal Audit Teams
Any organization aiming for cost-efficient and transparent procurement will benefit from this dashboard.
### 📘 Click here to read the Detailed blog post
📺 Visit our YouTube channel to learn step-by-step video tutorials
👉 https://youtube.com/@PKAnExcelExpert


Reviews
There are no reviews yet.