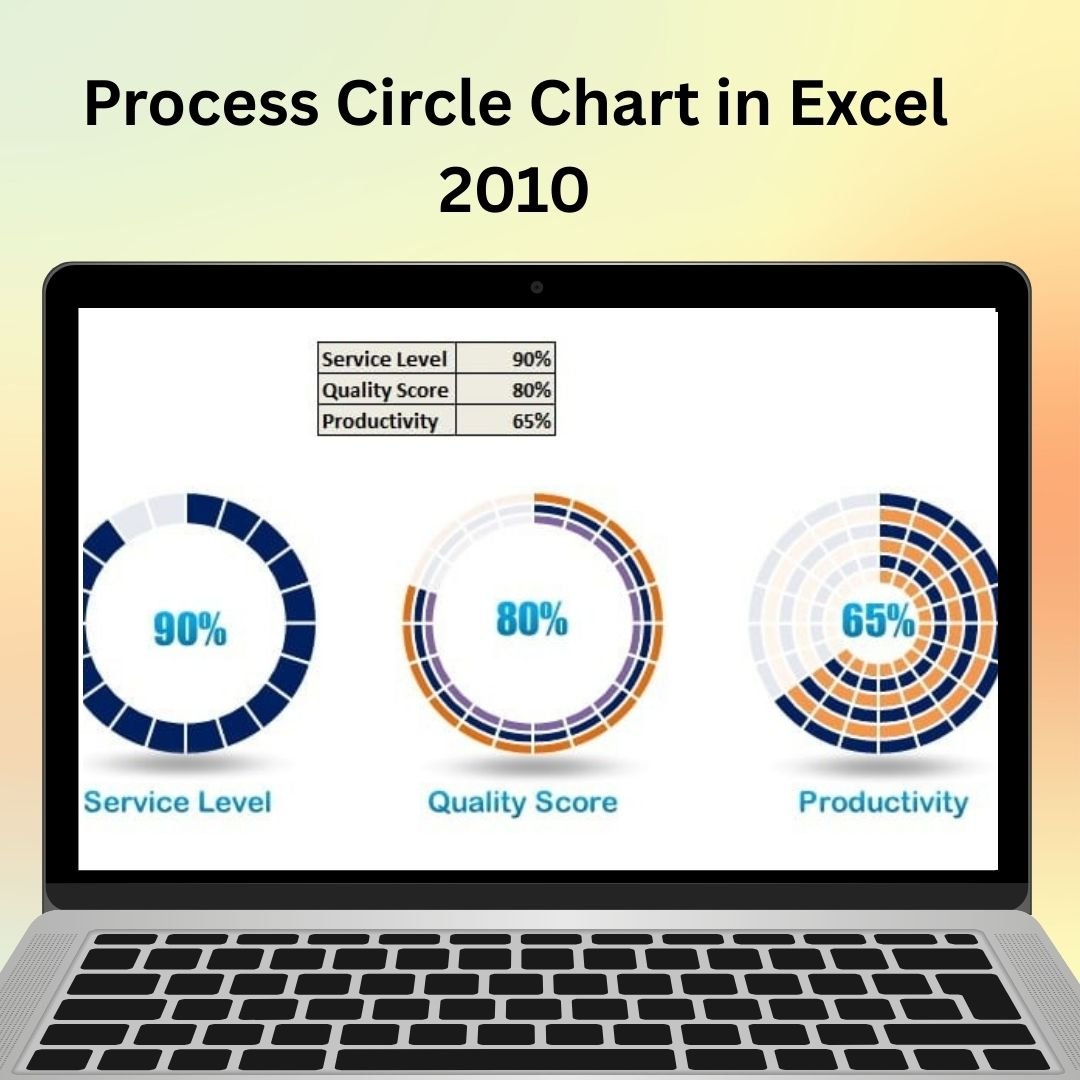
The Process Circle Chart in Excel 2010 is a dynamic and visually appealing tool designed to help you represent processes, progress, or any sequence of steps in a clean, professional manner. This chart provides a circular layout that is ideal for illustrating cyclical processes, project phases, or sequential data, making it perfect for presentations, reports, and dashboards.
The Process Circle Chart in Excel is fully customizable, allowing you to adapt it to a wide range of applications. Whether you’re tracking project milestones, sales progress, or operational workflows, this chart gives you the flexibility to modify data points, colors, and labels. It’s perfect for businesses, project managers, and anyone looking to present data in a visually engaging and easy-to-understand format.
Key Features of the Process Circle Chart in Excel 2010
📌 Circular Process Visualization
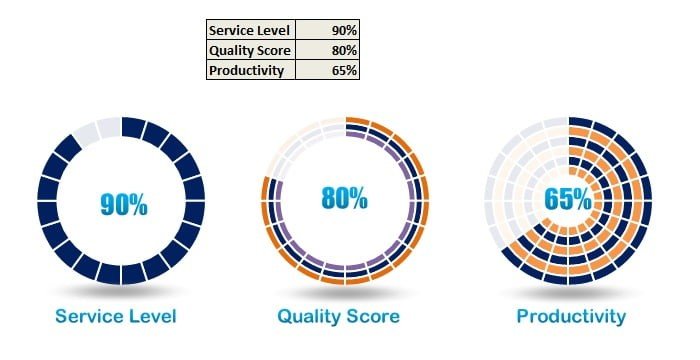
The chart uses a circular design to represent processes or sequences, making it easy to see progress, steps, or stages at a glance. The circular layout is visually appealing and helps to convey the cyclical nature of the data effectively.
🛠 Customizable Data and Labels
Easily adjust the data and labels to fit your specific needs. Whether you’re illustrating project phases, steps in a process, or any sequence of actions, you can modify the chart to reflect your data accurately.
💡 Dynamic Design
This chart allows you to display data in a circular format with interactive sections that update as data is entered. Each segment of the circle represents a different step or stage, and you can change the size and color to represent progress or status.
🔢 Real-Time Data Updates
As you update the data, the process circle chart automatically adjusts to reflect the new values. This feature ensures that your chart is always up-to-date, making it ideal for ongoing projects or processes that require continuous tracking.
🚀 Multiple Use Cases
This template is versatile and can be applied to various industries and scenarios, including project management, business workflows, product development, and marketing campaigns. Use the process circle to track milestones, sales stages, or any other sequential data.
📊 Clear Data Presentation
The circular format offers a unique and clear way to present information, making it easier for your audience to understand the process flow, track progress, or identify areas that need attention. It’s a professional, organized way to present key steps and milestones.
⚙ Easy Setup and Customization
The template is simple to use, with clear instructions to guide you through the customization process. You don’t need advanced Excel skills to get started with the process circle chart.
🚀 Why You’ll Love the Process Circle Chart in Excel 2010
✅ Visually Engaging – Use a circular layout to present processes and progress in a visually appealing way. ✅ Customizable Design – Modify data, labels, colors, and sections to fit your needs. ✅ Real-Time Updates – Automatically adjust as you input new data, keeping your chart current. ✅ Clear Process Flow – Easily represent steps, stages, or processes for better data presentation. ✅ Easy Setup – Simple to implement, with clear instructions for customization.
📂 What’s Inside the Process Circle Chart in Excel 2010?
- Circular Design: A visually dynamic way to represent processes or stages.
- Customizable Data: Adjust data points and labels to suit your project or process.
- Real-Time Updates: Automatically adjust as new data is entered.
- Professional Look: Use the chart for reports, presentations, or dashboards.
- Clear Setup Instructions: Easy steps to set up and implement the chart.
🔍 How to Use the Process Circle Chart in Excel 2010
1️⃣ Download the Template – Get immediate access to the Excel file upon purchase. 2️⃣ Customize the Chart – Modify the labels, data points, and colors to reflect your specific process or project. 3️⃣ Input Data – Enter your data into the chart, and watch the circle update automatically. 4️⃣ Track Progress – Use the circular chart to visualize steps, stages, or progress. 5️⃣ Present and Share – Use the chart in presentations, reports, or dashboards to present your data effectively.
🎯 Who Can Benefit from the Process Circle Chart in Excel 2010? 🔹 Project Managers 🔹 Business Analysts 🔹 Sales Teams 🔹 Marketing Professionals 🔹 HR Teams 🔹 Anyone tracking processes, goals, or project milestones
Track and visualize your processes or project progress with the Process Circle Chart in Excel 2010. This tool makes your data presentation more engaging, organized, and easy to understand.
Click here to read the Detailed blog post
https://www.pk-anexcelexpert.com/process-circle-chart-in-excel-2010/


Reviews
There are no reviews yet.