In the high-stakes world of private equity, data precision means profit 💰. Every investment decision, from fund allocation to portfolio exit, depends on accurate, transparent, and real-time performance tracking. The Private Equity KPI Scorecard in Excel is a powerful tool that empowers fund managers and analysts to evaluate, monitor, and optimize performance — all within a single interactive dashboard.
This ready-to-use Excel template provides an instant snapshot of fund health, investor returns, and portfolio performance. Whether you manage venture funds, growth capital, or leveraged buyouts, this scorecard helps transform raw data into actionable insights — simplifying what used to take hours of manual reporting 📊.
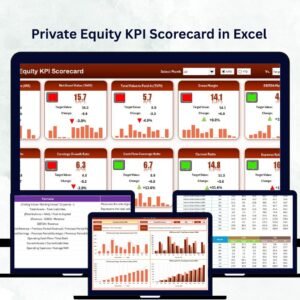
With built-in formulas, color-coded visuals, and dropdown-based navigation, you’ll always have clarity over key financial indicators like IRR, MOIC, TVPI, and DPI — empowering data-driven investment decisions.
⚙️ Key Features of the Private Equity KPI Scorecard in Excel
📊 Four Functional Sheets – Scorecard, KPI Trend, Input Data, and KPI Definition.
🎯 MTD & YTD Comparison – Monitor Month-to-Date and Year-to-Date performance seamlessly.
💡 Actual vs Target vs Previous Year – Instantly compare progress across timeframes.
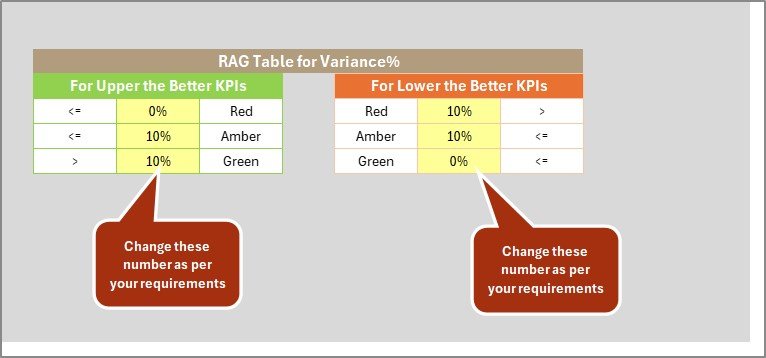
🟢 Color-Coded Indicators – Green for above target, yellow for near, red for below.
📈 Interactive KPI Trend Charts – Visualize portfolio and fund performance effortlessly.
💾 Dynamic Data Engine – Update data once and refresh your entire dashboard automatically.
📘 KPI Reference Sheet – Standardized definitions for consistency across teams.
💼 Built for Finance Professionals – Ideal for fund managers, analysts, and investors.
📦 What’s Inside the Scorecard
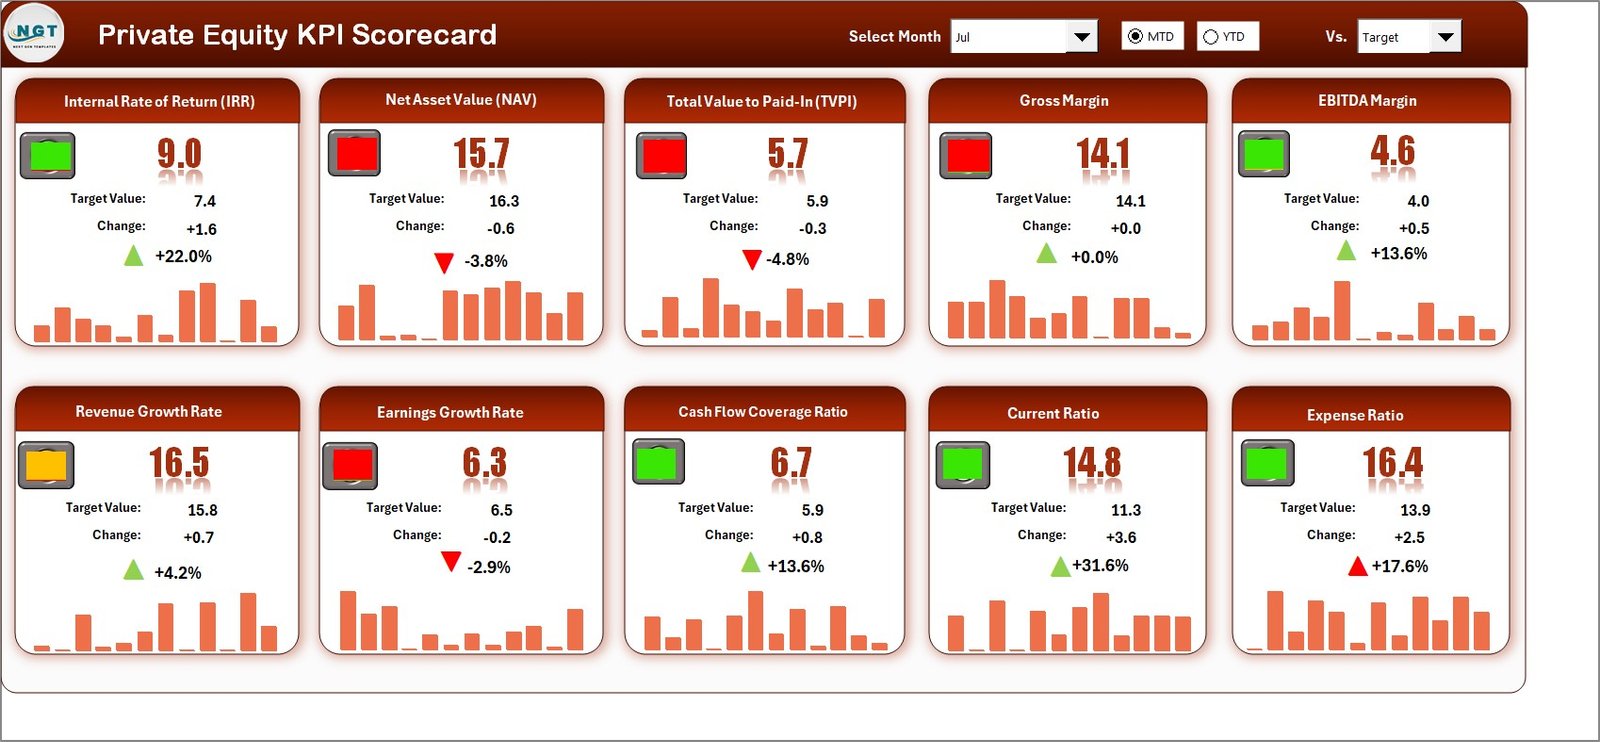
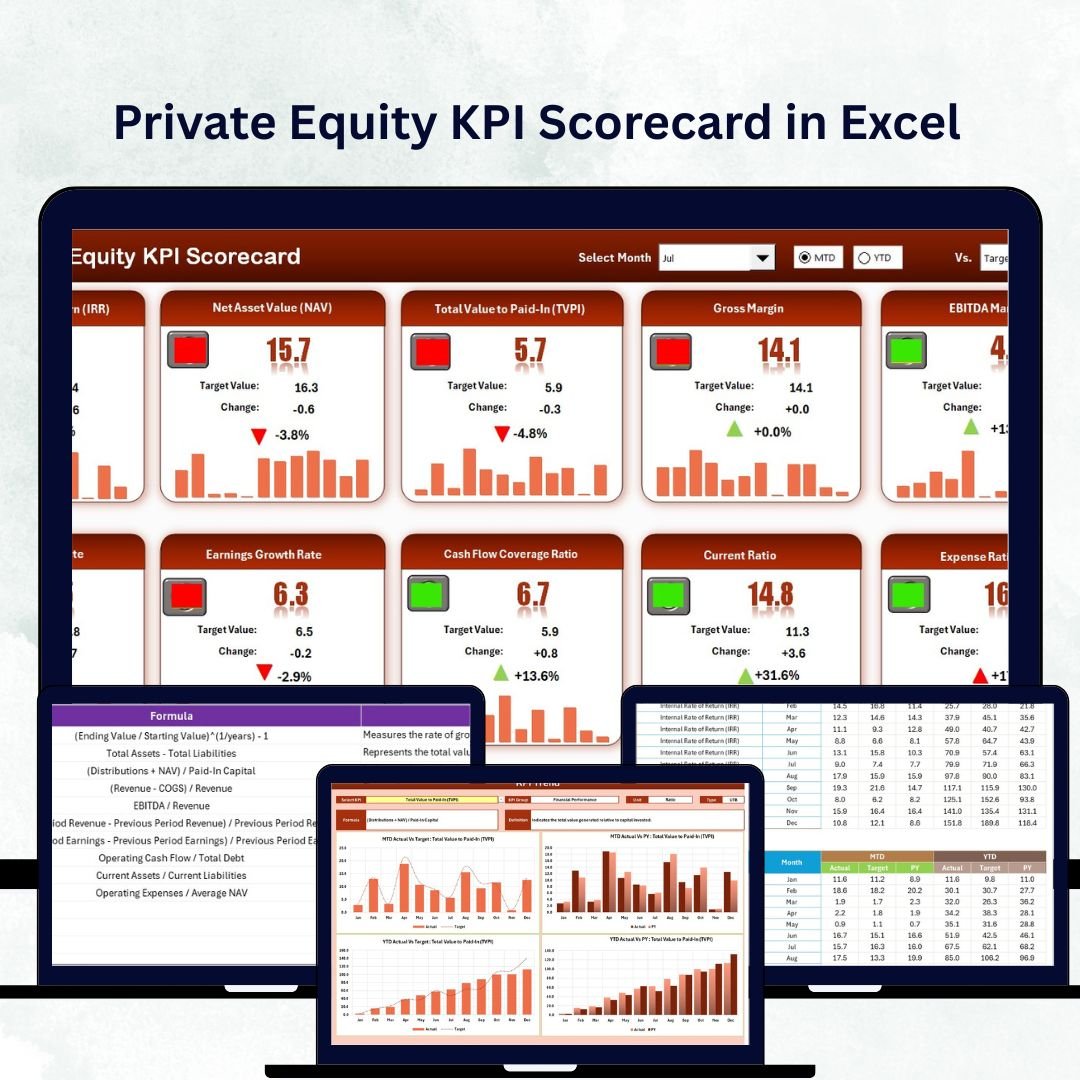
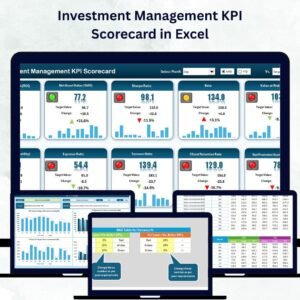
1️⃣ Scorecard Sheet – The Central Dashboard
Your all-in-one command center for tracking private equity metrics.
-
Dropdown selectors for month and MTD/YTD analysis.
-
Actual vs Target visualizations with performance arrows.
-
KPI list with unit, value, and variance data.
📊 The dashboard updates instantly — providing a clear, professional summary of fund performance.
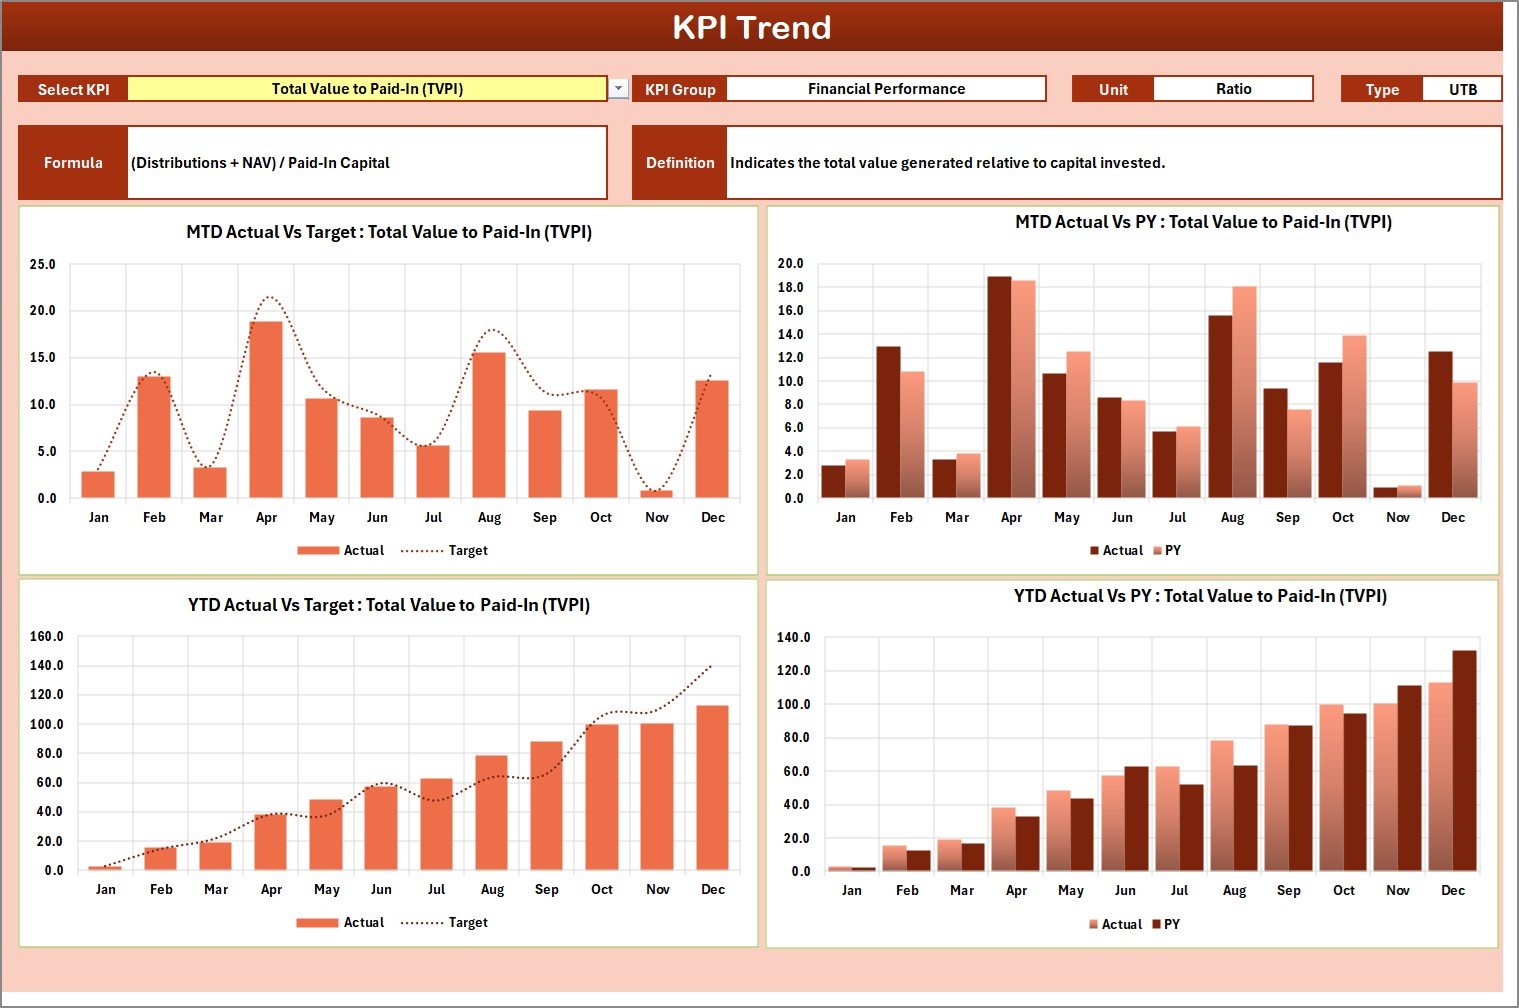
2️⃣ KPI Trend Sheet – Visual Storytelling for Performance
See how your KPIs evolve over time:
-
Choose any KPI from a dropdown (cell C3).
-
View its Group, Unit, Type (LTB/UTB), Formula & Definition.
-
Interactive MTD & YTD charts display Actual, Target, and PY data.
Perfect for investor meetings, portfolio reviews, and quarterly reports.
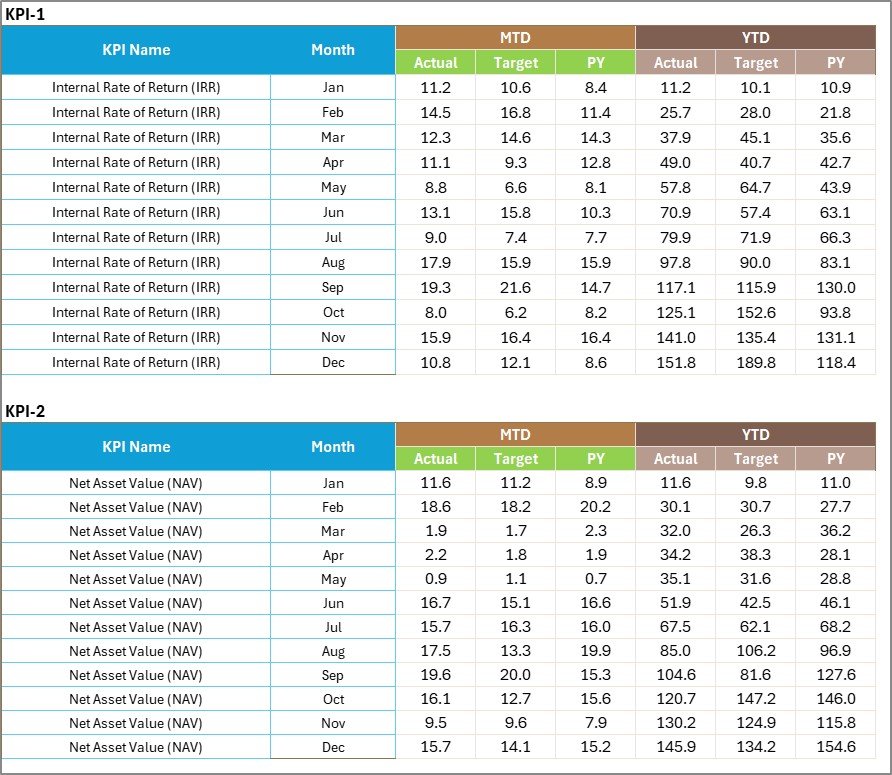
3️⃣ Input Data Sheet – The Data Engine
-
Record all monthly Actual, Target, and Previous Year values.
-
Auto-updates propagate through the dashboard instantly.
-
Clean tabular format ensures error-free entry and full transparency.
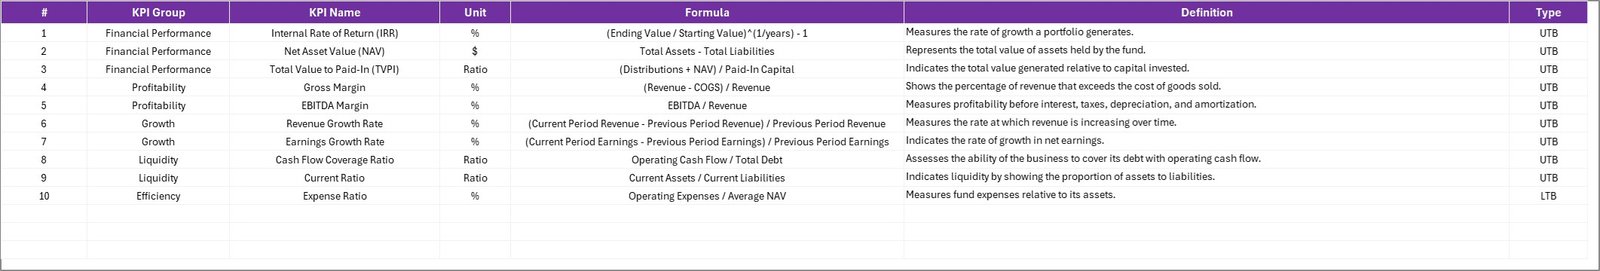
4️⃣ KPI Definition Sheet – Standardized Clarity
-
Define every metric clearly with Name, Group, Unit, Formula, and Definition.
-
Mark KPIs as Upper the Better (UTB) or Lower the Better (LTB).
This ensures all stakeholders interpret metrics the same way.
💹 Example KPIs to Track
💰 Fund Performance KPIs – IRR, MOIC, DPI, RVPI, TVPI.
🏢 Portfolio KPIs – EBITDA Growth, Revenue CAGR, Debt-to-Equity Ratio, Exit Multiple.
🤝 Investor & Fundraising KPIs – Commitment Rate, Capital Deployment Rate, Investor Retention Rate, Fundraising Cycle Duration.
These metrics provide a 360° view of profitability, efficiency, and investor satisfaction.
🌟 Advantages of the Private Equity KPI Scorecard in Excel
✅ Centralized Fund Visibility – View all KPIs across portfolios and funds in one file.
✅ Cost-Effective Solution – No software licenses or complex setups needed.
✅ Instant Insights – Compare Actual vs Target vs Previous Year metrics in real time.
✅ Transparency & Trust – Clearly defined formulas ensure data reliability.
✅ Customization Flexibility – Add new KPIs, layouts, and charts anytime.
✅ Professional Presentations – Ideal for investor decks and performance reviews.
✅ Scalable for Any Firm – Suitable for boutique funds or large investment houses.
💡 Best Practices for Effective Use
-
🎯 Define KPIs that align with fund goals and investment strategy.
-
📅 Update Actual and Target data monthly for accuracy.
-
🟢 Use visuals and colors to highlight critical insights.
-
📈 Review trends quarterly to adjust strategy proactively.
-
🤝 Assign ownership of KPIs to maintain accountability.
-
🔒 Protect sensitive data with Excel password features.
-
🔁 Evolve your KPIs as the market and firm objectives change.
With disciplined use, this scorecard transforms reporting into strategic intelligence — not just spreadsheets.


Reviews
There are no reviews yet.