Port purchasing operations play a crucial role in cost control, operational continuity, and service quality. Every day, ports procure equipment, spare parts, fuel, maintenance services, and infrastructure materials. Even small inefficiencies in purchasing can lead to budget overruns, delayed operations, and poor vendor performance. Unfortunately, many port authorities and logistics teams still depend on scattered spreadsheets and manual reports. As a result, procurement visibility remains low and corrective action comes too late.
That is exactly where the Port Purchasing Dashboard in Excel becomes an essential solution.
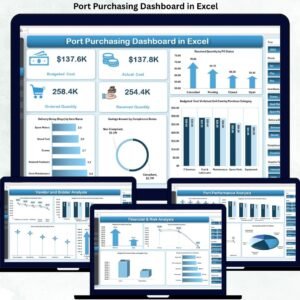
This ready-to-use Excel dashboard transforms raw purchasing and procurement data into clear, visual, and actionable insights. Instead of spending hours consolidating reports, procurement teams gain a centralized view of budgeted cost, actual cost, quantities ordered and received, supplier performance, savings, and delivery delays—all in one interactive dashboard. Because it is built in Excel, the dashboard is easy to deploy, flexible to customize, and familiar to users at every level.
✨ Key Features of the Port Purchasing Dashboard in Excel
📊 Centralized Procurement Visibility
Track all purchasing KPIs from a single dashboard without switching between multiple spreadsheets.
💰 Budget vs Actual Cost Tracking
Monitor planned procurement spend against actual cost to identify overruns early.
📦 Order Fulfillment Monitoring
Compare ordered quantity vs received quantity to track fulfillment gaps and delays.
🚚 Delivery Delay Analysis
Identify items, suppliers, and ports with frequent delivery delays.
🏷️ Supplier Performance Insights
Evaluate suppliers based on cost efficiency, delivery reliability, and savings contribution.
📦 What’s Inside the Port Purchasing Dashboard in Excel
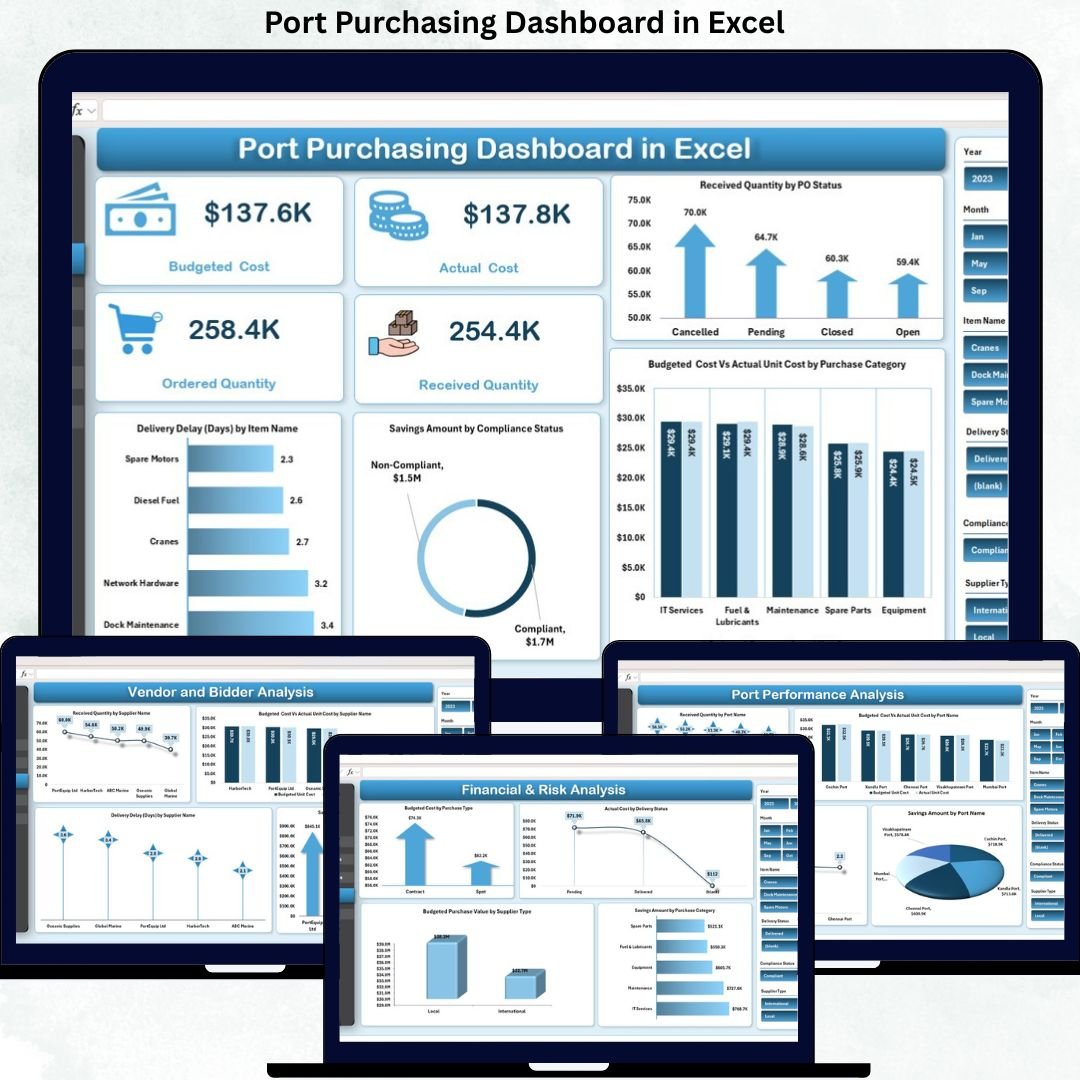
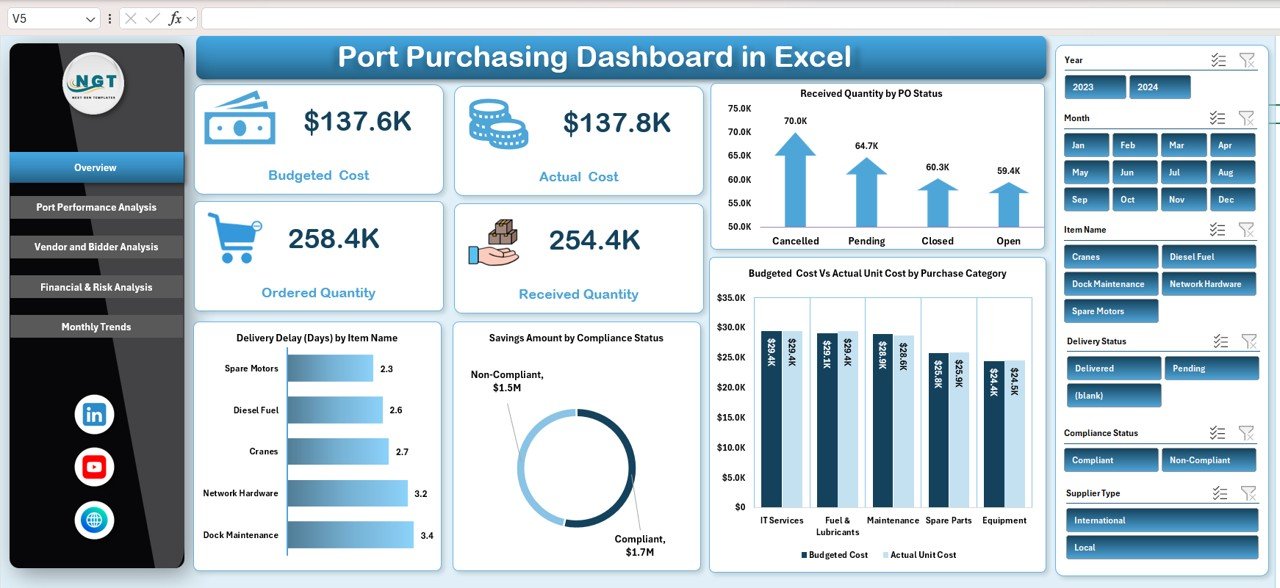
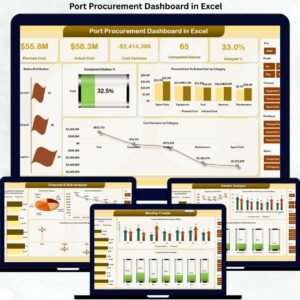
🖥️ Overview Sheet Tab – High-Level Purchasing Snapshot
The Overview sheet provides an executive summary of procurement performance.
Key KPI Cards
-
Budgeted Cost – Planned procurement spend
-
Actual Cost – Actual spend incurred
-
Ordered Quantity – Total quantity ordered
-
Received Quantity – Quantity delivered
These KPIs immediately highlight cost gaps and fulfillment issues.
Charts on the Overview Sheet
-
Received Quantity by PO Status – Tracks order completion progress
-
Budgeted Cost vs Actual Unit Cost by Purchase Category – Highlights cost overruns
-
Savings Amount by Compliance Status – Shows benefits of compliant purchasing
-
Delivery Delay (Days) by Item Name – Identifies delayed items
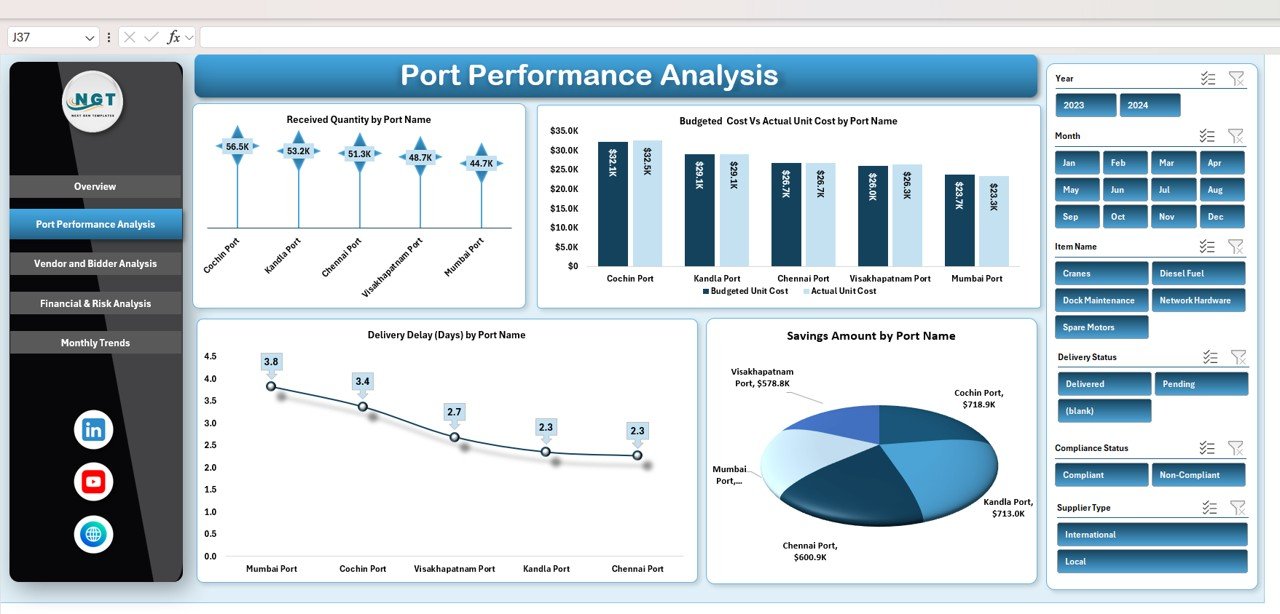
⚓ Port Performance Analysis
This section evaluates procurement performance at the port level.
Charts Included
-
Received Quantity by Port Name – Fulfillment efficiency by port
-
Budgeted Cost vs Actual Unit Cost by Port Name – Cost control comparison
-
Delivery Delay (Days) by Port Name – Logistics efficiency indicator
-
Savings Amount by Port Name – Procurement discipline by port
This analysis helps management benchmark ports and address weak areas quickly.
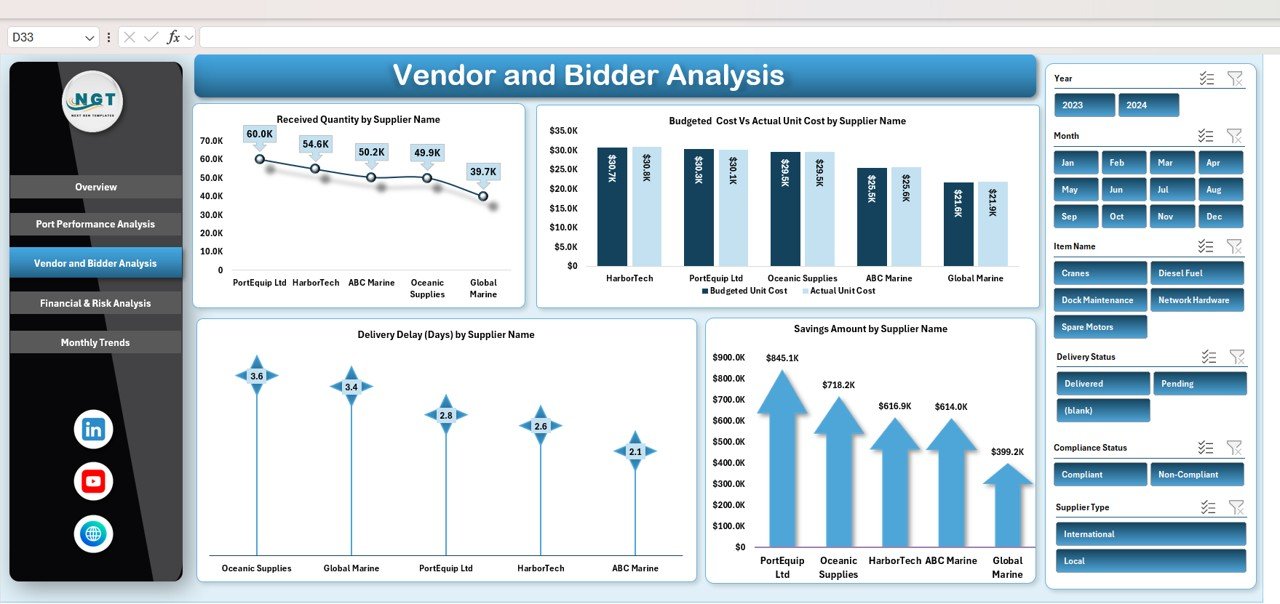
🏗️ Vendor & Supplier Performance Analysis
Supplier performance directly affects cost, delivery timelines, and operational continuity.
Charts Included
-
Received Quantity by Supplier Name
-
Budgeted Cost vs Actual Unit Cost by Supplier Name
-
Savings Amount by Supplier Name
-
Delivery Delay (Days) by Supplier Name
These insights support better vendor selection, contract renegotiation, and risk reduction.
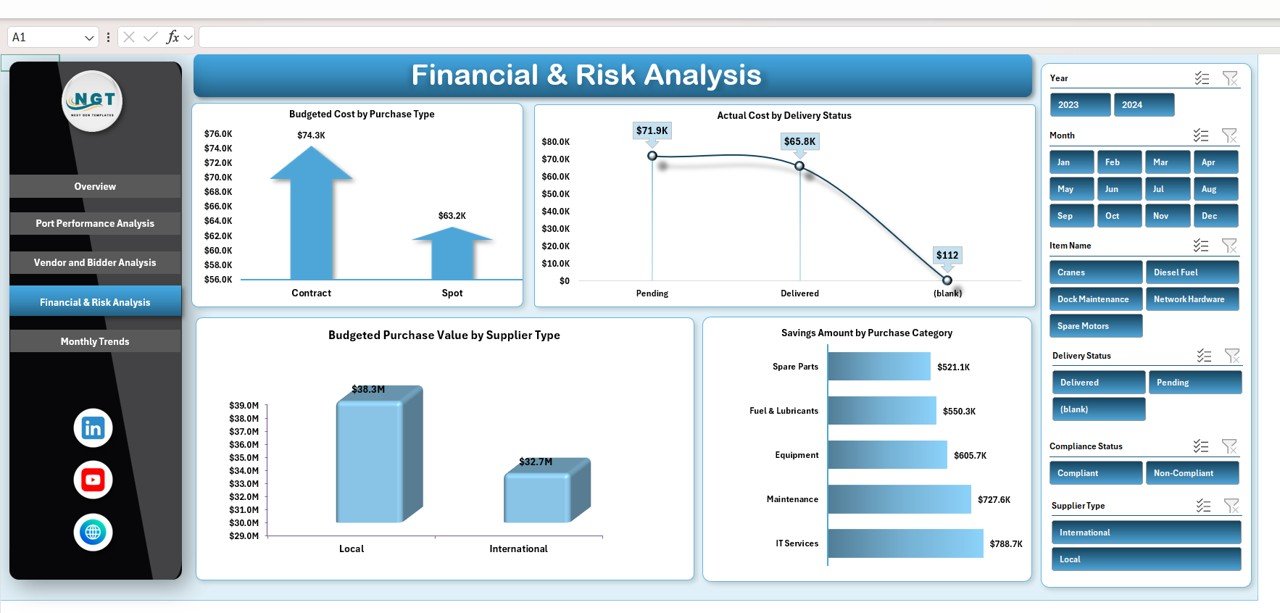
💰 Financial & Risk Analysis
This section focuses on procurement exposure and financial risk.
Charts Included
-
Budgeted Cost by Purchase Type
-
Actual Cost by Delivery Status
-
Savings Amount by Purchase Category
-
Budgeted Purchase Value by Supplier Type
It helps procurement and finance teams optimize sourcing strategies and reduce risk.
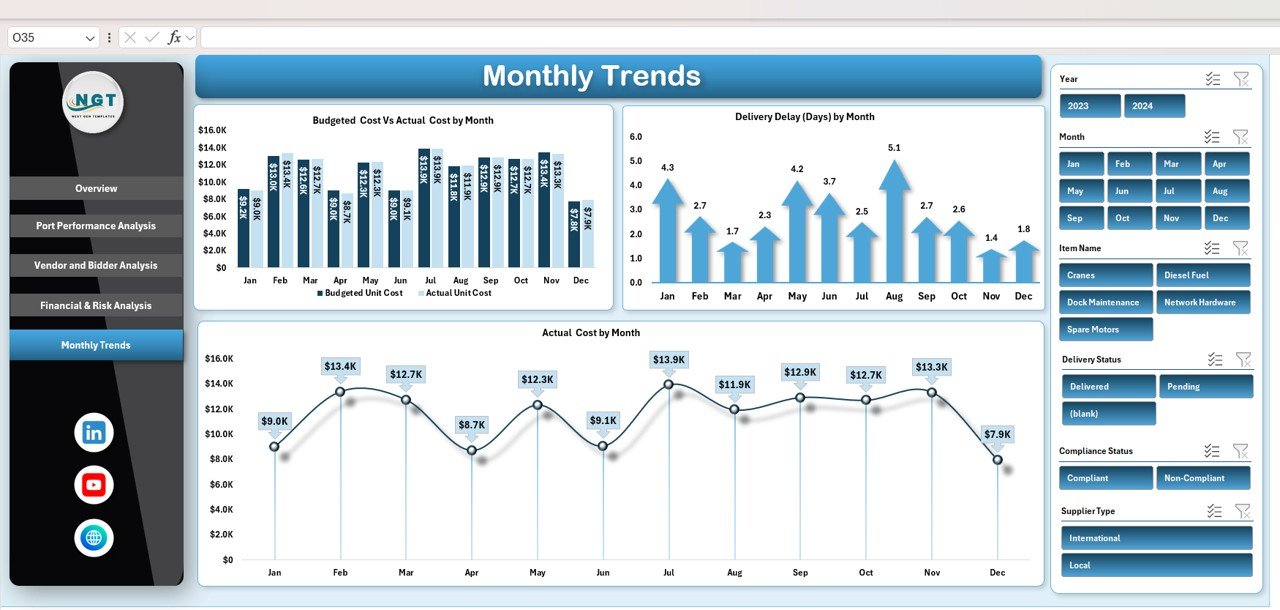
📅 Monthly Trends Analysis
Procurement performance changes over time, and trends matter.
Charts Included
-
Budgeted Cost vs Actual Cost by Month
-
Delivery Delay (Days) by Month
-
Actual Cost by Month
These trends support forecasting, budgeting, and seasonal planning.
🎯 Who Can Benefit from This Port Purchasing Dashboard in Excel
-
⚓ Port Authorities – Improve procurement governance
-
📦 Procurement Managers – Control cost and delivery timelines
-
💼 Finance Teams – Monitor spend and savings
-
🚚 Supply Chain Analysts – Identify bottlenecks
-
🏗️ Operations Managers – Reduce disruption from delays
### Click here to read the Detailed blog post
Watch the step-by-step video tutorial:


Reviews
There are no reviews yet.