Procurement plays a critical role in port operations. From equipment and spare parts to services and infrastructure materials, every procurement decision directly affects cost control, operational efficiency, and delivery timelines. Because ports manage high purchase volumes, multiple vendors, and strict delivery schedules, even small procurement inefficiencies can lead to cost overruns and operational disruption. However, many port authorities and logistics teams still rely on scattered spreadsheets and manual reports. As a result, visibility drops and corrective action often comes too late.
That is exactly why the Port Procurement Dashboard in Excel becomes an essential solution.
This ready-to-use Excel dashboard converts raw procurement data into clear, visual, and actionable insights. Instead of manually consolidating reports, procurement teams gain a centralized view of planned cost, actual cost, delivery performance, vendor efficiency, and risk indicators—all in one Excel file. Because it is built in Excel, the dashboard is easy to deploy, highly flexible, and familiar to users across procurement, finance, and operations.
✨ Key Features of the Port Procurement Dashboard in Excel
📊 Centralized Procurement Monitoring
Track all procurement KPIs from a single dashboard without switching between multiple files.
💰 Planned vs Actual Cost Control
Monitor cost variance in real time to prevent overspending and improve budget accuracy.
🚚 Delivery Performance Tracking
Analyze completed, in-progress, and delayed deliveries to reduce operational disruption.
🏷️ Vendor Performance Insights
Evaluate suppliers based on cost efficiency, delivery completion, and reliability.
🧩 Fully Customizable Excel Model
Easily add new ports, vendors, categories, or metrics based on your procurement needs.
📦 What’s Inside the Port Procurement Dashboard in Excel
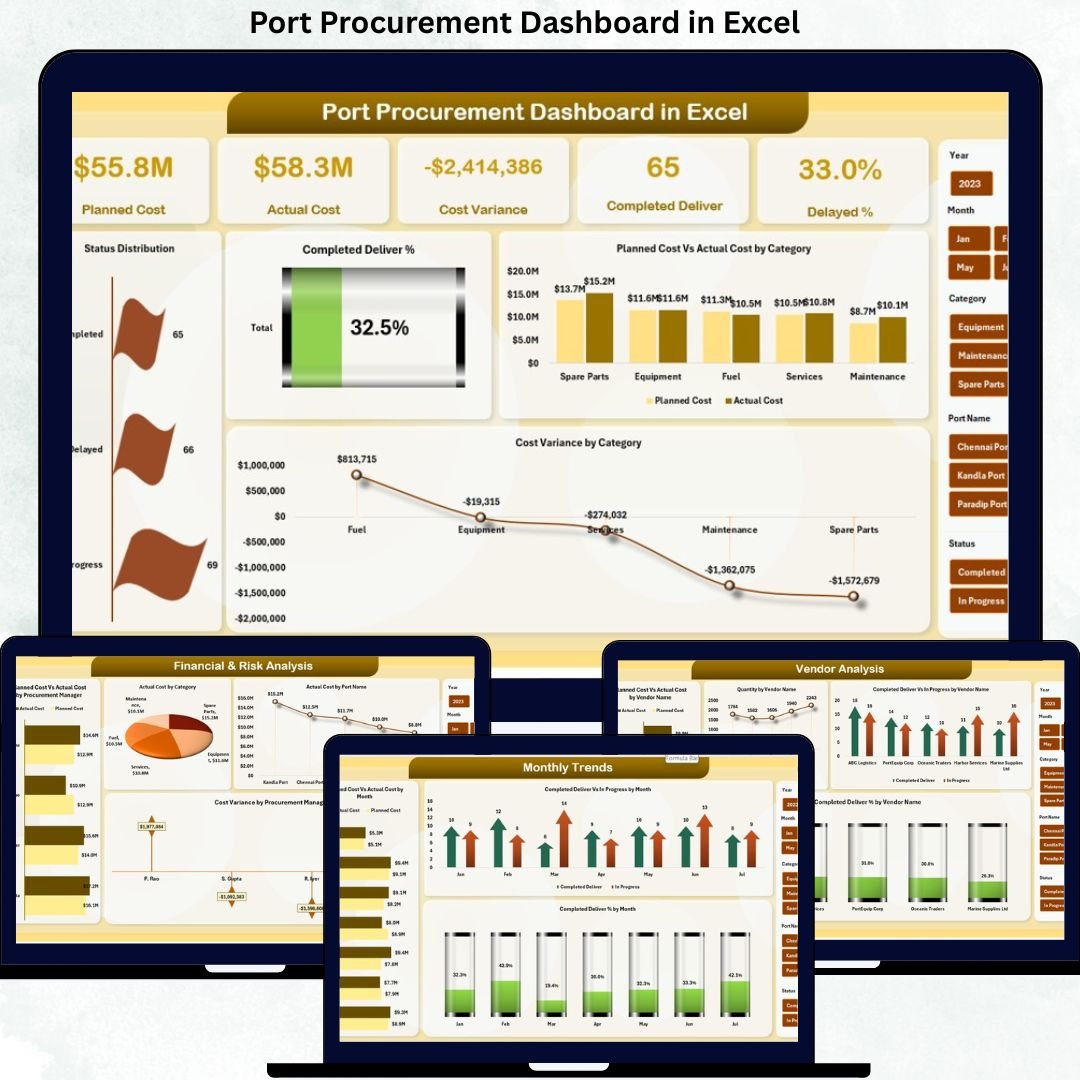
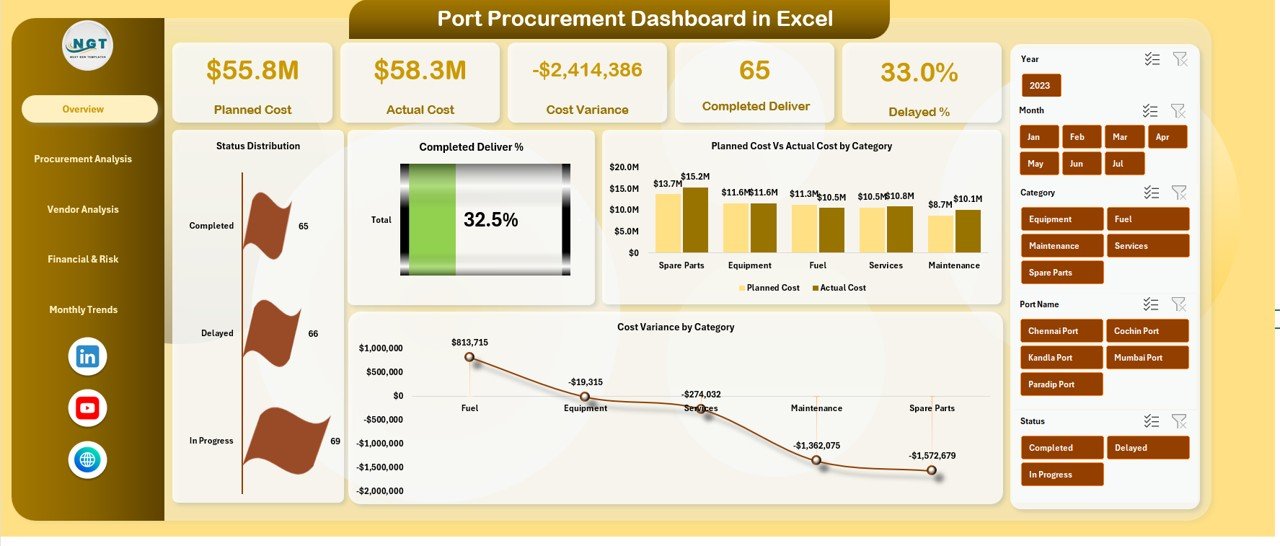
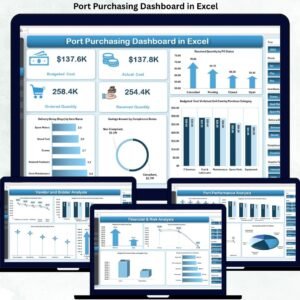
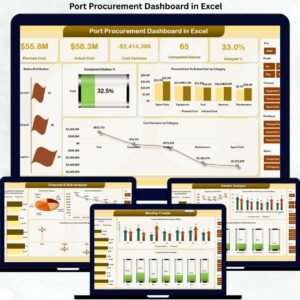
🖥️ Overview Sheet Tab – Procurement Control Panel
The Overview Sheet acts as the main command center of the dashboard and provides instant visibility into procurement health.
Key KPI Cards
-
Planned Cost – Total estimated procurement spend
-
Actual Cost – Actual spend incurred
-
Cost Variance – Difference between planned and actual cost
-
Completed Deliver % – Delivery completion rate
-
Delayed % – Percentage of delayed procurements
These KPIs immediately highlight financial and delivery risks.
Overview Charts
-
Status Distribution – Completed, In Progress, Delayed
-
Completed Deliver % – Overall delivery performance
-
Planned Cost vs Actual Cost by Category – Cost accuracy by category
-
Cost Variance by Category – Identifies overspending areas
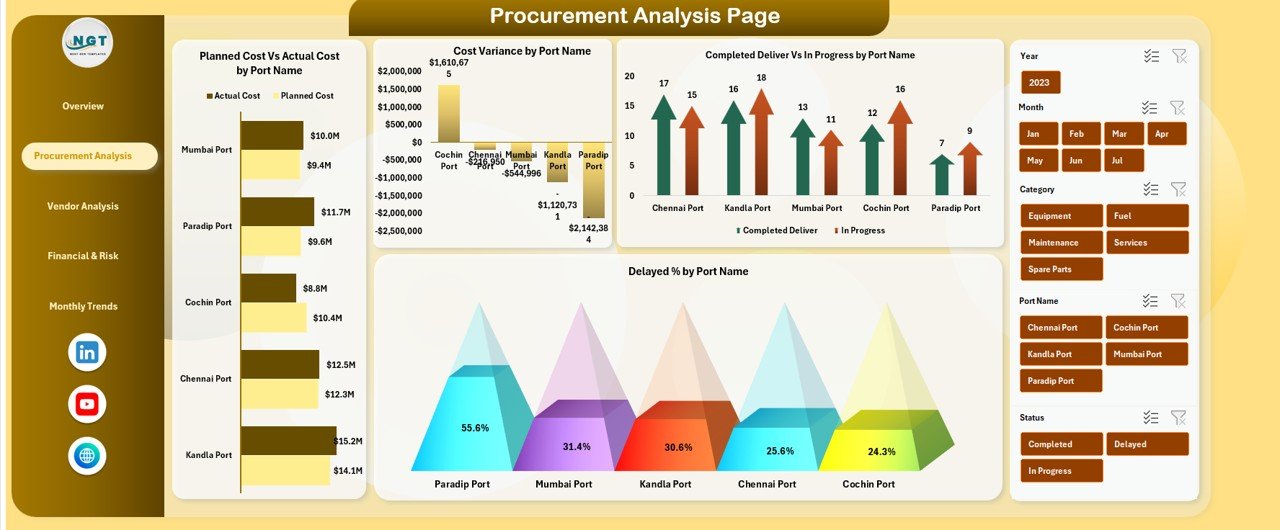
⚓ Port Performance Analysis
This section compares procurement efficiency across different ports.
Charts Included
-
Planned Cost vs Actual Cost by Port Name
-
Cost Variance by Port Name
-
Completed Deliver vs In Progress by Port Name
-
Delayed % by Port Name
This analysis helps management benchmark ports, identify bottlenecks, and improve coordination.
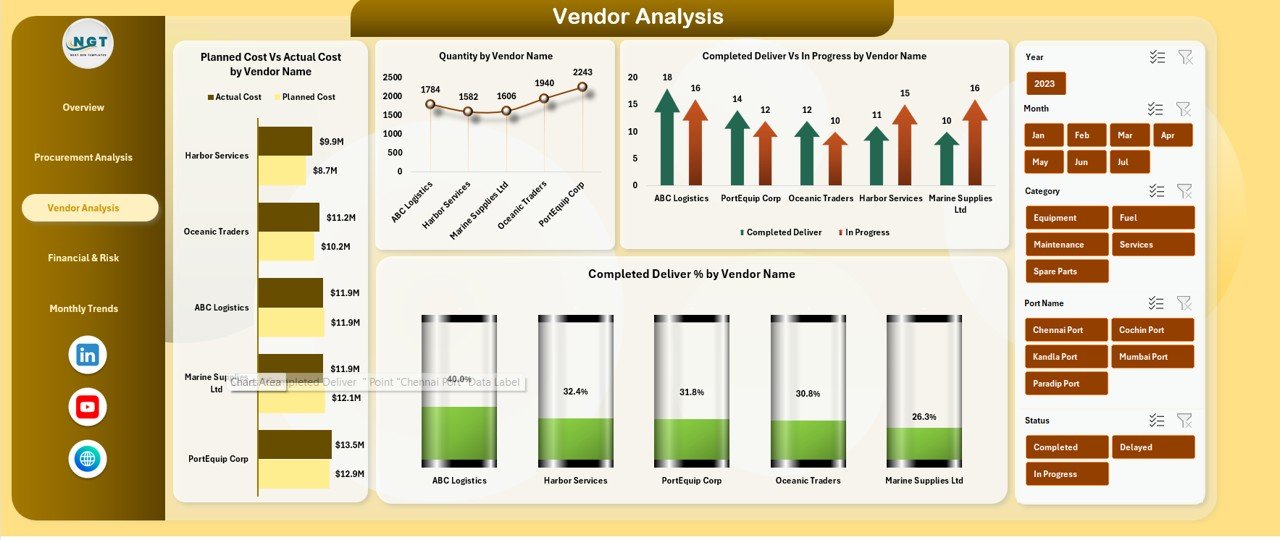
🏗️ Vendor & Bidder Analysis
Vendor performance has a direct impact on cost, delivery, and reliability.
Charts Included
-
Planned Cost vs Actual Cost by Vendor Name
-
Quantity by Vendor Name
-
Completed Deliver vs In Progress by Vendor
-
Completed Deliver % by Vendor Name
These insights support better supplier selection, contract renegotiation, and accountability.
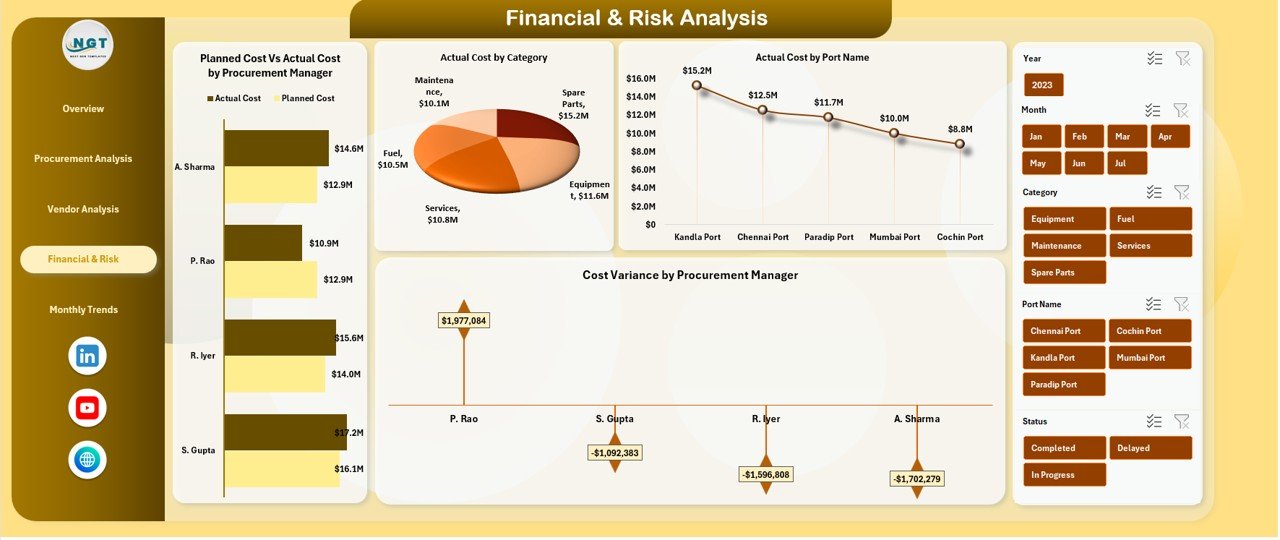
💰 Financial & Risk Analysis
This section highlights financial exposure and internal procurement risk.
Charts Included
-
Planned Cost vs Actual Cost by Procurement Manager
-
Actual Cost by Category
-
Actual Cost by Port Name
-
Cost Variance by Procurement Manager
It enables leadership to monitor procurement discipline and reduce financial leakage.
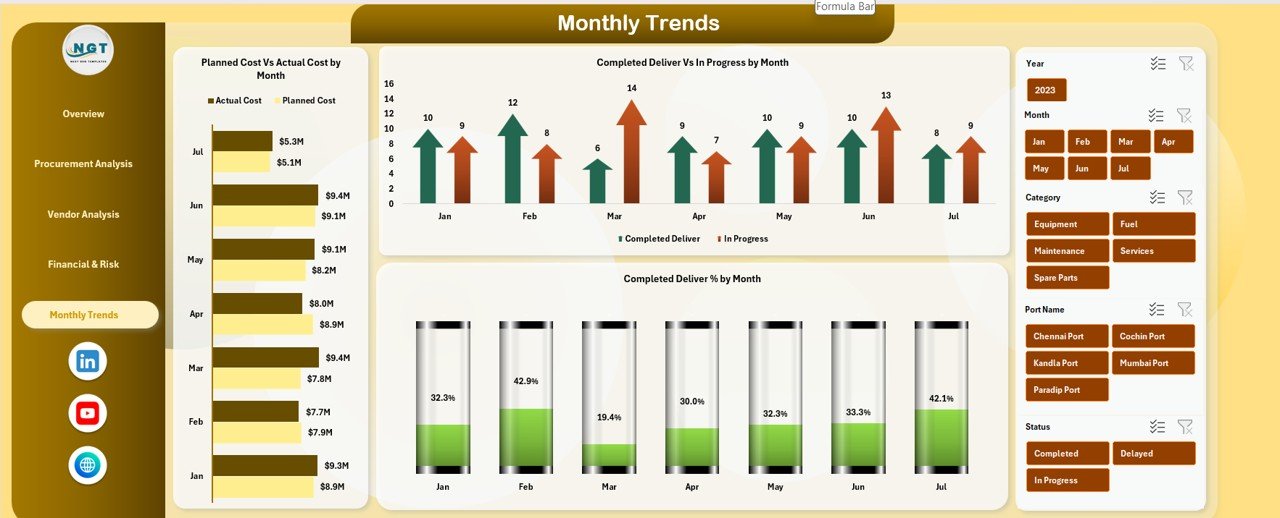
📅 Monthly Trends Analysis
Understanding trends over time is essential for continuous improvement.
Charts Included
-
Planned Cost vs Actual Cost by Month
-
Completed Deliver vs In Progress by Month
-
Completed Deliver % by Month
These trends help teams forecast demand, improve planning, and reduce recurring delays.
🎯 Who Can Benefit from This Port Procurement Dashboard in Excel
-
⚓ Port Authorities – Improve procurement transparency
-
📦 Procurement Managers – Control cost and delivery timelines
-
💼 Finance Teams – Monitor spend and variance
-
🚚 Supply Chain Teams – Identify fulfillment bottlenecks
-
🛡️ Risk & Compliance Teams – Strengthen procurement governance


Reviews
There are no reviews yet.