Modern ports handle thousands of vessel movements, cargo shipments, and logistics activities every day. Therefore, port authorities and logistics managers must constantly monitor operational performance, safety metrics, fuel consumption, and cargo handling efficiency. However, when operational data is scattered across spreadsheets and reports, it becomes difficult to analyze performance quickly.
That is where the Port Operations Dashboard in Power BI becomes a powerful operational intelligence solution.
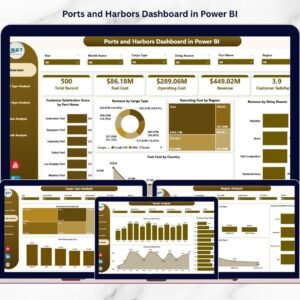
This ready-to-use Power BI dashboard transforms raw port operational data into clear, interactive, and real-time insights. Instead of reviewing multiple reports manually, decision-makers can monitor vessel operations, cargo handling activities, fuel usage, delays, and safety incidents from a single centralized dashboard.
Because Power BI provides interactive charts, KPI indicators, and filters, port managers can analyze operational performance instantly and make faster data-driven decisions.
If you want better operational visibility, improved efficiency, and smarter logistics planning, this dashboard offers the perfect solution.
🚢 Key Feature of Port Operations Dashboard in Power BI
This powerful Power BI solution includes five analytical pages, each designed to monitor port performance from a different operational perspective.
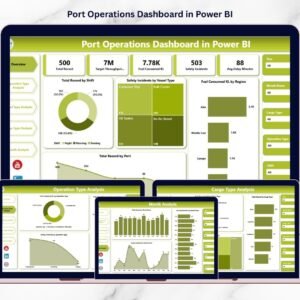
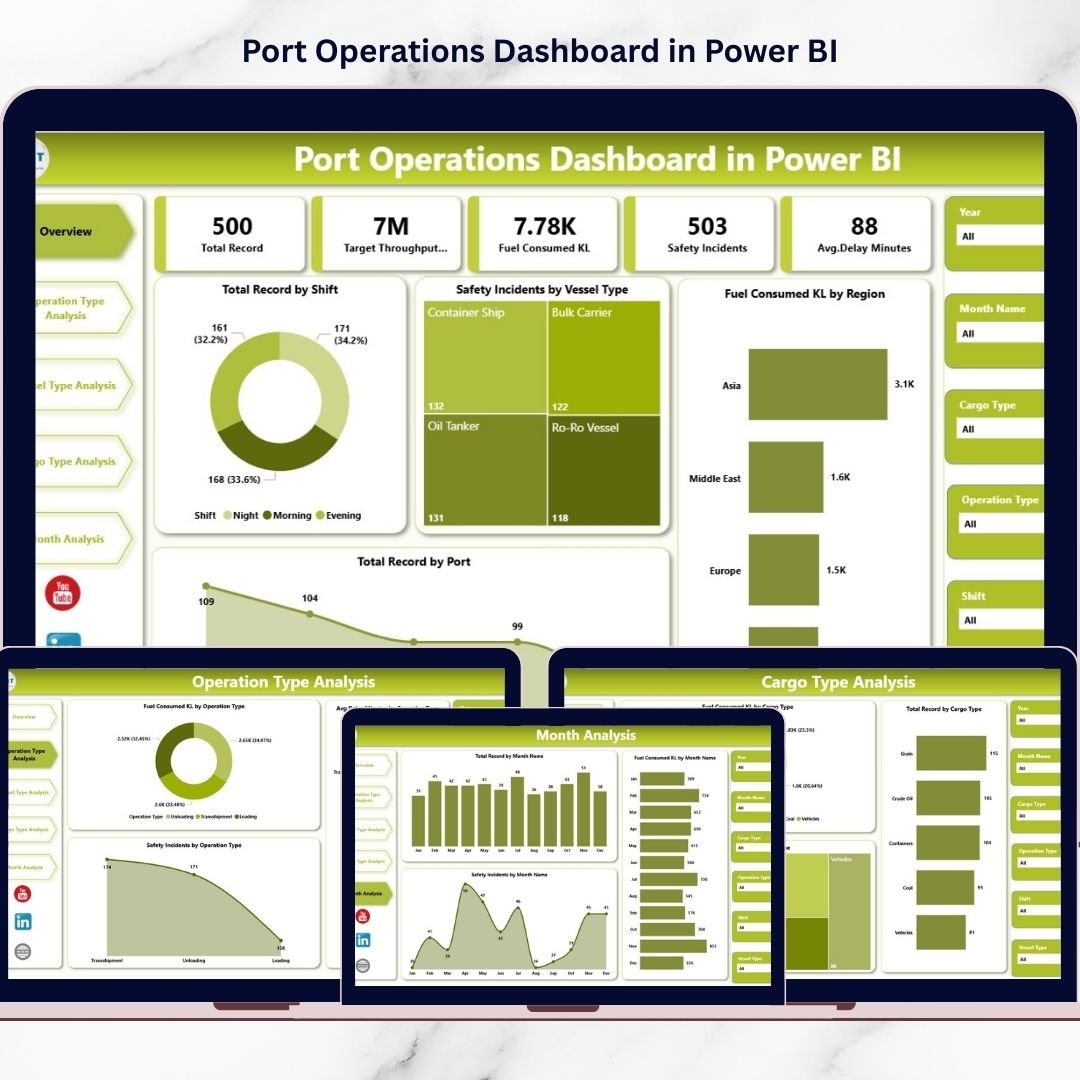
📊 Overview Dashboard Page – Provides a quick summary of overall port performance through KPI cards and visual charts.
🎯 Interactive Slicers & Filters – Analyze data dynamically by shift, vessel type, cargo type, region, and month.
⛽ Fuel Consumption Monitoring – Track fuel usage across regions, operations, and vessel types.
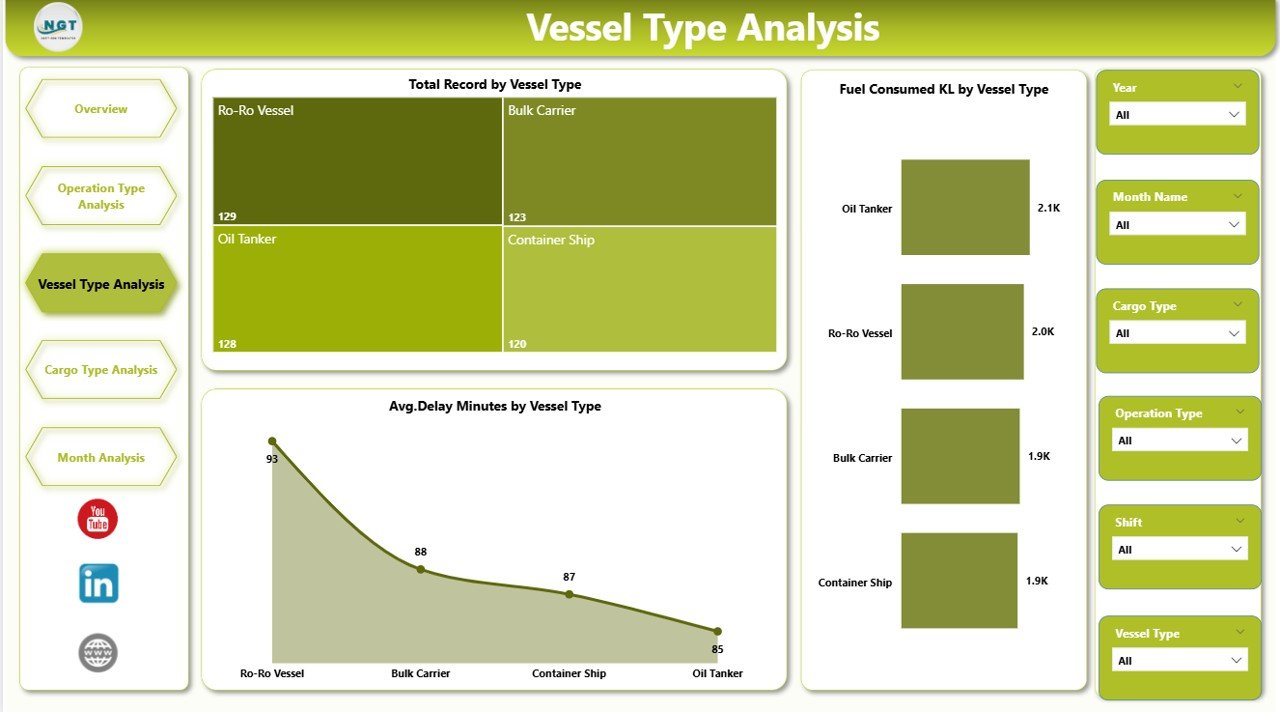
🚢 Vessel Performance Analysis – Monitor operational activity and delays by vessel category.
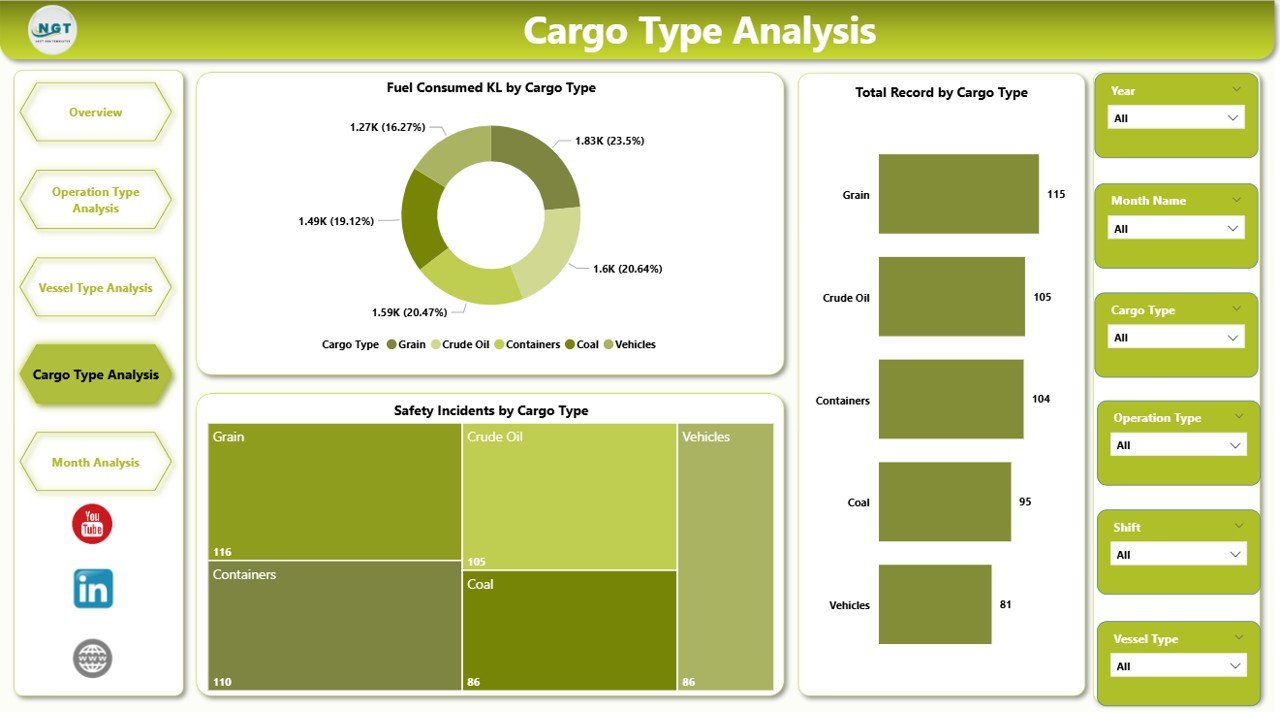
📦 Cargo Handling Insights – Analyze operational efficiency across different cargo types.
⏱ Operational Delay Monitoring – Identify delay patterns across operations and vessel movements.
📊 Safety Incident Tracking – Monitor safety incidents across cargo operations and vessel types.
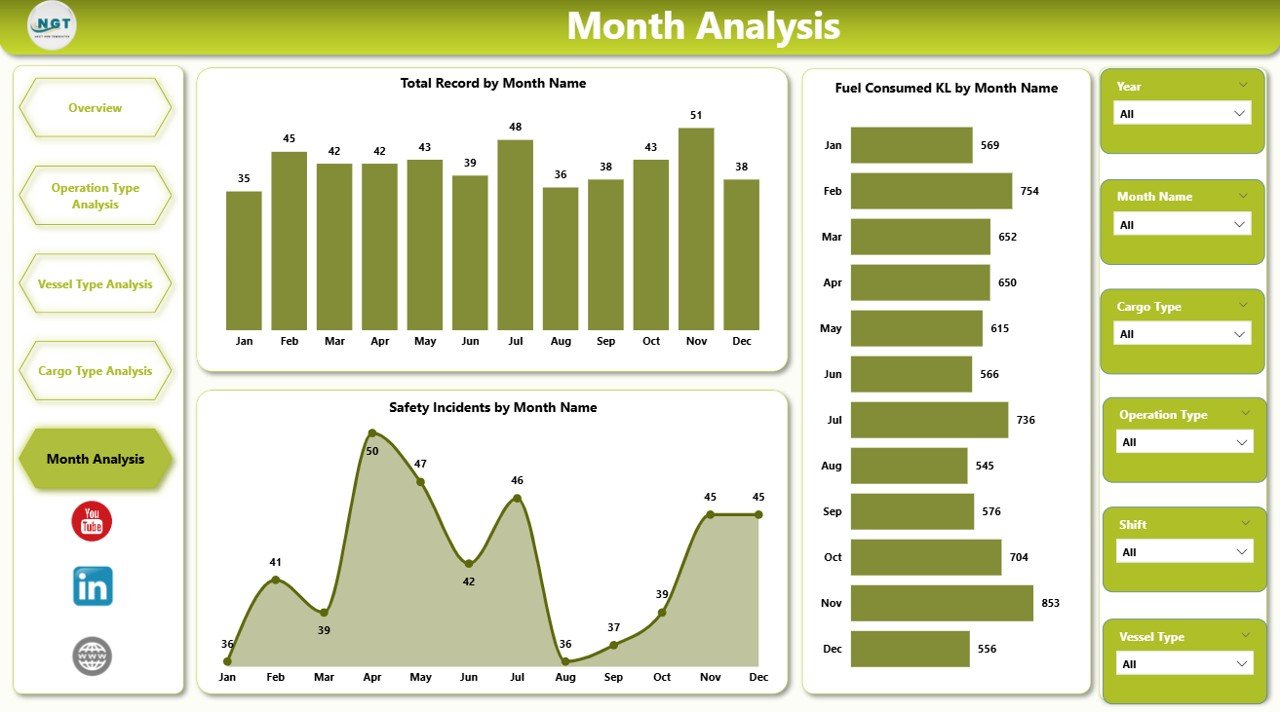
📅 Monthly Trend Analysis – Evaluate seasonal patterns and operational performance trends.
Because Power BI updates visuals dynamically, users can filter data instantly and analyze operational performance in seconds.
📦 What’s Inside the Port Operations Dashboard in Power BI
The dashboard is built using a structured data model that supports scalable and flexible analytics.
Inside the solution, you get:
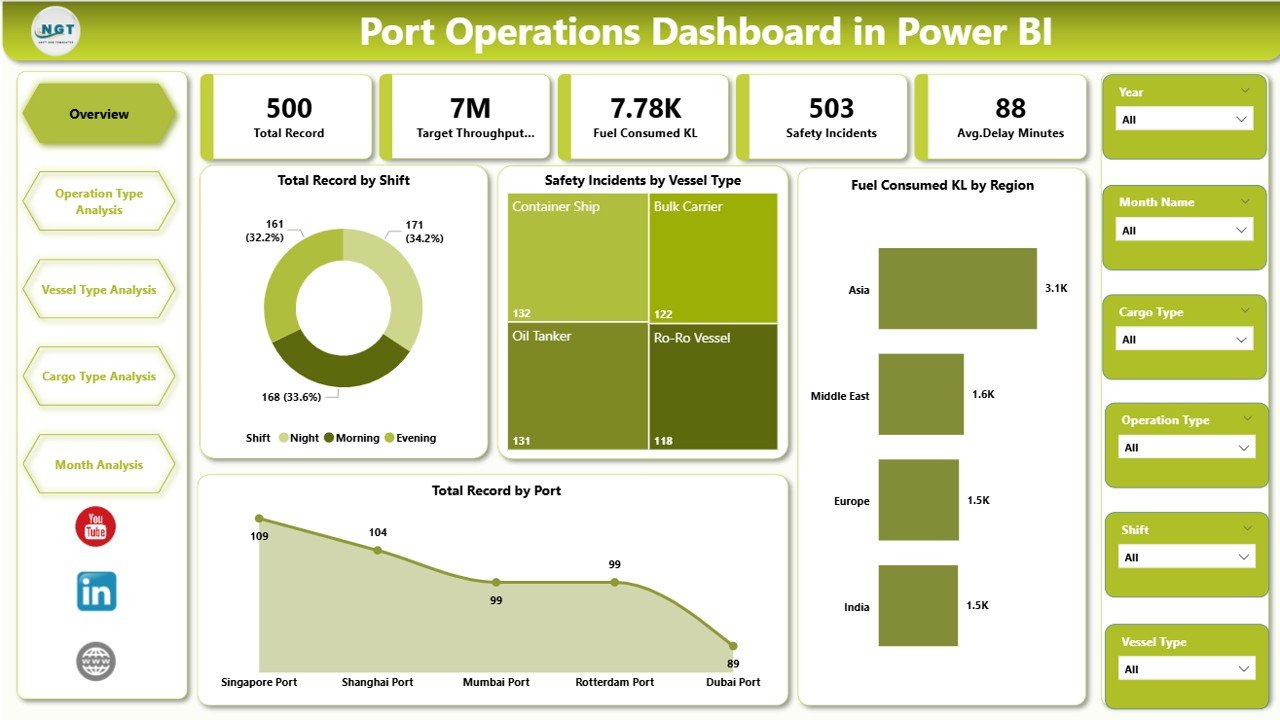
✅ Overview Page – Central operational performance dashboard
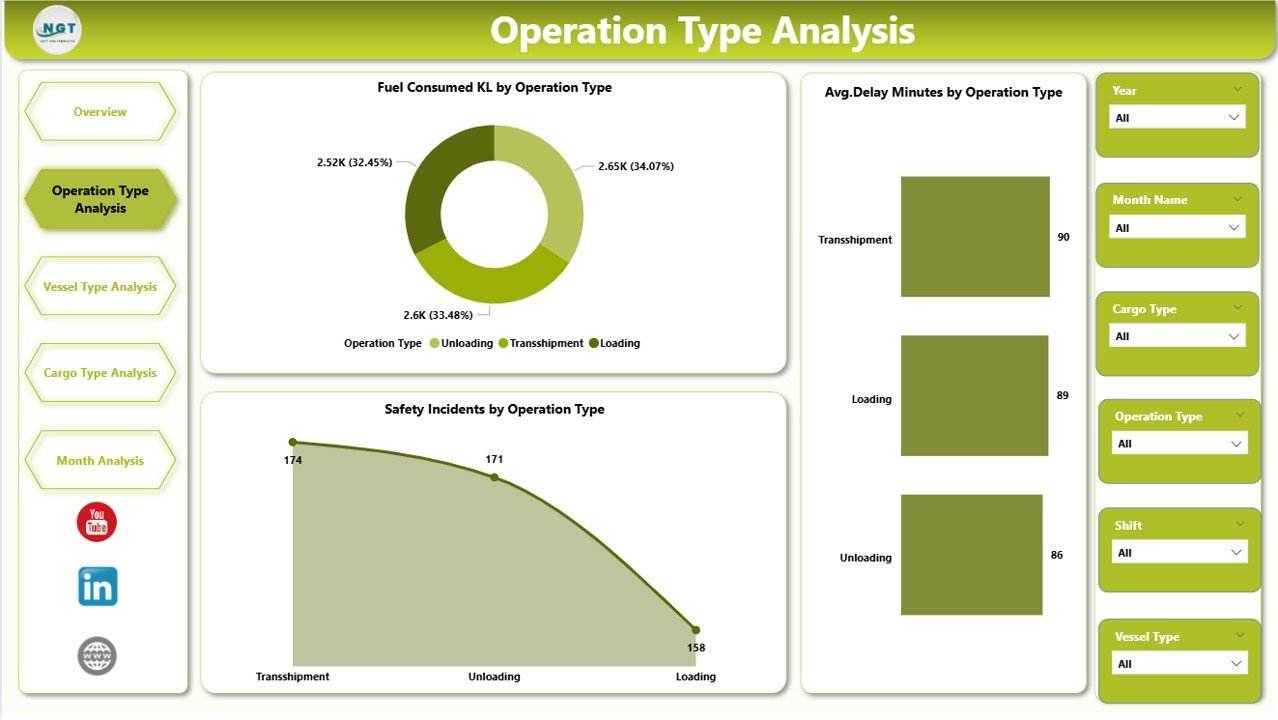
✅ Operation Type Analysis Page – Operational efficiency insights by activity type
✅ Vessel Type Analysis Page – Vessel movement and performance monitoring
✅ Cargo Type Analysis Page – Cargo handling and safety analysis
✅ Month Analysis Page – Time-based operational trends
✅ Interactive Filters and Slicers – Dynamic data exploration
✅ Automated KPI indicators – Clear performance measurement visuals
The dashboard typically uses operational datasets including:
Shift
Operation Type
Vessel Type
Cargo Type
Port Location
Fuel Consumption
Delay Minutes
Safety Incidents
Month
Because Power BI supports multiple data sources, organizations can connect the dashboard to:
Excel files
Operational databases
Port management systems
Cloud data platforms
This flexibility makes the dashboard suitable for both small ports and large international logistics hubs.
⚙️ How to Use the Port Operations Dashboard in Power BI
Using this dashboard is straightforward.
1️⃣ Import operational data into Power BI from Excel or another data source.
2️⃣ Ensure the dataset includes operational metrics such as vessel type, cargo type, fuel usage, and delays.
3️⃣ Refresh the dashboard to update visuals.
4️⃣ Use slicers to filter data by vessel type, cargo type, region, or month.
5️⃣ Analyze KPI trends and operational performance insights.
Within seconds, the dashboard provides a complete overview of port operations.
No advanced Power BI expertise is required to use the dashboard.
👥 Who Can Benefit from This Port Operations Dashboard in Power BI
This dashboard is designed for professionals involved in maritime logistics and port management.
It is especially useful for:
🚢 Port Authorities
📦 Cargo Operations Managers
⚓ Maritime Logistics Companies
🚚 Shipping and Freight Companies
📊 Supply Chain Analysts
📈 Operations Strategy Teams
Because the dashboard simplifies complex operational data, both operational teams and senior executives can easily analyze performance insights.
💡 Why This Dashboard Improves Port Performance
✔ Centralized monitoring of port operations
✔ Faster identification of operational delays
✔ Improved vessel traffic management
✔ Better cargo handling performance analysis
✔ Enhanced safety monitoring
✔ Fuel consumption optimization
✔ Real-time operational insights
✔ Data-driven logistics planning
Instead of spending hours analyzing manual reports, port managers gain instant insights into operational performance.
This dashboard transforms port operational data into actionable intelligence that supports smarter maritime operations.
### Click here to read the Detailed blog post
Visit our YouTube channel to learn step-by-step video tutorials
Youtube.com/@PKAnExcelExpert