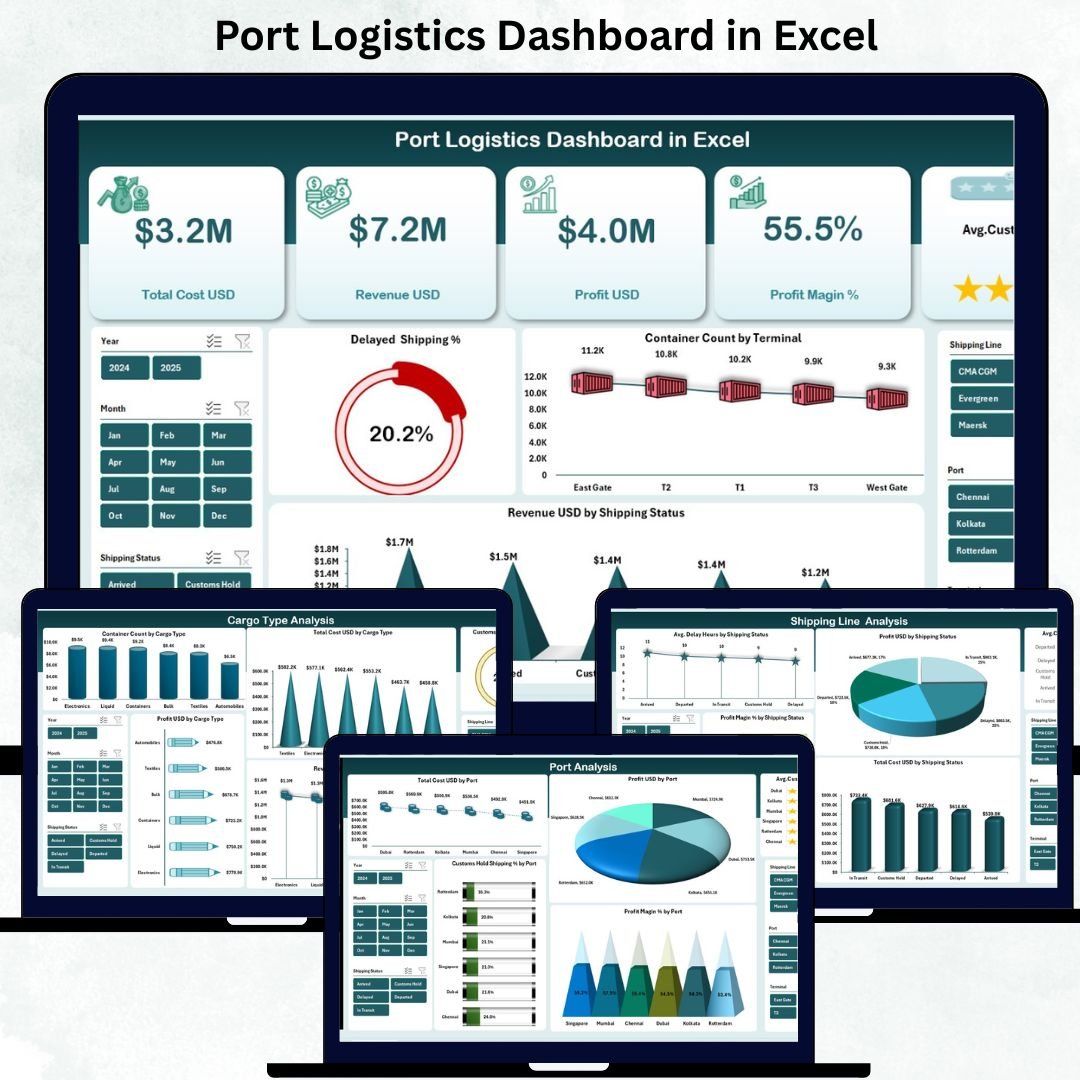
Port logistics is the backbone of global trade. Every day, ports manage thousands of containers, vessels, cargo movements, shipping lines, terminals, and customer interactions. Port Logistics Dashboard in Excel At the same time, teams must control costs, reduce delays, protect profit margins, and maintain service quality. Port Logistics Dashboard in Excel However, when logistics data is spread across multiple spreadsheets, gaining a clear operational picture becomes difficult and time-consuming.
The Port Logistics Dashboard in Excel solves this problem by transforming raw port and shipping data into clear, visual, and actionable insights. This ready-to-use Excel dashboard consolidates cost, revenue, profit, delays, cargo performance, shipping line efficiency, and customer satisfaction into one structured file. As a result, port authorities, logistics managers, and operations teams can monitor performance confidently and respond faster to issues.
Built entirely in Excel, this dashboard fits seamlessly into existing workflows and requires no complex software or technical training.
🚀 Key Features of the Port Logistics Dashboard in Excel
📊 All-in-One Port Performance Dashboard – Track logistics KPIs in one central file
⚓ Multi-Port Analysis – Compare cost, profit, delays, and ratings across ports
📦 Cargo Type Insights – Analyze performance by cargo category
🚢 Shipping Line Performance Tracking – Identify efficient and delayed shipping statuses
📅 Monthly Trend Analysis – Monitor seasonality and long-term changes
🎯 Profit & Margin Visibility – Track revenue, cost, profit, and margin clearly
📊 Customer Experience Monitoring – Measure average customer ratings
🧭 Page Navigator for Easy Navigation – Move between pages instantly
📦 What’s Inside the Port Logistics Dashboard
This Excel-based dashboard includes five structured analytical pages designed for end-to-end port logistics analysis:
🟢 Overview Page
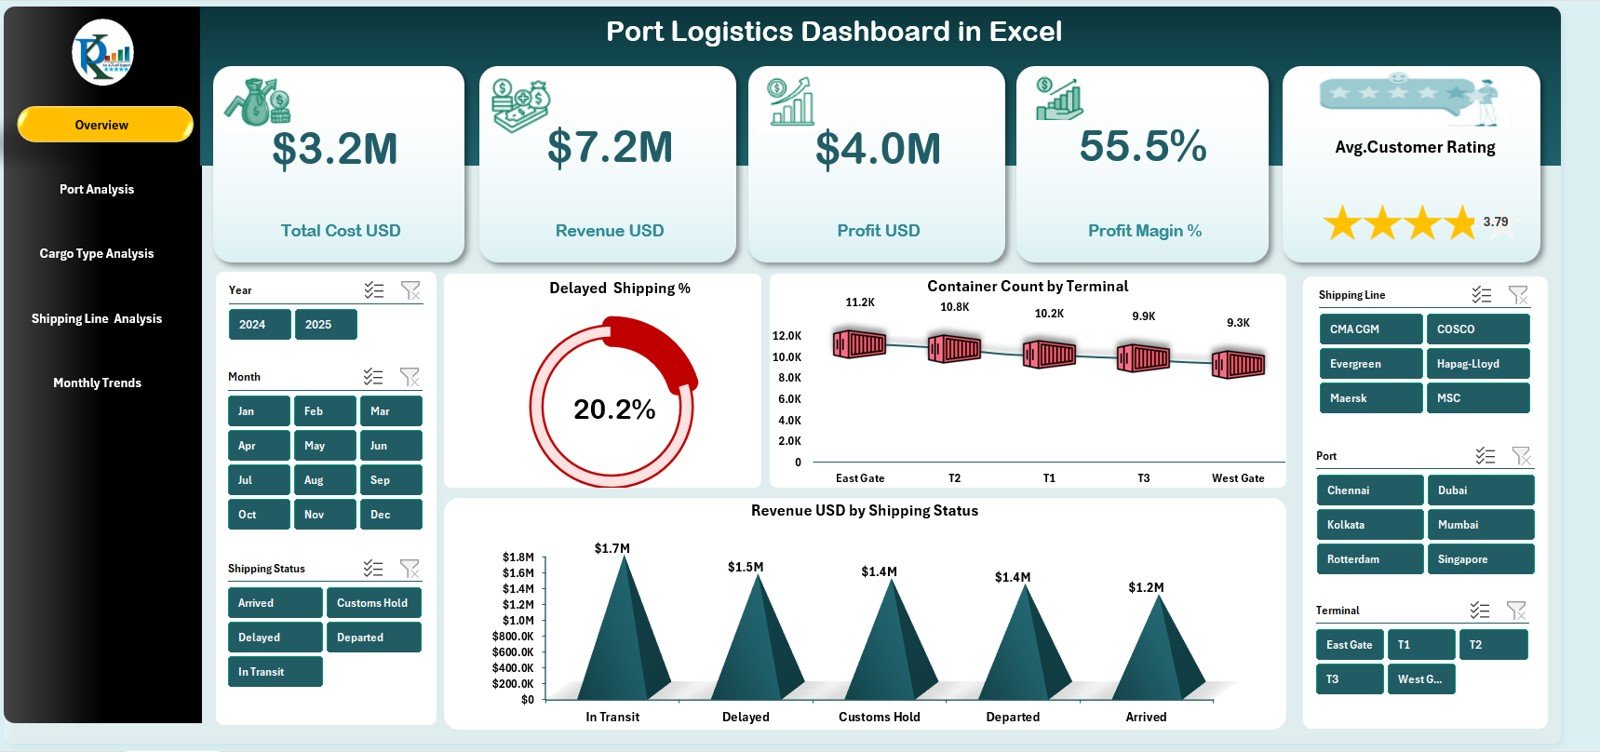
Provides a complete snapshot of port operations with KPI cards for Total Cost, Revenue, Profit, Profit Margin, and Average Customer Rating. Charts highlight delayed shipping percentage, container volume by terminal, and revenue by shipping status.
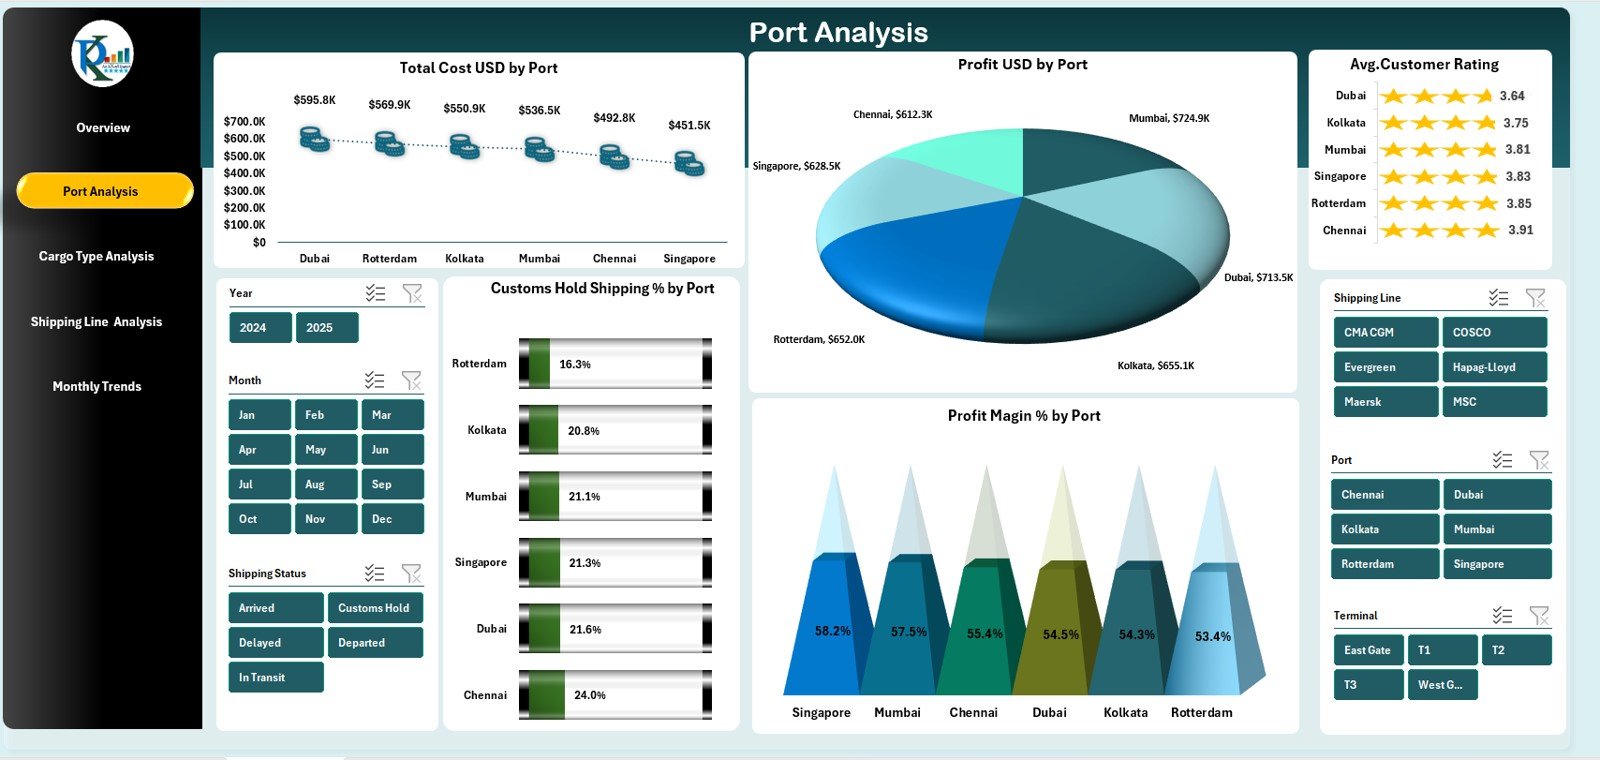
⚓ Port Analysis Page
Compares performance across ports using cost, profit, profit margin, customer ratings, and customer hold shipping percentages. This page helps identify high-performing and underperforming ports.
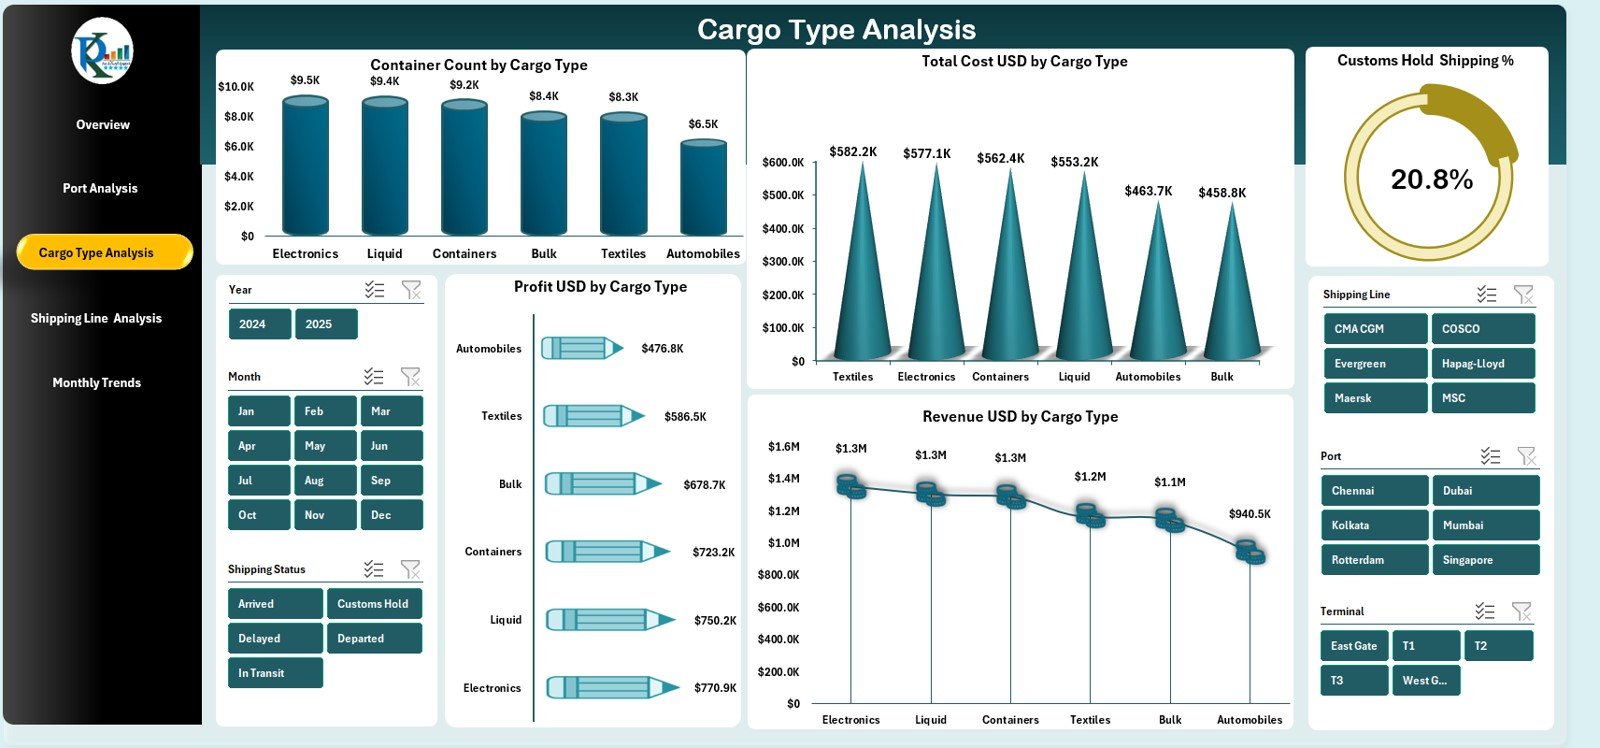
📦 Cargo Type Analysis Page
Shows container count, cost, revenue, profit, and customs hold percentages by cargo type. This insight helps optimize cargo handling and improve profitability.
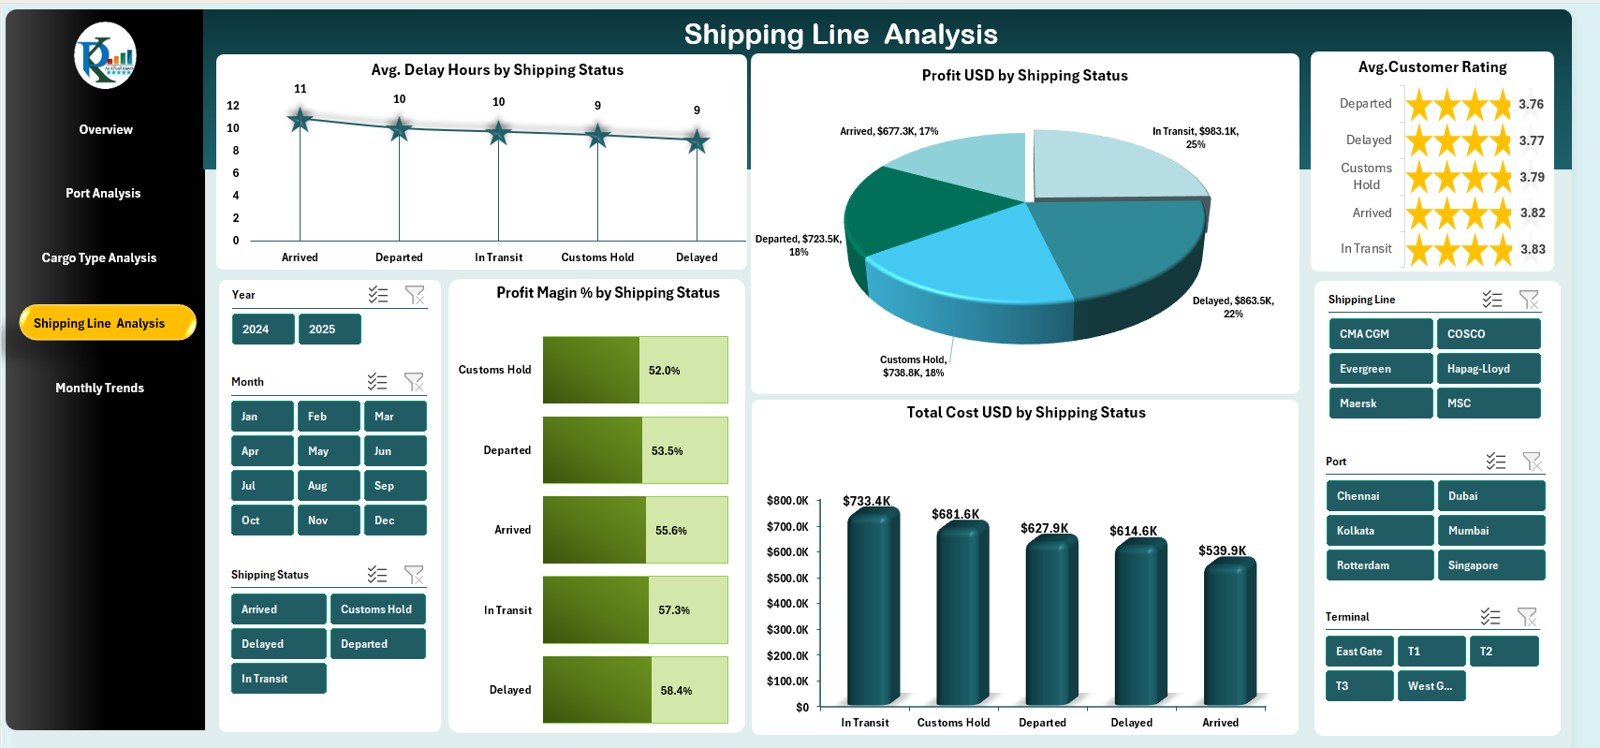
🚢 Shipping Line Analysis Page
Evaluates shipping performance using delay hours, cost, profit margin, customer ratings, and profit by shipping status. This page supports better coordination with shipping partners.
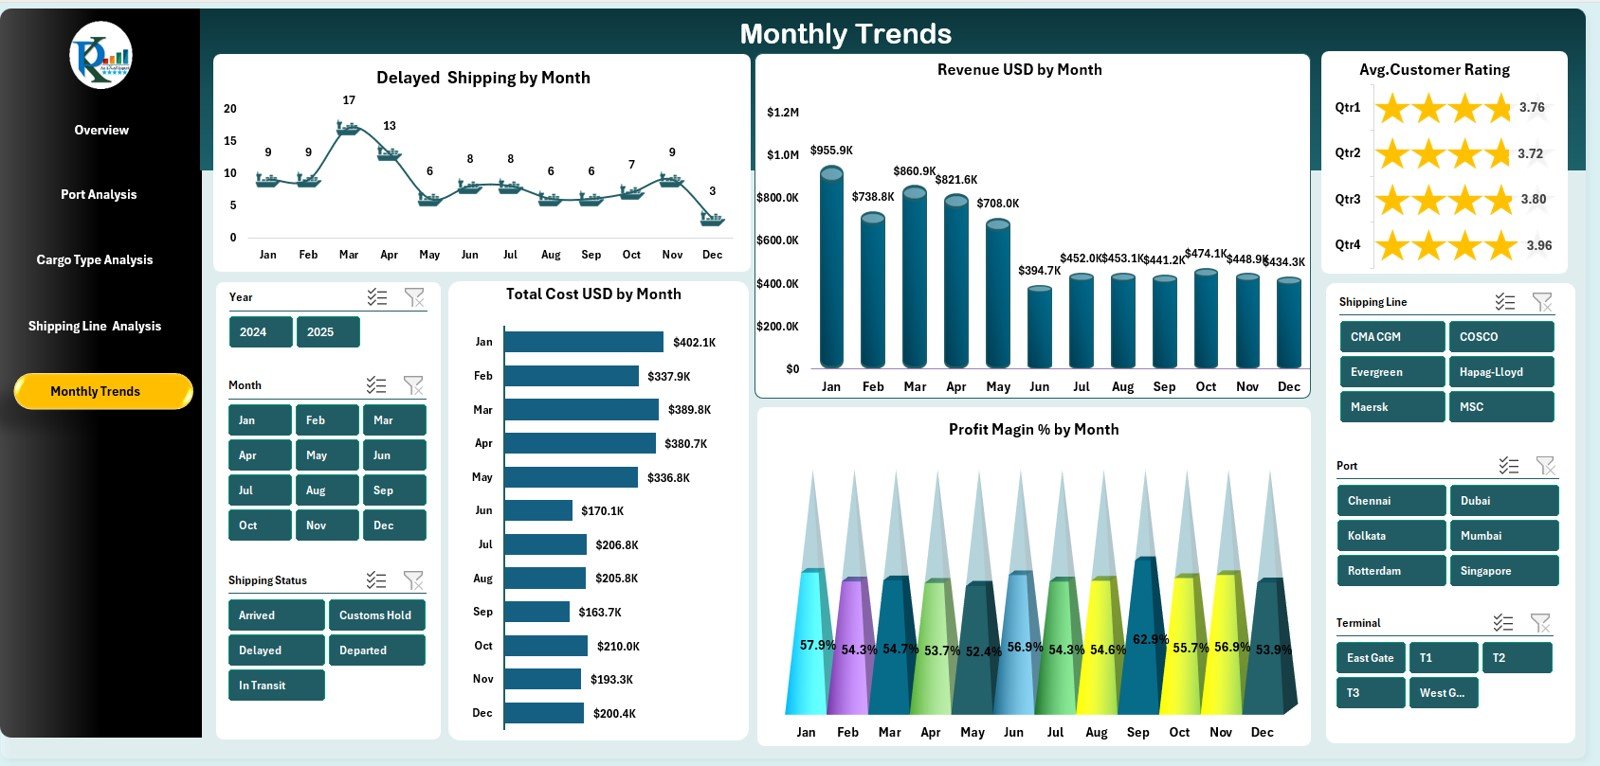
📆 Monthly Trends Page
Tracks delayed shipping, revenue, cost, profit margin, and customer ratings month-wise. This page supports forecasting, capacity planning, and budget control.
All visuals are powered by a structured data sheet, ensuring automatic updates and consistency.
🛠️ How to Use the Port Logistics Dashboard
✅ Step 1: Enter or update logistics data in the Data Sheet
✅ Step 2: Open the dashboard pages
✅ Step 3: Apply slicers for date, port, shipping line, or cargo type
✅ Step 4: Review KPIs, charts, and trends
✅ Step 5: Share insights with stakeholders
No advanced Excel knowledge is required. The dashboard is ready to use, easy to maintain, and simple to customize.
👥 Who Can Benefit from This Port Logistics Dashboard?
⚓ Port Authorities
🚚 Logistics & Supply Chain Managers
🚢 Shipping Coordinators
🏗️ Operations Managers
📊 Maritime & Logistics Analysts
💼 Finance and Reporting Teams
Any organization involved in port operations or maritime logistics will gain immediate value from this dashboard.
🔗 Click here to read the Detailed blog post
🎥 Visit our YouTube channel to learn step-by-step video tutorials


Reviews
There are no reviews yet.