In today’s highly competitive plastics manufacturing industry, relying on manual reports and delayed Excel analysis is no longer enough. Manufacturers must continuously improve productivity, reduce waste, control costs, and maintain strict quality standards. However, without a centralized performance system, tracking these goals becomes complex and inefficient.
That is exactly why the Plastics Manufacturing KPI Dashboard in Power BI is a powerful and smart investment for modern manufacturing organizations.
This ready-to-use dashboard converts raw Excel production data into interactive Power BI visuals, helping plant managers, operations leaders, and executives gain real-time visibility into performance. Instead of chasing multiple reports, decision-makers can instantly identify gaps, monitor trends, and take corrective actions with confidence.
🚀 Key Features of Plastics Manufacturing KPI Dashboard in Power BI
📊 Centralized KPI Monitoring – Track production, quality, efficiency, and cost KPIs in one interactive Power BI report
📅 Dynamic Month & KPI Group Slicers – Instantly filter performance by month or KPI category
📈 MTD & YTD Performance Tracking – Analyze both short-term and long-term results
🎯 Target vs Actual Analysis – Quickly identify KPIs meeting or missing targets
📉 Previous Year Comparison – Compare current performance with last year trends
📌 Visual Performance Indicators – Green and red icons instantly highlight performance status
🔍 Detailed KPI Drill-Through – Understand definitions, formulas, and KPI logic clearly
📂 Excel-Based Data Source – Simple, flexible, and easy to maintain

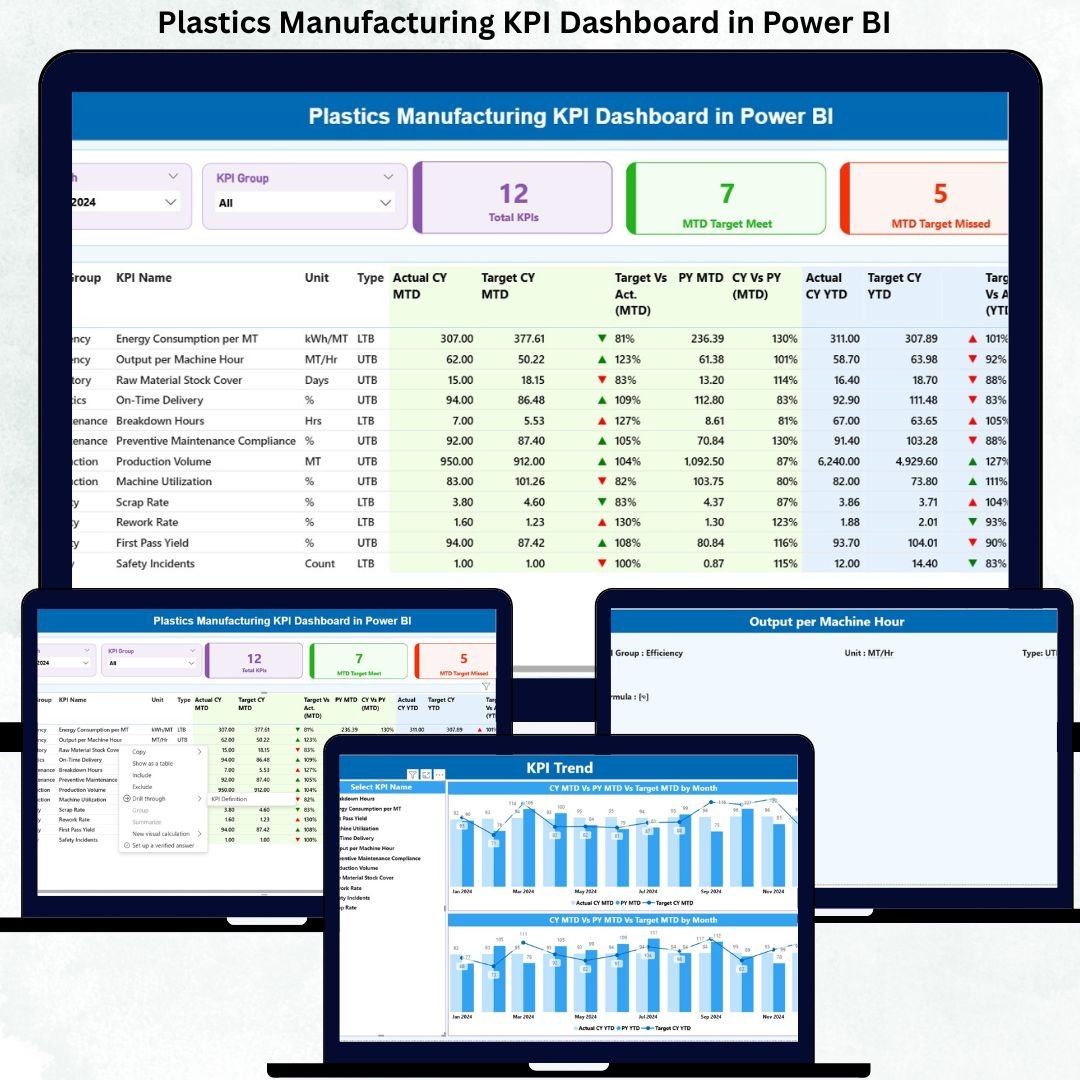
📦 What’s Inside the Plastics Manufacturing KPI Dashboard
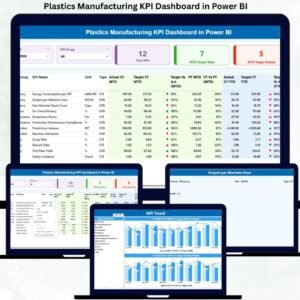
This professionally designed Power BI file includes three powerful interactive pages supported by a structured Excel data model.
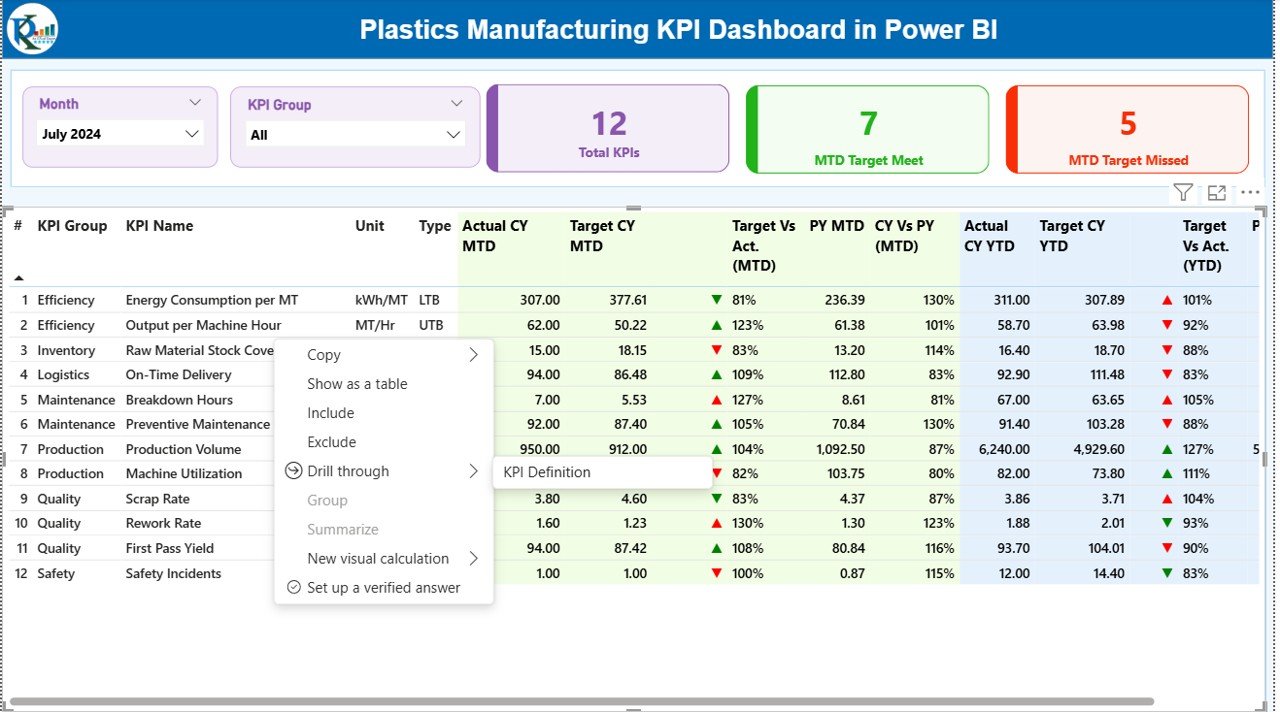
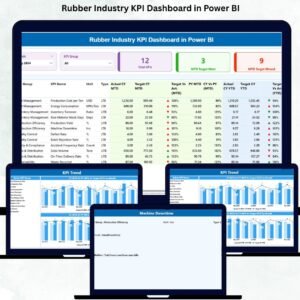
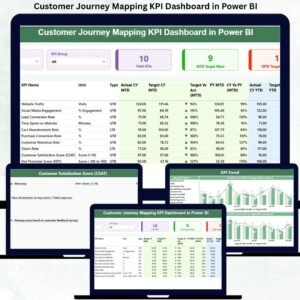
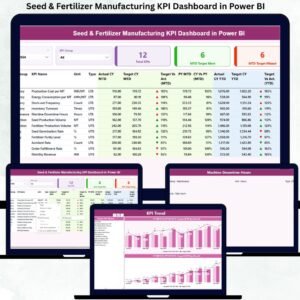
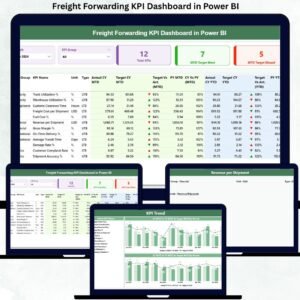
🧭 Summary Page
Acts as the command center of the dashboard. It includes:
-
Month and KPI Group slicers
-
KPI cards showing Total KPIs, MTD Target Met, and MTD Target Missed
-
A detailed KPI table displaying:
-
Actual vs Target (MTD & YTD)
-
Previous Year comparisons
-
Visual performance indicators
-
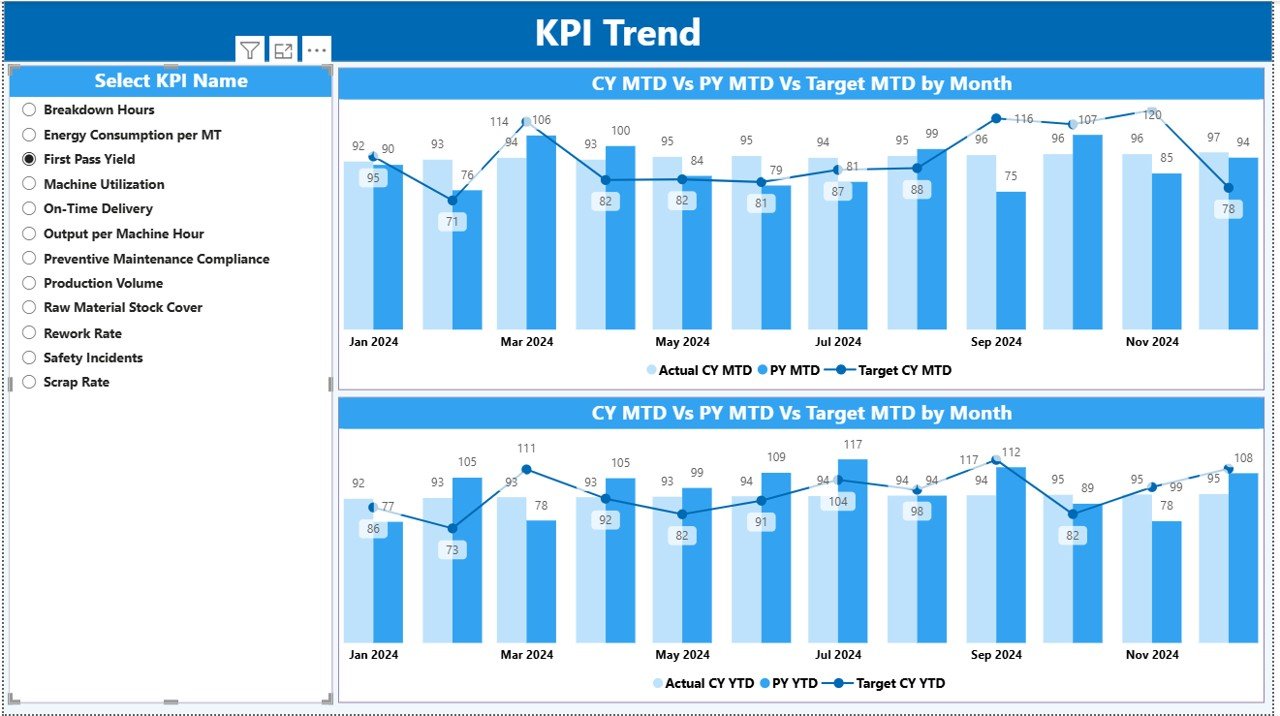
📊 KPI Trend Page
Designed for trend analysis, this page displays:
-
MTD trend combo chart (Actual, Target, PY)
-
YTD trend combo chart (Actual, Target, PY)
-
KPI Name slicer for individual KPI analysis
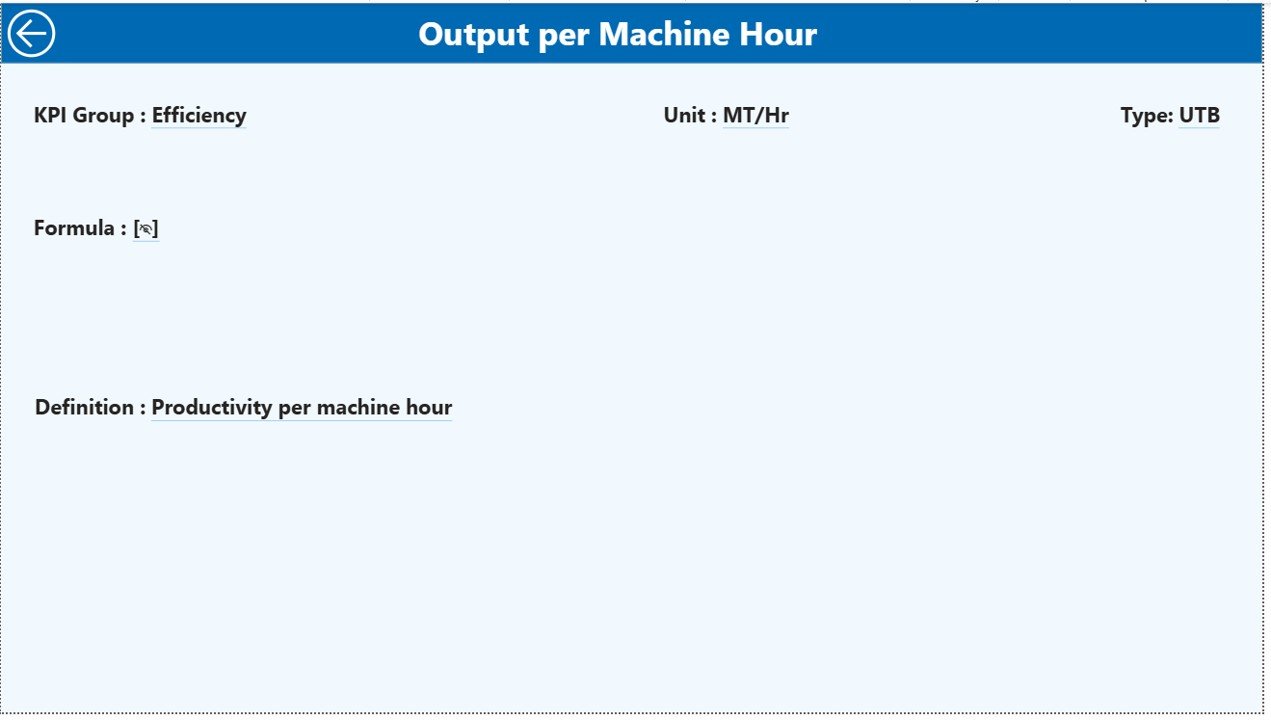
📘 KPI Definition Page
A drill-through page that explains:
-
KPI definition and formula
-
KPI type (UTB / LTB)
-
Unit of measurement
-
Business interpretation
This ensures complete clarity and eliminates confusion during performance reviews.
⚙️ How to Use the Plastics Manufacturing KPI Dashboard
Using this dashboard is simple and user-friendly:
📝 Step 1: Enter actual performance data in the Input_Actual Excel sheet
🎯 Step 2: Update target values in the Input_Target Excel sheet
📖 Step 3: Maintain KPI definitions in the KPI Definition sheet
🔄 Step 4: Refresh Power BI to instantly update visuals
📈 Step 5: Use slicers to analyze MTD, YTD, trends, and KPI performance
No advanced Power BI expertise is required.
👥 Who Can Benefit from This Plastics Manufacturing KPI Dashboard
This dashboard is ideal for:
🏭 Plant Managers
⚙️ Production Heads
📦 Operations Managers
🧪 Quality Managers
🚚 Supply Chain Teams
📊 Manufacturing Executives
Whether you manage a single plant or multiple facilities, this dashboard delivers actionable insights at both operational and strategic levels.
Click here to read the Detailed Blog Post
Watch the step-by-step video tutorial:


Reviews
There are no reviews yet.