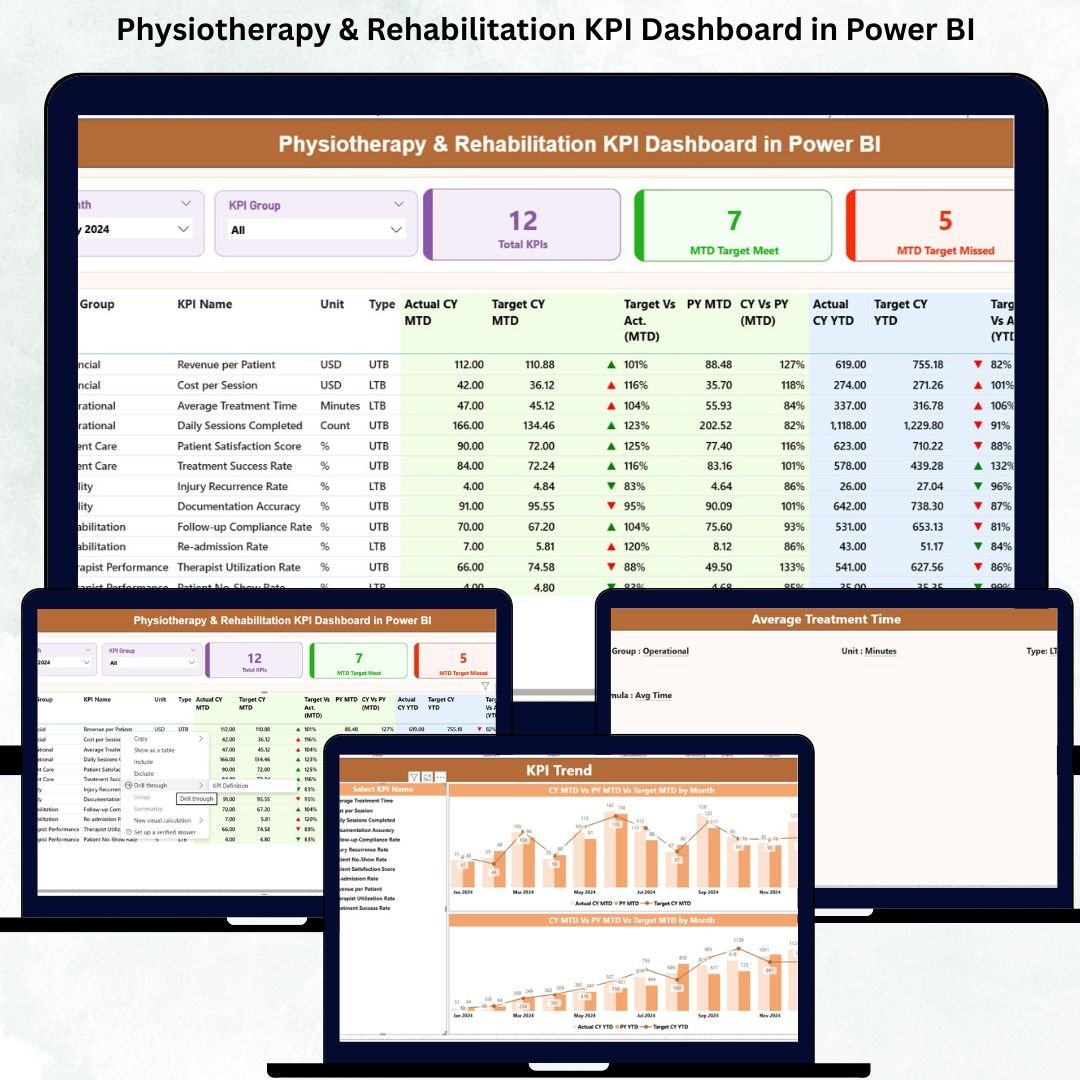


A Physiotherapy & Rehabilitation center needs a fast, accurate, and reliable way to track patient progress, therapist performance, operational efficiency, and overall treatment outcomes. Managing everything through scattered spreadsheets leads to delays, poor decision-making, and missed opportunities to improve recovery results. That’s exactly why the Physiotherapy & Rehabilitation KPI Dashboard in Power BI is the ultimate data tool designed for therapy centers, clinics, recovery units, and healthcare administrators who want complete visibility—instantly.Physiotherapy & Rehabilitation KPI Dashboard in Power BI
This ready-to-use dashboard converts raw Excel numbers into smart, interactive visuals. With one click, you can analyze patient outcomes, measure therapy effectiveness, track MTD/YTD results, review treatment bottlenecks, and monitor staff performance. Whether you manage a small physiotherapy clinic or a large rehabilitation hospital, this dashboard helps you work smarter, deliver better patient experiences, and boost operational productivity.Physiotherapy & Rehabilitation KPI Dashboard in Power BI
💡 Key Features of the Physiotherapy & Rehabilitation KPI Dashboard in Power BI
This dashboard gives physiotherapy centers a fully automated and structured reporting system. Here’s what makes it powerful:
✨ ✔ Monthly Slicers for Quick Filtering
Switch between months instantly and view updated MTD & YTD metrics.
✨ ✔ KPI Group Slicer
Analyze KPIs by Therapy, Patient Care, Operations, or Financials.
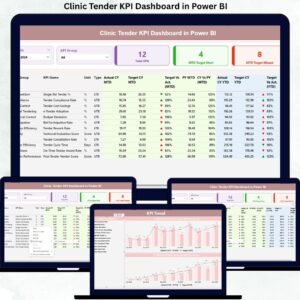
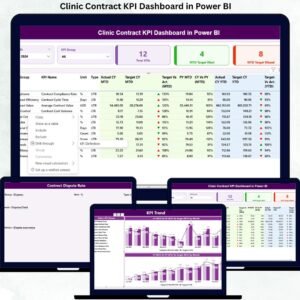
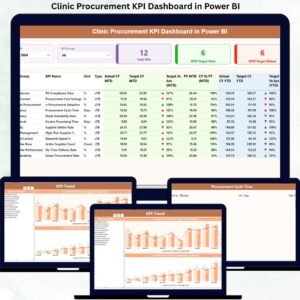
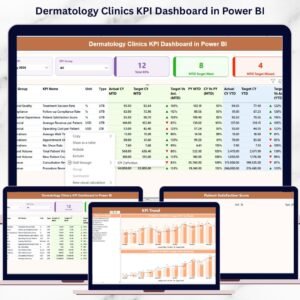
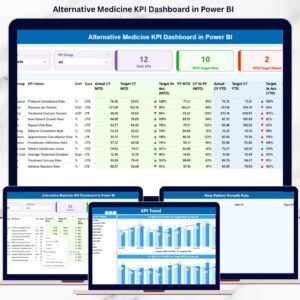
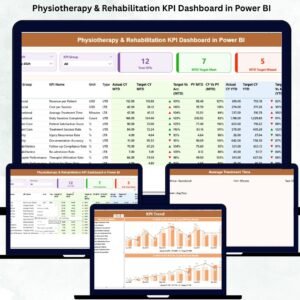
✨ ✔ Summary Performance Cards
View Total KPIs Count, MTD Target Met, and MTD Target Missed at a glance.Physiotherapy & Rehabilitation KPI Dashboard in Power BI
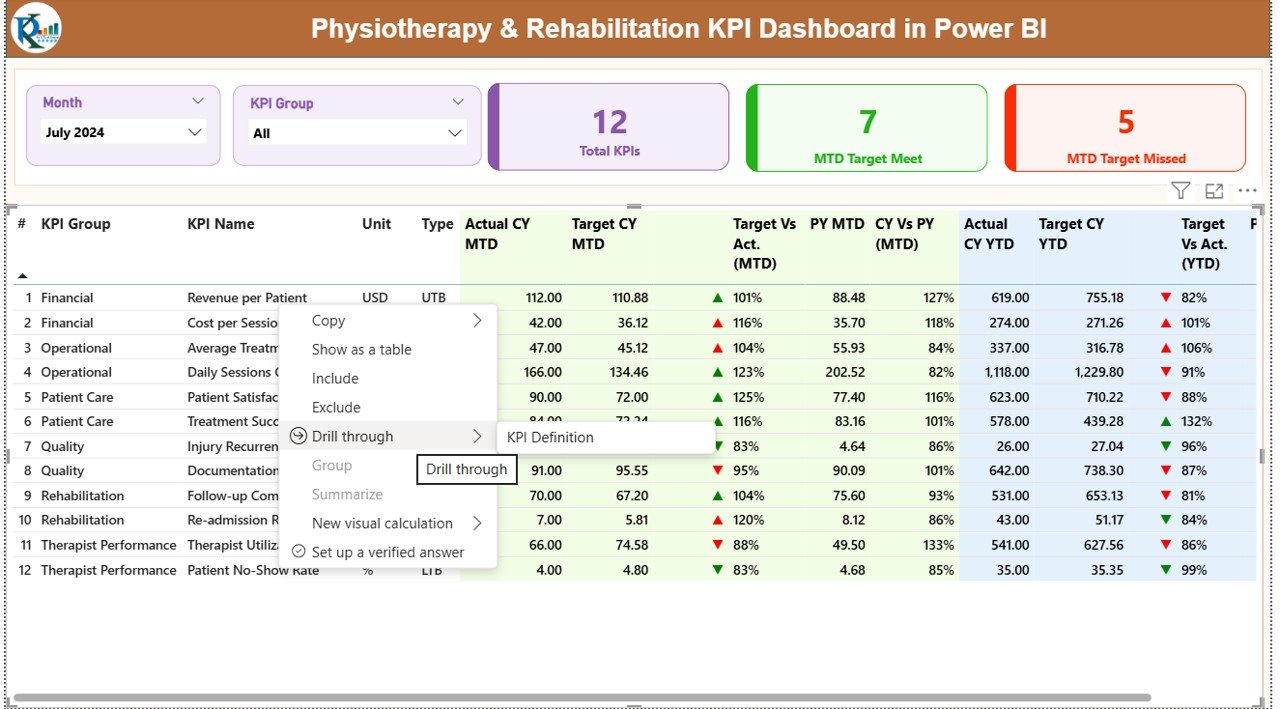
✨ ✔ Detailed KPI Table
See KPI Number, KPI Group, Target, Actual, LTB/UTB logic, MTD & YTD insights, and PY comparisons.
✨ ✔ Visual Indicators
Up/down arrows and colors show performance status instantly.
✨ ✔ Drill-Through KPI Definitions
Right-click any KPI to view its Formula, Definition, Unit, and Type for clarity.
✨ ✔ Trend Charts
Compare CY, PY, and Target visually for any KPI.

📦 What’s Inside the Physiotherapy & Rehabilitation KPI Dashboard
This product includes everything required to run a fully functioning KPI measurement system:
📁 1. Power BI Dashboard File (.PBIX)
Professionally designed dashboard with slicers, KPI visuals, combo charts, and drill-through pages.
📄 2. Excel Data Source (Fully Structured)
Includes three sheets:
-
Input_Actual → For entering monthly MTD & YTD actuals
-
Input_Target → For entering monthly MTD & YTD targets
-
KPI Definition → KPI Name, Group, Unit, Formula, Type (UTB/LTB)
📘 3. KPI Definition Page
A built-in reference that helps any new team member understand how each KPI works.
📊 4. KPI Trend Page
Visual charts to compare monthly CY/PY/Target performance.
📚 5. Complete Documentation
Clear instructions on how to update the Excel file and refresh Power BI.
🛠️ How to Use the Physiotherapy & Rehabilitation KPI Dashboard
Using this dashboard is extremely simple—even for non-technical users:
🟩 Step 1: Open the Excel data file
🟩 Step 2: Update Actuals & Targets for the month
🟩 Step 3: Save the file
🟩 Step 4: Open Power BI
🟩 Step 5: Click Refresh
Power BI will instantly update all cards, charts, and tables with your latest numbers. No coding, formulas, or advanced steps required.Physiotherapy & Rehabilitation KPI Dashboard in Power BI
You can also drill-through KPIs to see full definitions, compare trends, or use slicers to analyze patient, therapist, financial, or operational KPIs.Physiotherapy & Rehabilitation KPI Dashboard in Power BI
🎯 Who Can Benefit from This Physiotherapy & Rehabilitation KPI Dashboard
This dashboard is ideal for:
💼 Clinic Owners
Monitor performance, identify gaps, and improve patient outcomes.
🏥 Rehabilitation Hospitals
Track operational efficiency, therapist workload, and recovery metrics.
🧑⚕️ Physiotherapists & Treatment Teams
Understand progress, therapy effectiveness, and workload balance.
📊 Healthcare Administrators
Make better decisions using real-time data.
📈 Performance Managers & Data Analysts
Measure monthly improvements, trends, and PY comparisons.
💰 Finance & Billing Teams
Review revenue KPIs, billing cycle time, and package conversions.
If your physiotherapy center wants accuracy, transparency, and data-driven decision-making, this Power BI dashboard is the perfect tool.
Click here to read the Detailed blog post
Watch the step-by-step video tutorial:


Reviews
There are no reviews yet.