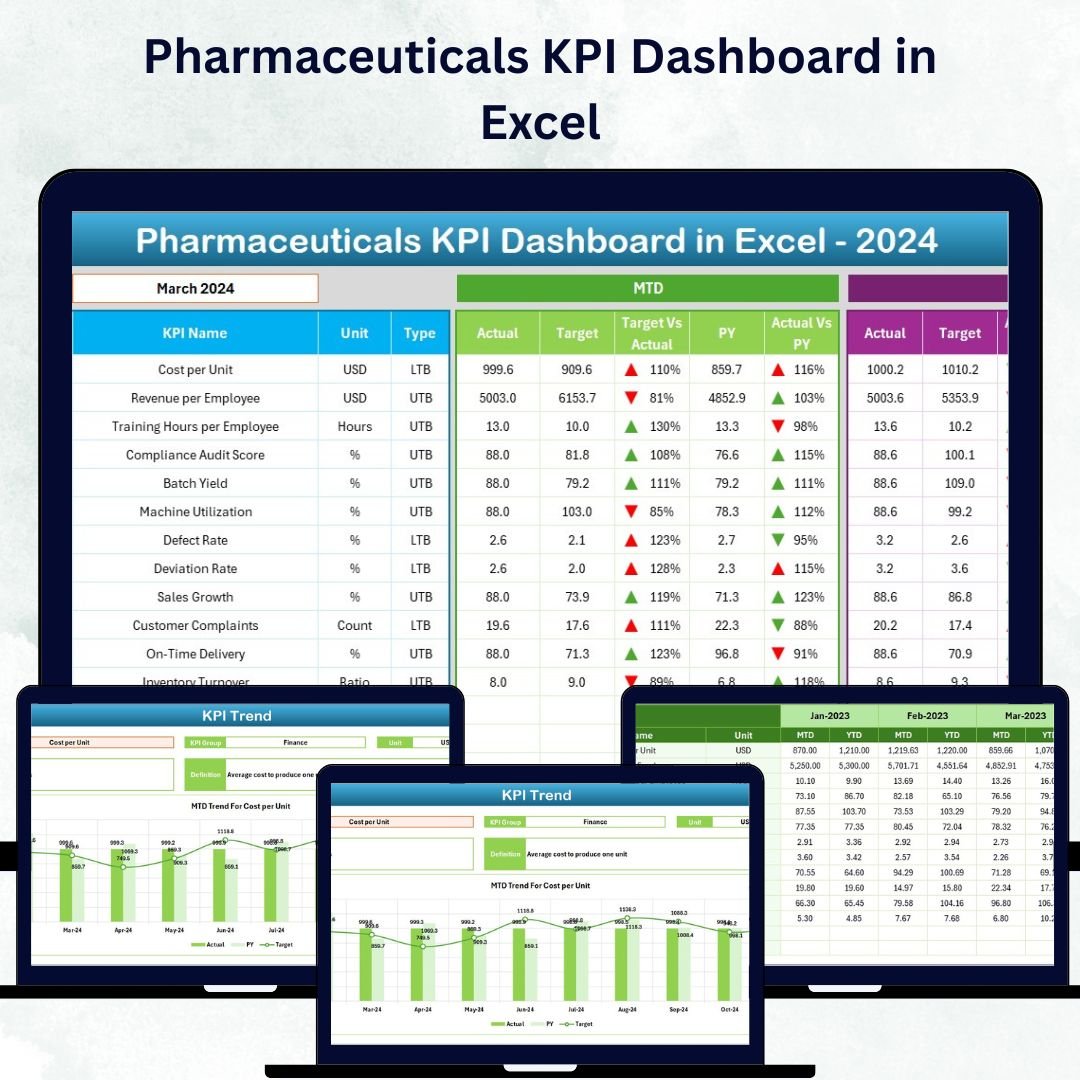
In the fast-paced world of pharmaceuticals, every decision counts — from production efficiency to regulatory compliance. Managing performance across multiple departments can be complex, but with the Pharmaceuticals KPI Dashboard in Excel, you can bring all your key metrics together in one interactive, visual, and easy-to-use platform. 🚀
This ready-to-use dashboard transforms raw pharmaceutical data into actionable insights — helping you monitor performance, identify bottlenecks, and make smarter, data-driven decisions. Whether you’re managing manufacturing, sales, R&D, or compliance, this Excel tool ensures you stay ahead of the competition with complete visibility.Pharmaceuticals KPI Dashboard in Excel
⚙️ Key Features of Pharmaceuticals KPI Dashboard in Excel
✨ All-in-One Performance View: Get a comprehensive overview of all KPIs across departments — production, quality, R&D, and sales — in a single Excel file.Pharmaceuticals KPI Dashboard in Excel
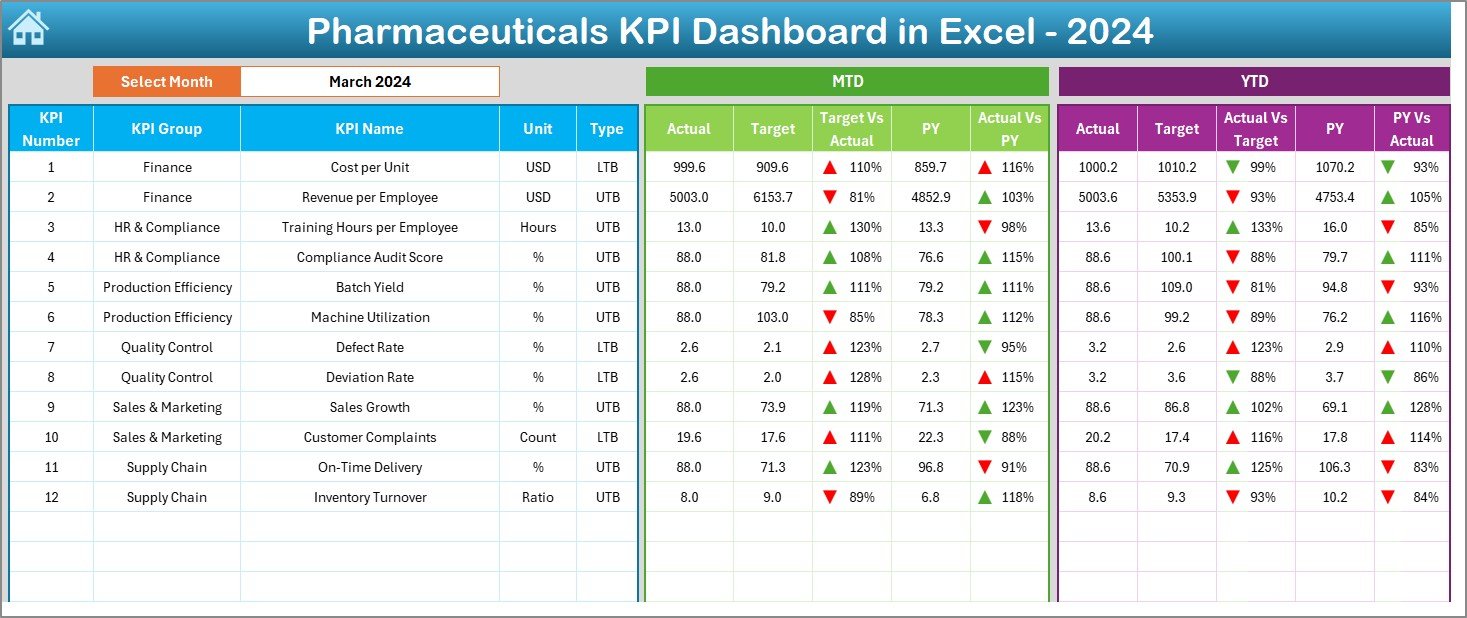
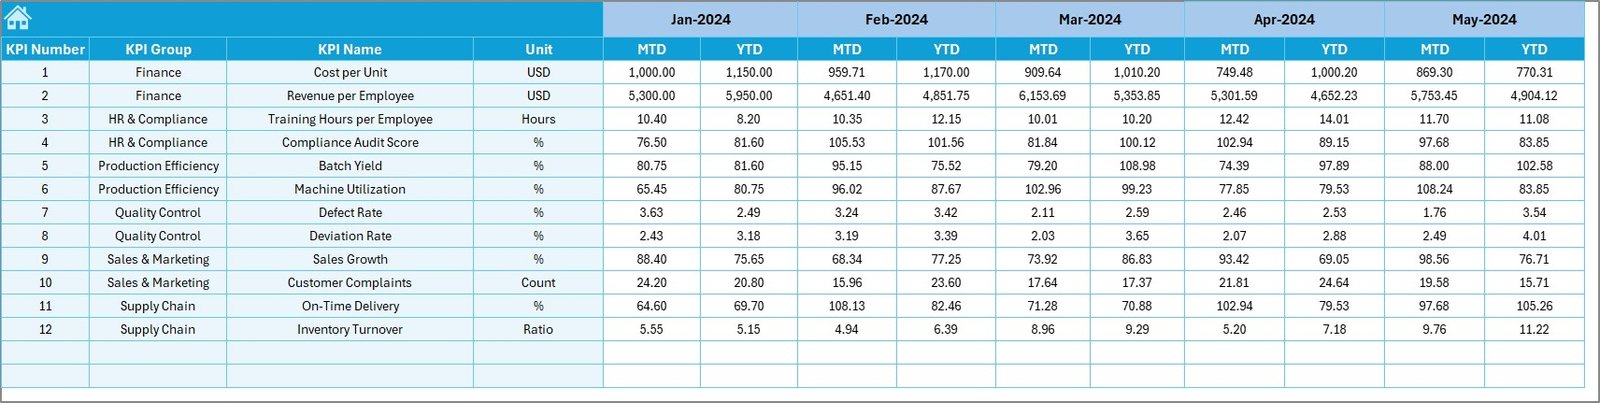
📊 Dynamic Month Selection: Easily select a month from a drop-down (cell D3) to refresh all MTD and YTD data instantly.
📈 Automated Calculations: Compare Actual vs Target and Previous Year vs Actual with built-in formulas — no manual effort needed!
🔻 Conditional Formatting Indicators: Visual arrows highlight where you’re performing well and where improvement is needed.
🧠 Error-Free Data Entry: Centralized data input minimizes human error and enhances data consistency.
💡 Fully Customizable: Add or modify KPIs, departments, or charts to align with your unique business needs.
💰 Cost-Effective Solution: Avoid expensive BI tools — get professional analytics right inside Excel.
🔒 No Macros Needed: Built entirely on standard Excel formulas, dropdowns, and formatting.
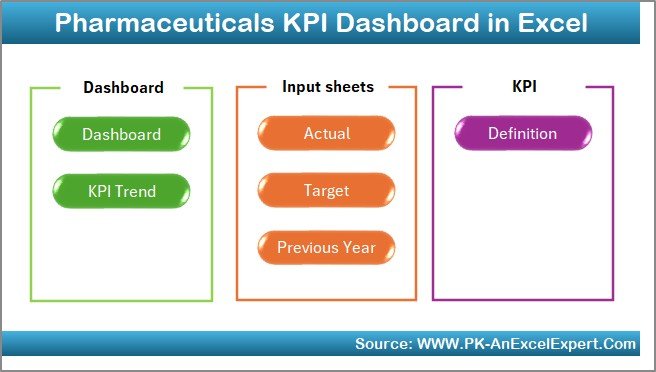
📦 What’s Inside the Pharmaceuticals KPI Dashboard in Excel
The dashboard includes 7 powerful worksheet tabs, each designed to streamline your performance tracking:
1️⃣ Home Sheet: Acts as an interactive index — click buttons to navigate between Dashboard, KPI Trend, Target, Actual, and Definition sheets.
2️⃣ Dashboard Sheet: Displays MTD and YTD Actual, Target, and Previous Year data with visual performance indicators.
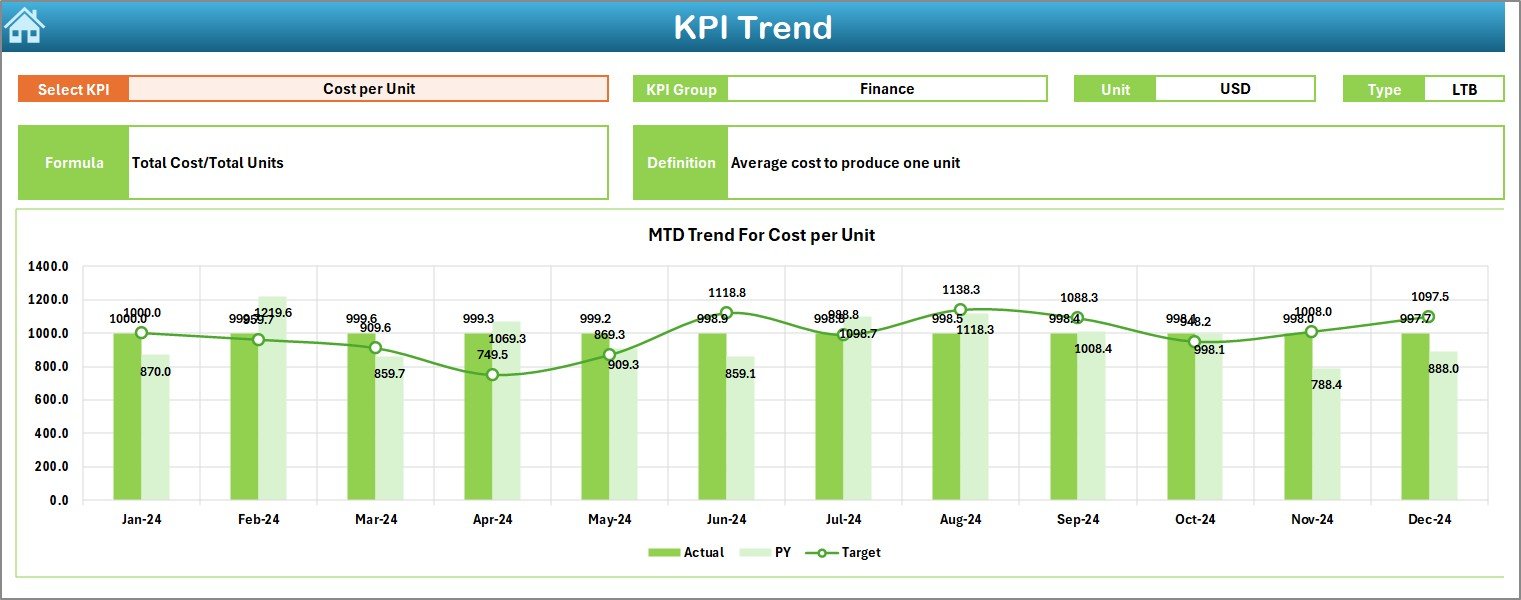
3️⃣ KPI Trend Sheet: Track trends for a single KPI with visual charts and key KPI details like group, type, and formula.
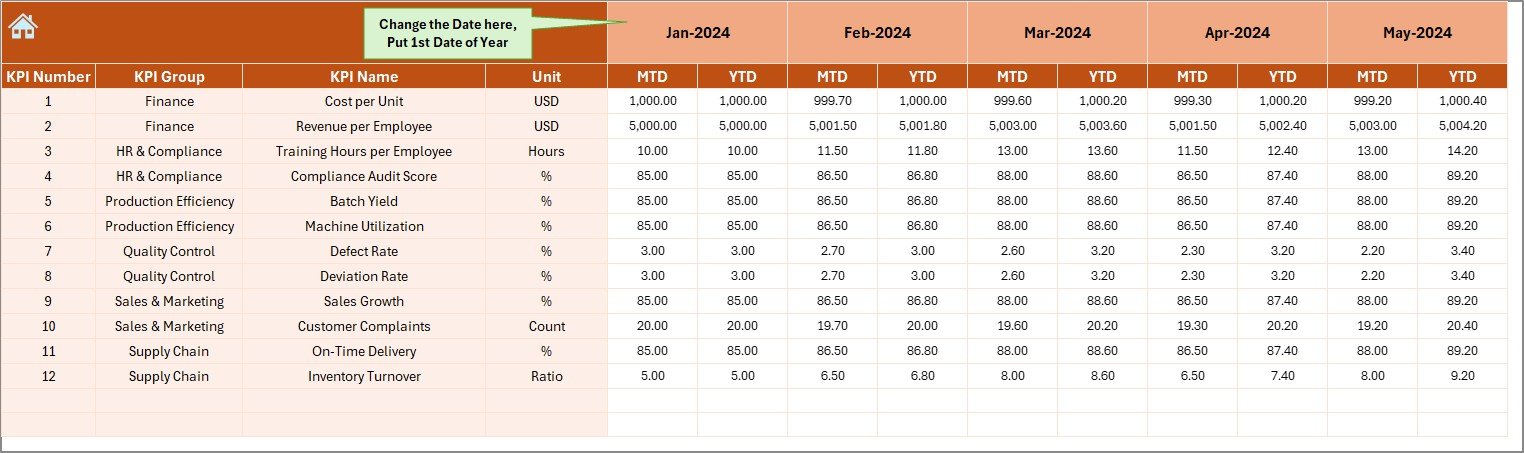
4️⃣ Actual Numbers Input Sheet: Enter monthly MTD and YTD figures — data automatically reflects across the dashboard.
5️⃣ Target Sheet: Define monthly and yearly performance goals for each KPI.
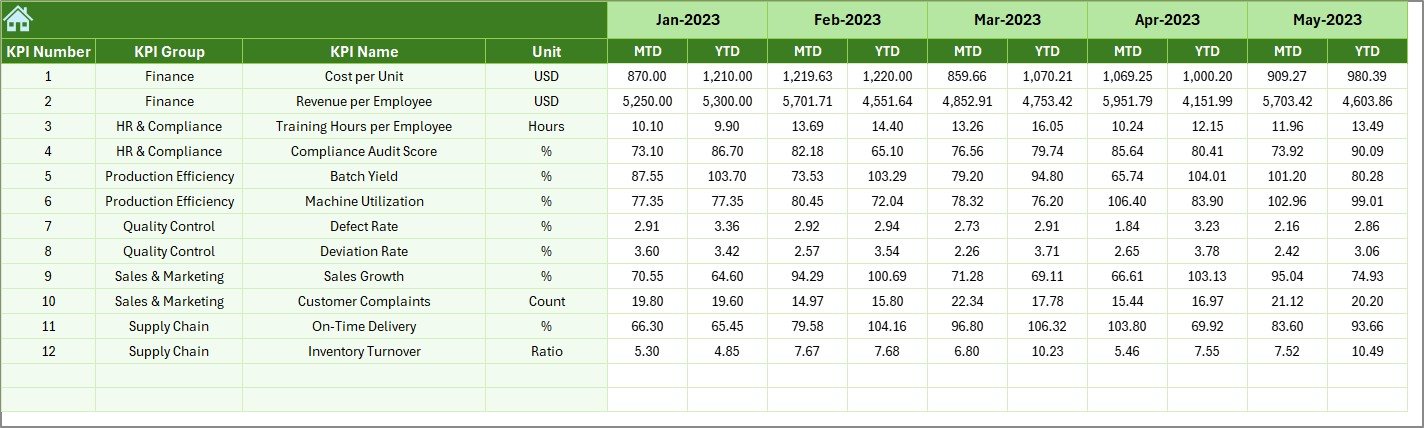
6️⃣ Previous Year Data Sheet: Store last year’s data for accurate comparisons and trend analysis.Pharmaceuticals KPI Dashboard in Excel
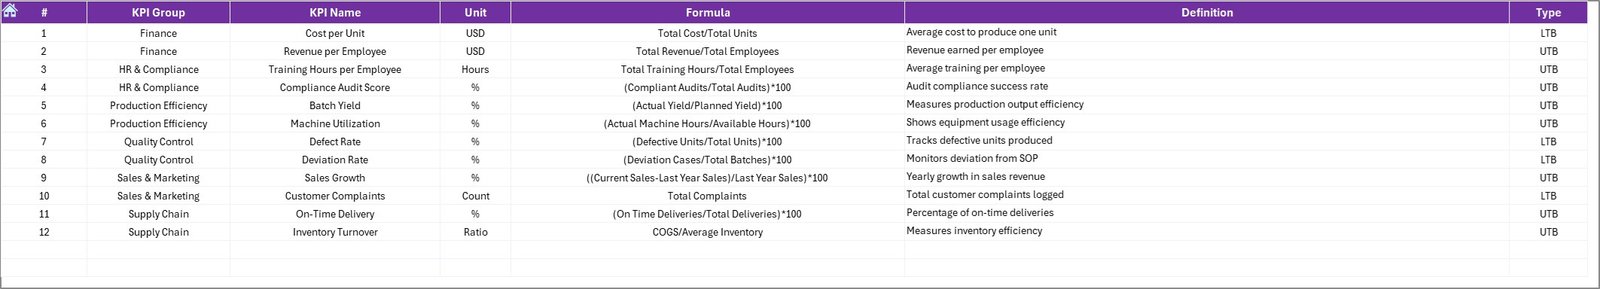
7️⃣ KPI Definition Sheet: Maintain a centralized list of KPI names, formulas, and definitions for standardization.
🧭 How to Use the Pharmaceuticals KPI Dashboard in Excel
💠 Step 1: Define each KPI clearly in the KPI Definition sheet.
💠 Step 2: Enter MTD and YTD target values in the Target sheet.
💠 Step 3: Add monthly Actual data in the Actual Numbers Input sheet.
💠 Step 4: Input last year’s figures for comparison.
💠 Step 5: Navigate easily using the Home sheet buttons.
💠 Step 6: View performance visually on the Dashboard sheet and use conditional arrows to identify gaps.
💠 Step 7: Monitor trends for individual KPIs in the KPI Trend sheet.
Within minutes, you’ll have a professional, interactive KPI dashboard ready for review meetings, audits, or strategy sessions — all without a single line of code. ⚡Pharmaceuticals KPI Dashboard in Excel
👥 Who Can Benefit from This Pharmaceuticals KPI Dashboard in Excel
👨🔬 Production Managers: Track yield, output, and efficiency across production lines.
🧪 Quality Control Teams: Monitor defect rates, test accuracy, and compliance adherence.
💼 Sales Managers: Analyze product sales, target achievement, and revenue growth.
🔬 R&D Teams: Evaluate research timelines and innovation productivity.
🏢 Executives & Analysts: Get a holistic view of organizational performance and trends.
📅 Compliance Officers: Ensure consistent documentation and adherence to industry standards.Pharmaceuticals KPI Dashboard in Excel
No matter the team size, this dashboard brings everyone together under one performance management framework.


Reviews
There are no reviews yet.