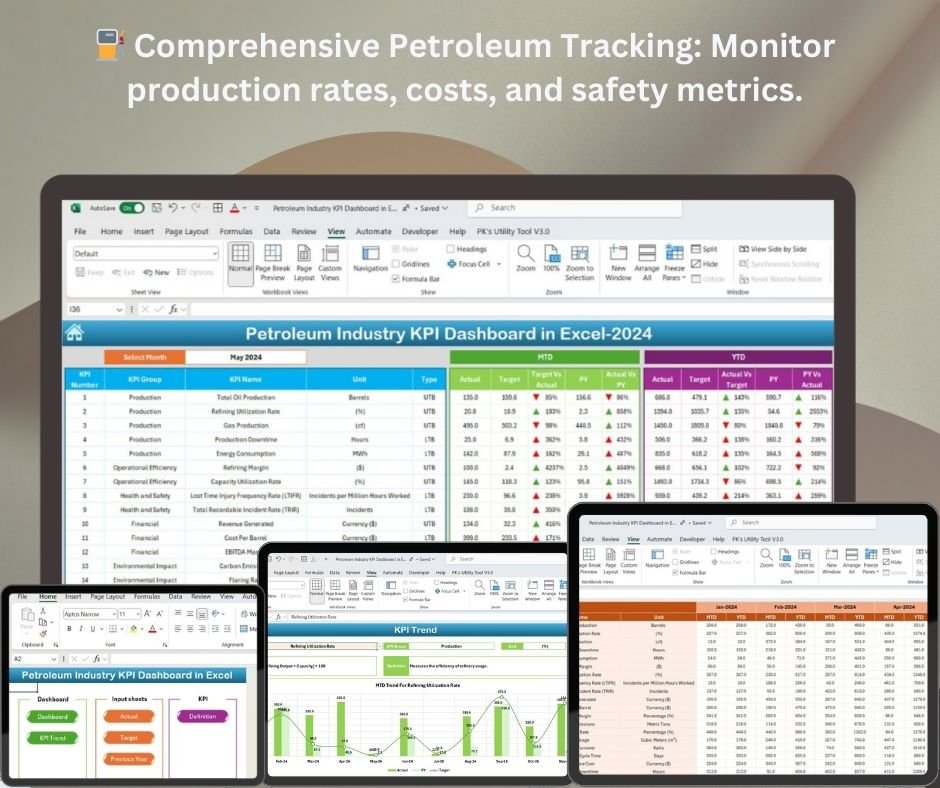
The Petroleum Industry KPI Dashboard in Excel is a robust and essential tool for petroleum industry managers, analysts, and executives who need to monitor, track, and optimize key performance indicators (KPIs) related to oil and gas production, exploration, and operations. This customizable dashboard allows you to track vital metrics such as production rates, operational costs, efficiency, and safety, providing you with real-time insights to improve decision-making and performance.
Whether you’re managing upstream exploration, refining processes, or logistics, this Excel dashboard offers a comprehensive view of your operations, helping you improve efficiency, reduce downtime, and maximize profitability in the highly competitive petroleum industry.
Key Features of the Petroleum Industry KPI Dashboard in Excel
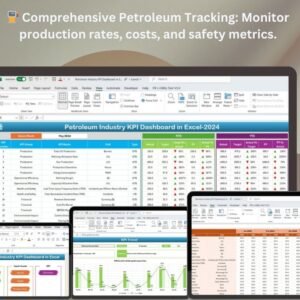
⛽ Comprehensive Petroleum Performance Tracking
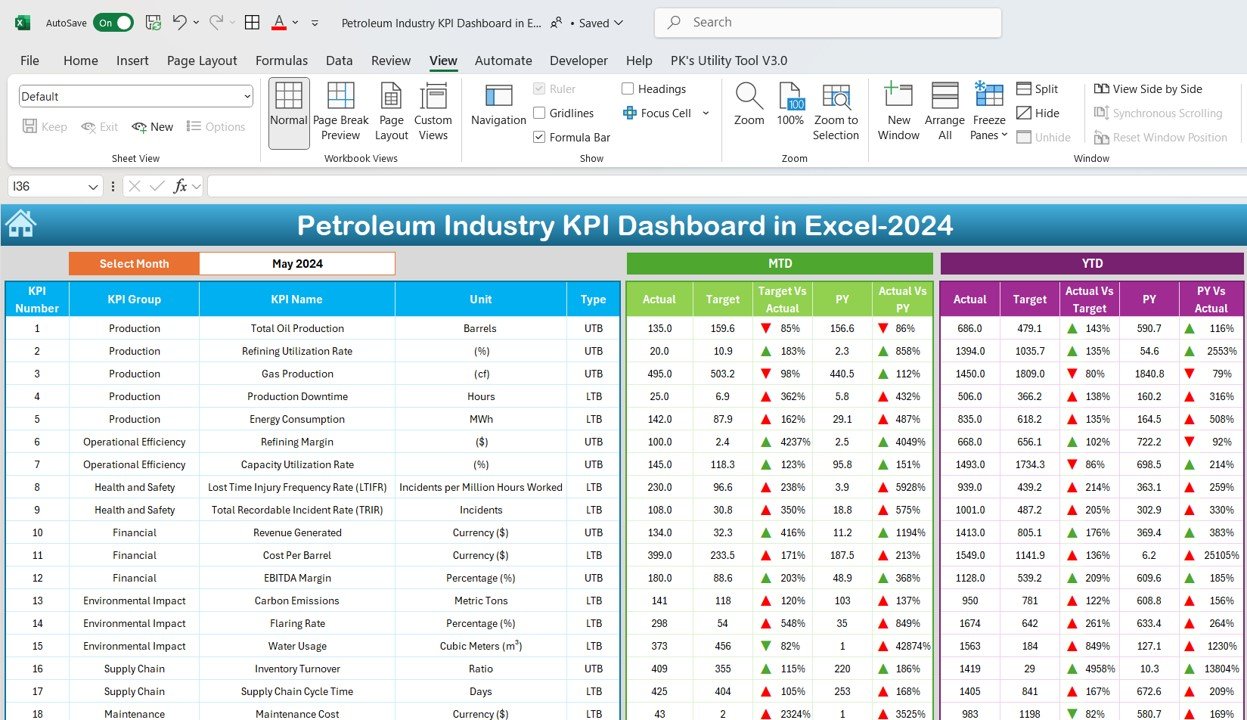
Track essential KPIs such as production rates, operational costs, energy consumption, and workforce efficiency. Gain a clear overview of your petroleum operations and monitor all key metrics in one place.
⚡ Real-Time Data Monitoring
Access real-time data on production performance, safety metrics, and resource usage. Quickly spot trends, anomalies, or potential issues to take corrective actions immediately and keep operations on track.
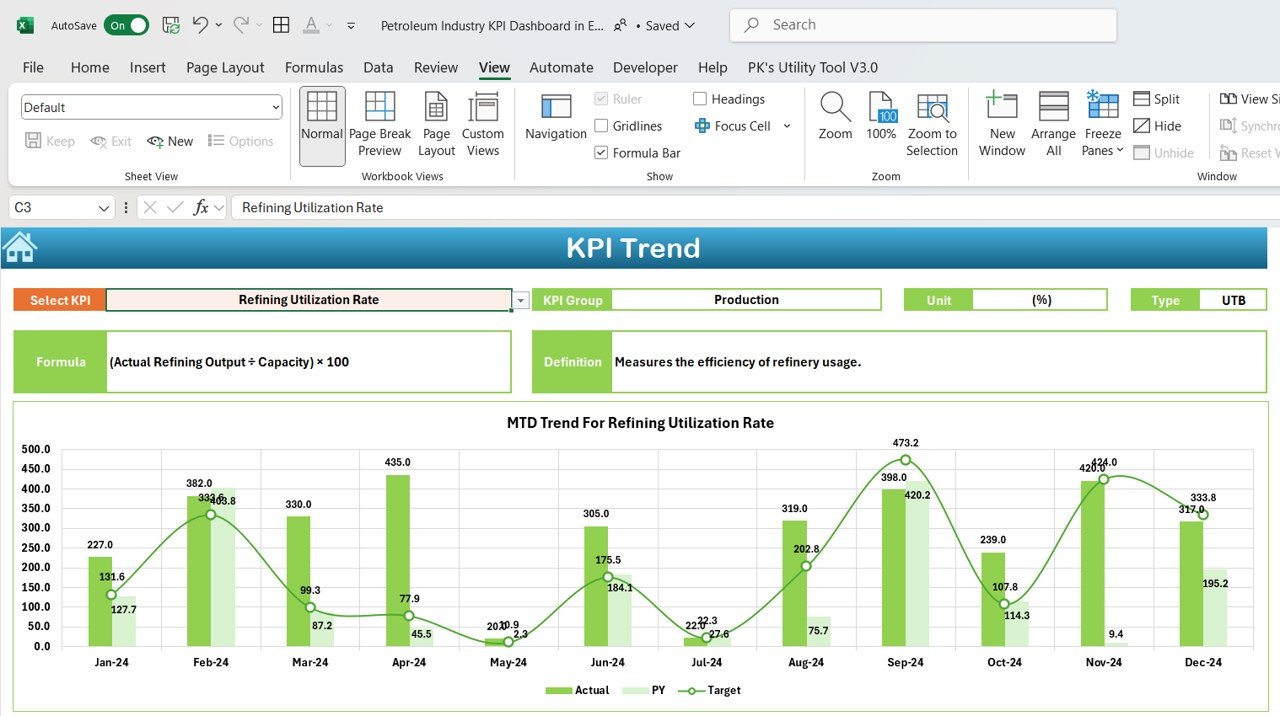
📈 Production & Cost Analysis
Visualize data related to oil and gas production, refining costs, and profit margins. Analyze production trends, optimize cost management, and identify areas for improvement in your operations.
📅 Customizable KPIs for Petroleum Operations
Easily adjust the dashboard to track KPIs specific to your petroleum business needs, whether it’s exploration, drilling performance, or logistics management. Tailor the dashboard to suit your industry segment.
🖥️ Interactive & User-Friendly Interface
The Excel dashboard is designed to be user-friendly, with interactive features like slicers, filters, and drill-down capabilities that allow you to explore data and track performance in a clear and intuitive format.
Why You’ll Love the Petroleum Industry KPI Dashboard in Excel
✅ Track Key Petroleum Metrics
Monitor KPIs such as production rates, operational costs, and energy consumption to ensure your petroleum operations run efficiently and profitably.
✅ Optimize Production & Operations
Analyze production data, identify inefficiencies, and optimize resource allocation to maximize output while minimizing downtime and costs.
✅ Improve Cost Management
Track operational costs, refining expenses, and workforce utilization to ensure your petroleum business is operating within budget and maximizing profitability.
✅ Enhance Safety & Efficiency
Monitor safety metrics, such as incidents and compliance, to improve safety protocols and reduce risks, ensuring that your operations are running smoothly and safely.
✅ Make Data-Driven Decisions
Use the dashboard’s visual insights to make informed decisions about production, cost management, workforce optimization, and safety enhancements, all based on real-time data.
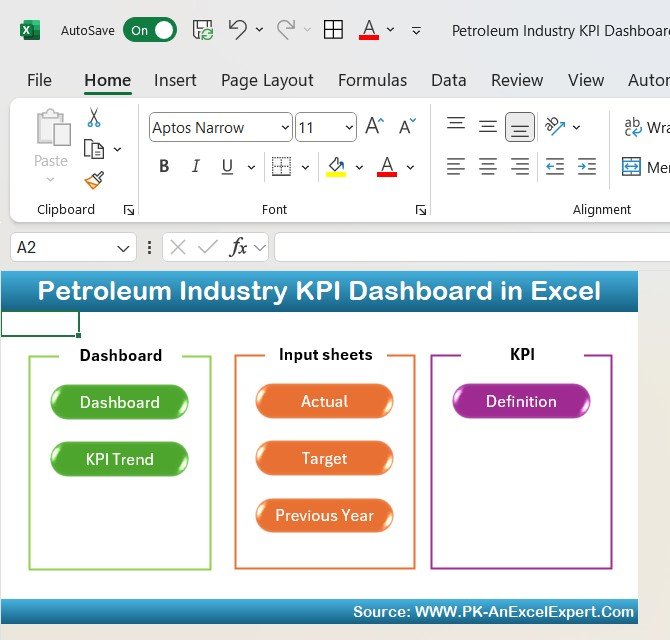
What’s Inside the Petroleum Industry KPI Dashboard Template?
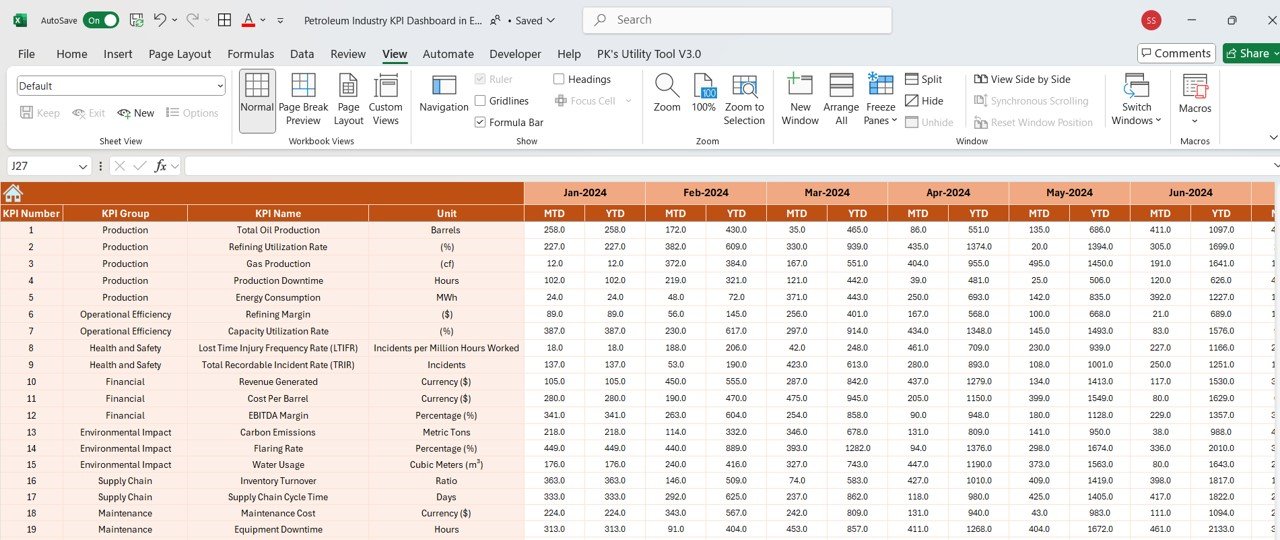
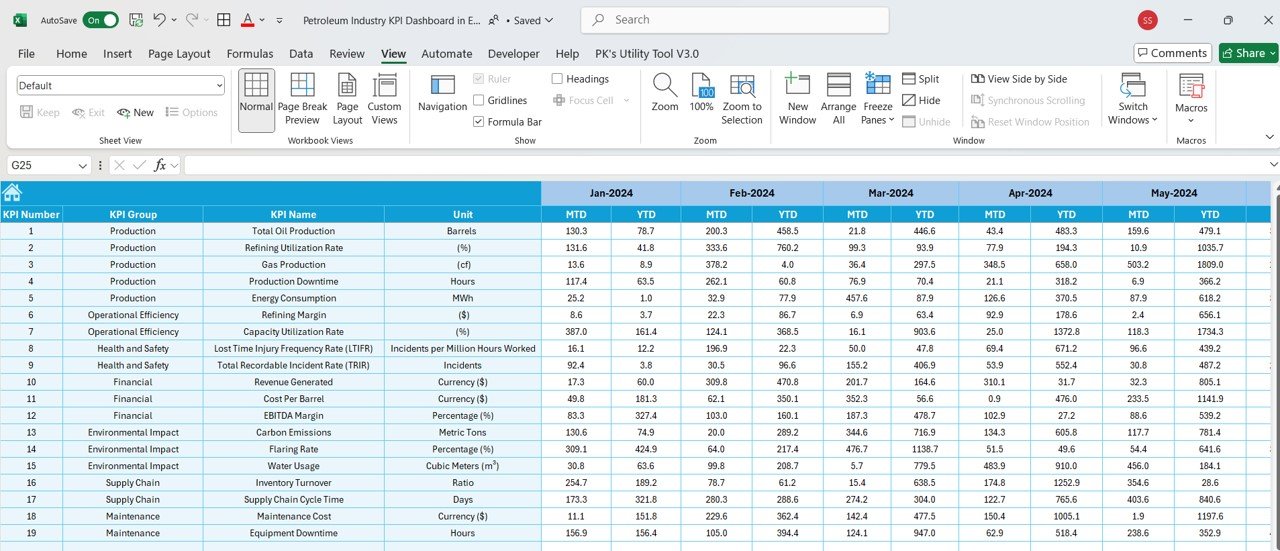
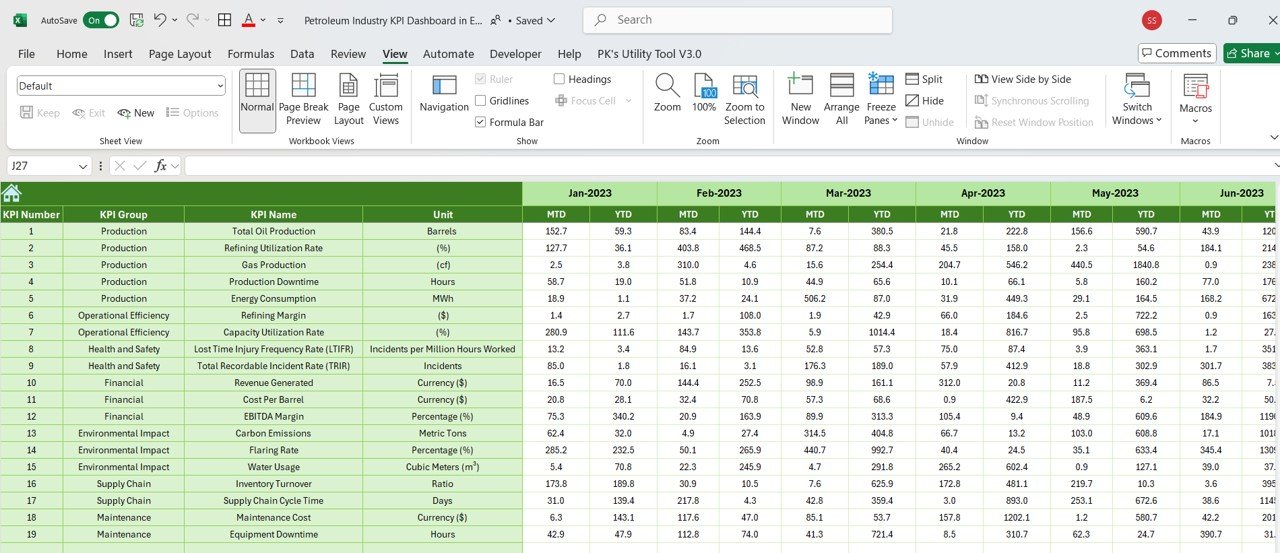
- Production Monitoring: Track oil and gas production rates, including daily, monthly, and yearly performance.
- Cost & Efficiency Analysis: Analyze operational costs, cost per barrel, and workforce productivity to maximize efficiency.
- Safety & Compliance Metrics: Monitor safety incidents, compliance rates, and hazard assessments to ensure a safe working environment.
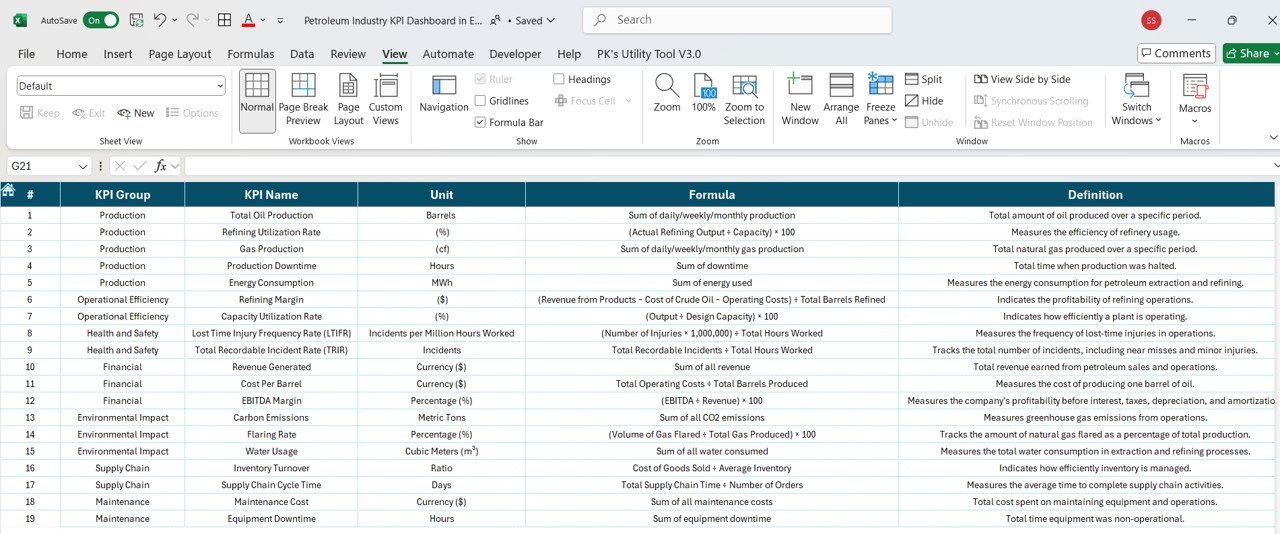
- Customizable KPIs: Adjust the dashboard to track KPIs that align with your specific petroleum operations, including exploration, production, refining, and distribution.
- Interactive Reporting: Visualize key metrics with charts and graphs for easy analysis and decision-making.
How to Use the Petroleum Industry KPI Dashboard in Excel
1️⃣ Download the Template: Access your Petroleum Industry KPI Dashboard instantly.
2️⃣ Input Data: Enter data related to production rates, operational costs, safety metrics, and more.
3️⃣ Track & Monitor KPIs: Use the dashboard to track real-time performance and compare actual results to targets.
4️⃣ Analyze & Optimize: Leverage insights from the dashboard to improve efficiency, reduce costs, and enhance safety protocols.
Who Can Benefit from the Petroleum Industry KPI Dashboard in Excel?
🔹 Petroleum Industry Managers & Executives
🔹 Production & Operations Teams
🔹 Financial Analysts & Cost Managers
🔹 Safety Officers & Compliance Managers
🔹 Energy Analysts & Consultants
🔹 Any Organization Involved in Oil & Gas Production or Refining
Track, analyze, and optimize your petroleum operations with the Petroleum Industry KPI Dashboard in Excel. Monitor production, costs, safety metrics, and more to enhance operational efficiency, safety, and profitability in your petroleum business.
Click here to read the Detailed blog post
Visit our YouTube channel to learn step-by-step video tutorials
Youtube.com/@PKAnExcelExpert


Reviews
There are no reviews yet.