Performance management directly impacts productivity, employee motivation, and organizational growth. Yet many organizations still rely on manual appraisal sheets, disconnected Excel files, and subjective evaluations. As a result, managers struggle to track progress consistently, compare results fairly, and justify appraisal decisions with confidence.
That is exactly why the Performance Appraisal KPI Dashboard in Power BI becomes a powerful and essential solution 🚀.
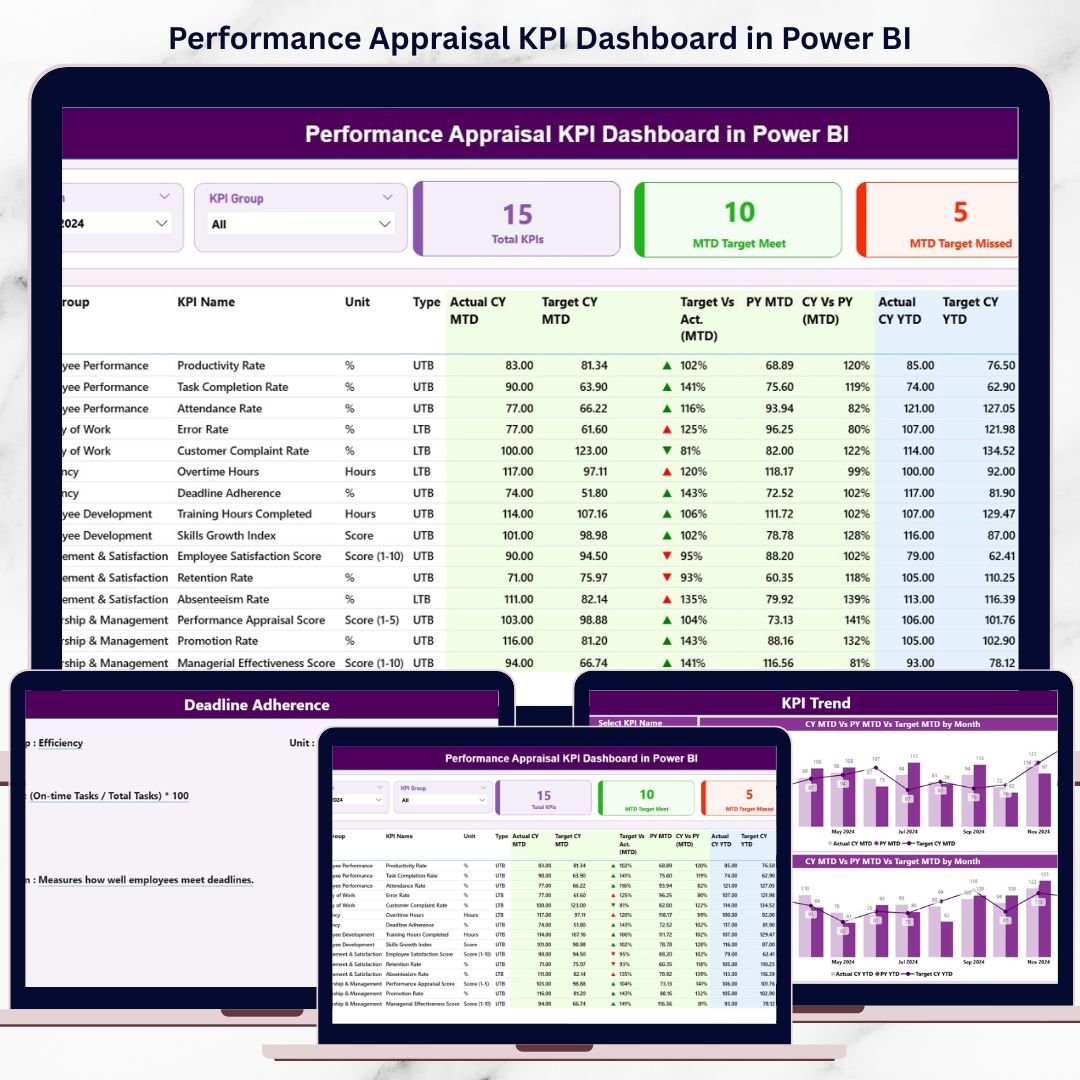
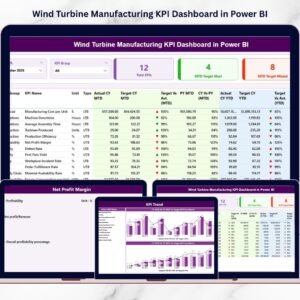
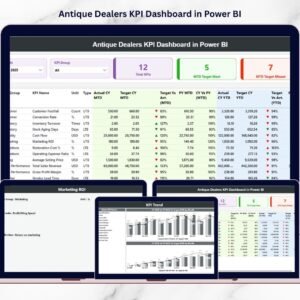
This ready-to-use Power BI dashboard transforms raw appraisal data into clear, interactive, and objective performance insights. Instead of reviewing scattered spreadsheets or narrative reports, HR teams and managers gain a centralized view of all performance KPIs. Because the dashboard updates dynamically using Power BI visuals, decision-makers can instantly assess targets, actuals, trends, and year-over-year performance.
Whether your goal is improving fairness, increasing transparency, or aligning individual performance with business objectives, this dashboard helps organizations move from subjective appraisals to data-driven performance management.
🔑 Key Features of Performance Appraisal KPI Dashboard in Power BI
📊 Centralized Performance Tracking – Monitor all appraisal KPIs from one Power BI dashboard
🎯 MTD & YTD Performance Monitoring – Evaluate short-term achievements and long-term trends
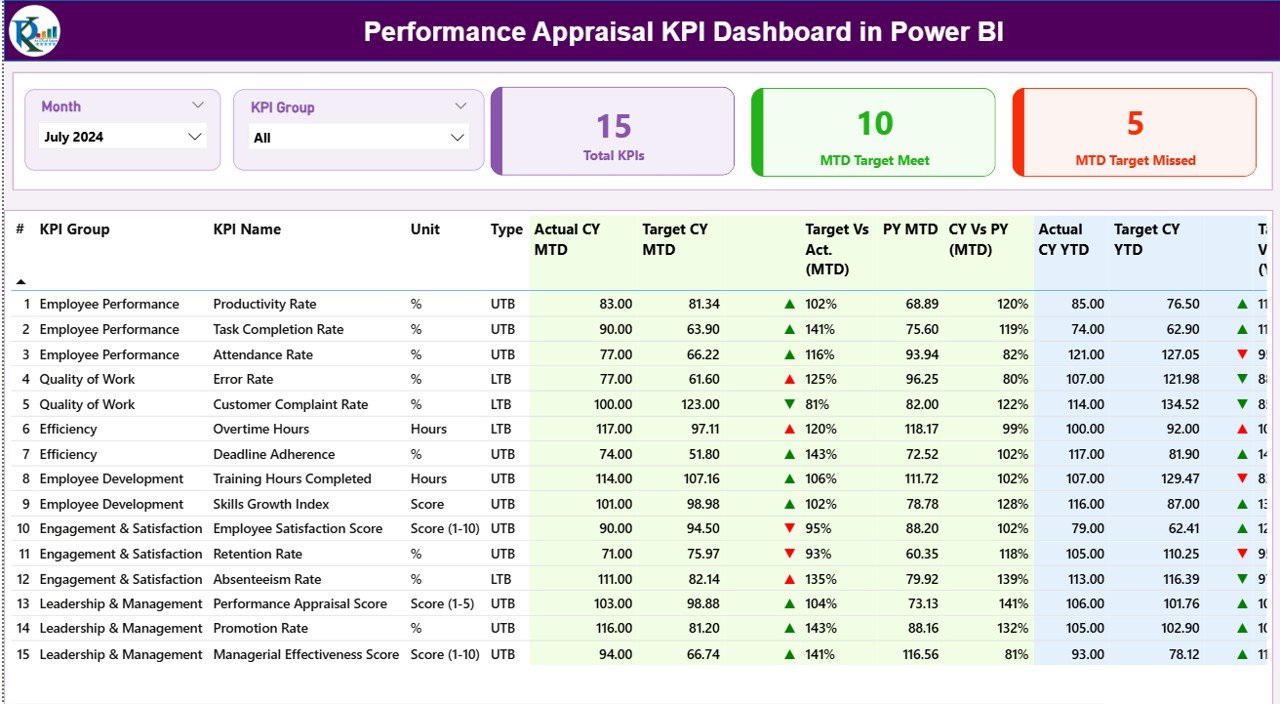
📅 Dynamic Month & KPI Group Slicers – Filter performance by period and appraisal category
🚦 Target Met vs Missed Indicators – Visual green and red icons highlight performance status
📈 Detailed KPI Performance Table – Compare actuals, targets, and previous-year values
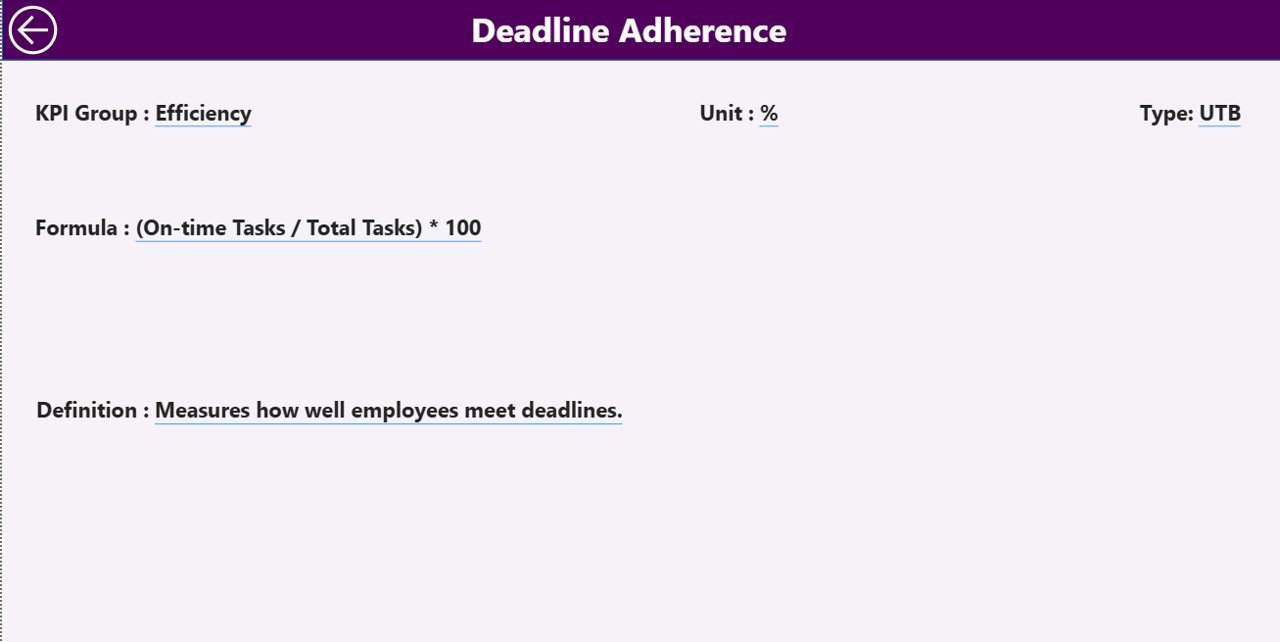
🔍 Drill-Through KPI Definitions – Understand formulas, logic, and KPI intent clearly
⚡ Excel-Based Data Input – Simple data updates with powerful Power BI analytics
📂 What’s Inside the Performance Appraisal KPI Dashboard in Power BI
This digital product includes three structured analytical pages, each designed to support fair and accurate appraisals:
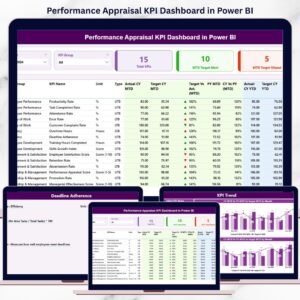
📌 Summary Page – Executive overview with KPI cards, slicers, and a comprehensive KPI performance table
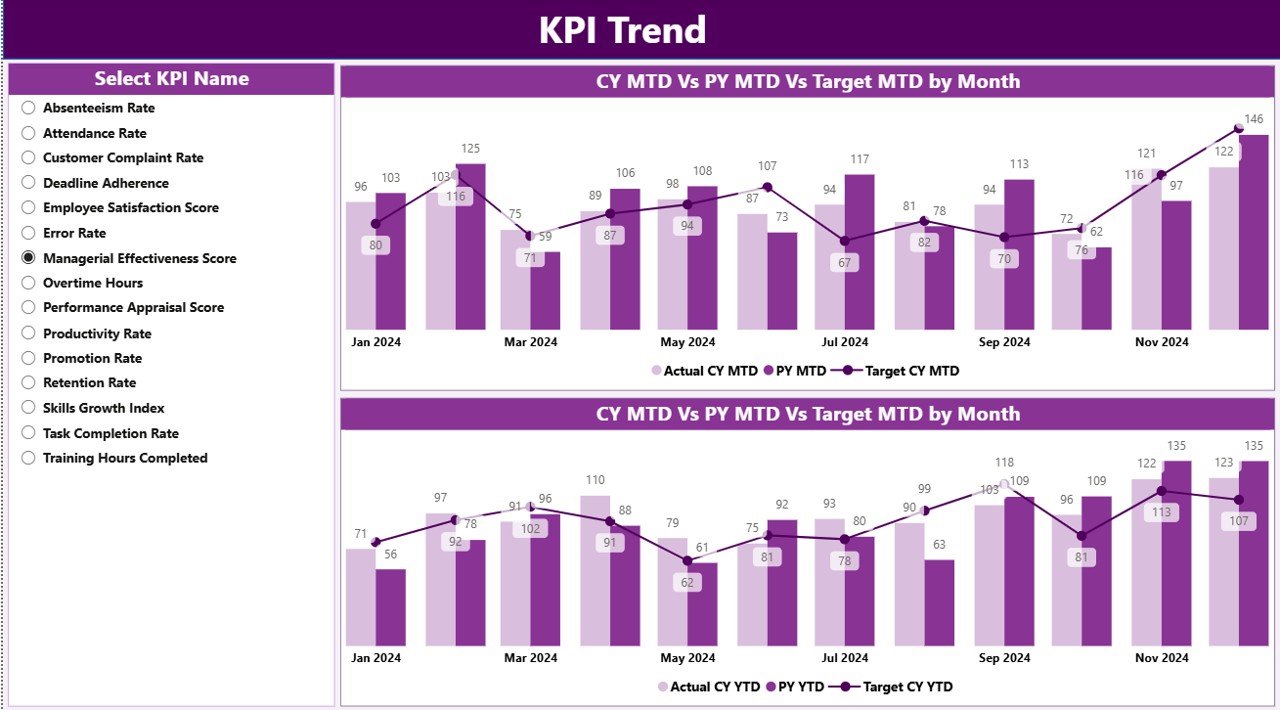
📌 KPI Trend Page – Combo charts comparing MTD and YTD performance across current year, previous year, and targets
📌 KPI Definition Page – Drill-through reference page showing KPI formula, definition, unit, and LTB/UTB logic
Behind the dashboard, the solution connects to structured Excel sheets that store:
-
Actual appraisal performance data
-
Target values
-
Standardized KPI definitions
This structure ensures accuracy, governance, and consistency across appraisal cycles.
🛠️ How to Use the Performance Appraisal KPI Dashboard in Power BI
Using this dashboard is simple and business-friendly:
1️⃣ Update actual performance values in the Input_Actual Excel sheet
2️⃣ Enter appraisal targets in the Input_Target sheet
3️⃣ Maintain KPI logic in the KPI Definition sheet
4️⃣ Refresh the Power BI dashboard
5️⃣ Use slicers to filter by month or KPI group
6️⃣ Review the Summary Page for instant performance clarity
7️⃣ Analyze trends on the KPI Trend Page
8️⃣ Drill through to KPI definitions for transparency and alignment
No advanced Power BI skills required—just structured data and clear insights.
👥 Who Can Benefit from This Performance Appraisal KPI Dashboard in Power BI
This dashboard is ideal for:
👥 HR Managers & HR Analysts – Ensure fair and transparent appraisals
📋 Department Heads & Team Leaders – Track team performance objectively
📊 Performance Review Committees – Support data-backed evaluation decisions
📈 Senior Management – Gain visibility into workforce performance
🏢 Growing Organizations – Standardize appraisal processes across departments
Because the dashboard is flexible, it adapts easily across industries and organizational sizes.
📘 Click here to read the detailed blog post
▶️ Visit our YouTube channel to learn step-by-step video tutorials


Reviews
There are no reviews yet.