Managing payroll accurately is one of the most critical responsibilities for any organization. Even small payroll mistakes can lead to employee dissatisfaction, compliance issues, and financial discrepancies. Because of this, HR departments and payroll managers must closely monitor payroll performance, compare results with targets, and identify errors quickly.
However, many organizations still rely on manual reports and scattered spreadsheets to review payroll data. As a result, analyzing payroll accuracy and performance trends becomes time-consuming and inefficient.
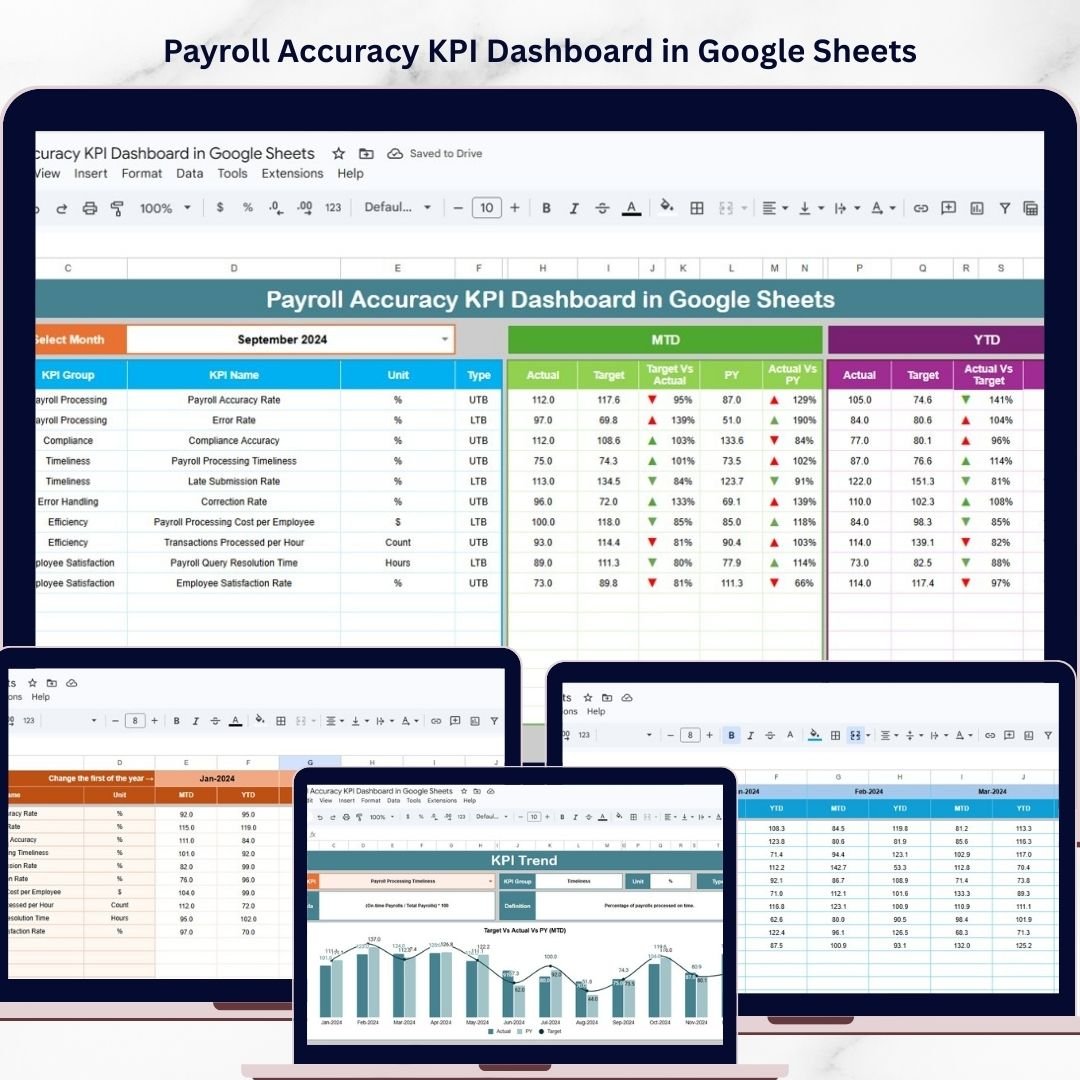
To solve this challenge, we created the Payroll Accuracy KPI Dashboard in Google Sheets — a powerful, ready-to-use analytics tool designed to help organizations monitor payroll performance with clarity and precision.
This interactive Google Sheets dashboard enables payroll managers, HR professionals, and business analysts to track payroll accuracy KPIs, analyze trends, and compare performance across different periods in a single centralized interface.
Instead of reviewing multiple reports manually, users can quickly monitor Month-to-Date (MTD), Year-to-Date (YTD), Target, and Previous Year payroll performance using dynamic visuals and automated calculations.
Because this dashboard is built in Google Sheets, it also allows teams to collaborate in real time, making payroll monitoring more transparent, efficient, and data-driven.
Whether you want to track payroll error rates, compare targets with actual performance, or analyze payroll trends over time, this dashboard provides a clear and structured view of payroll KPIs.
📊 Key Features of Payroll Accuracy KPI Dashboard in Google Sheets
📊 Interactive Payroll Performance Dashboard
Monitor all payroll accuracy KPIs from a single dashboard with dynamic charts and performance indicators.
📅 Monthly KPI Selection
Select any month from the dropdown (Cell D3) and instantly update all dashboard metrics.
📈 MTD Performance Tracking
Track Month-to-Date Actual values compared with Targets and Previous Year numbers.
📊 YTD Payroll Accuracy Monitoring
Evaluate Year-to-Date payroll performance with automated comparisons and visual indicators.
⬆️⬇️ Conditional Formatting with Visual Indicators
Up and down arrows automatically highlight whether KPIs are improving or declining.
📉 KPI Trend Analysis Charts
Analyze payroll accuracy performance trends using interactive charts.
📂 Multiple Input Sheets for Data Management
Separate sheets for Actual numbers, Target values, and Previous Year data ensure organized reporting.
📘 Detailed KPI Definitions
Each KPI includes its group, formula, unit, and definition for better understanding and transparency.
📦 What’s Inside the Payroll Accuracy KPI Dashboard in Google Sheets
This professional template includes multiple structured worksheets designed for complete payroll KPI monitoring.
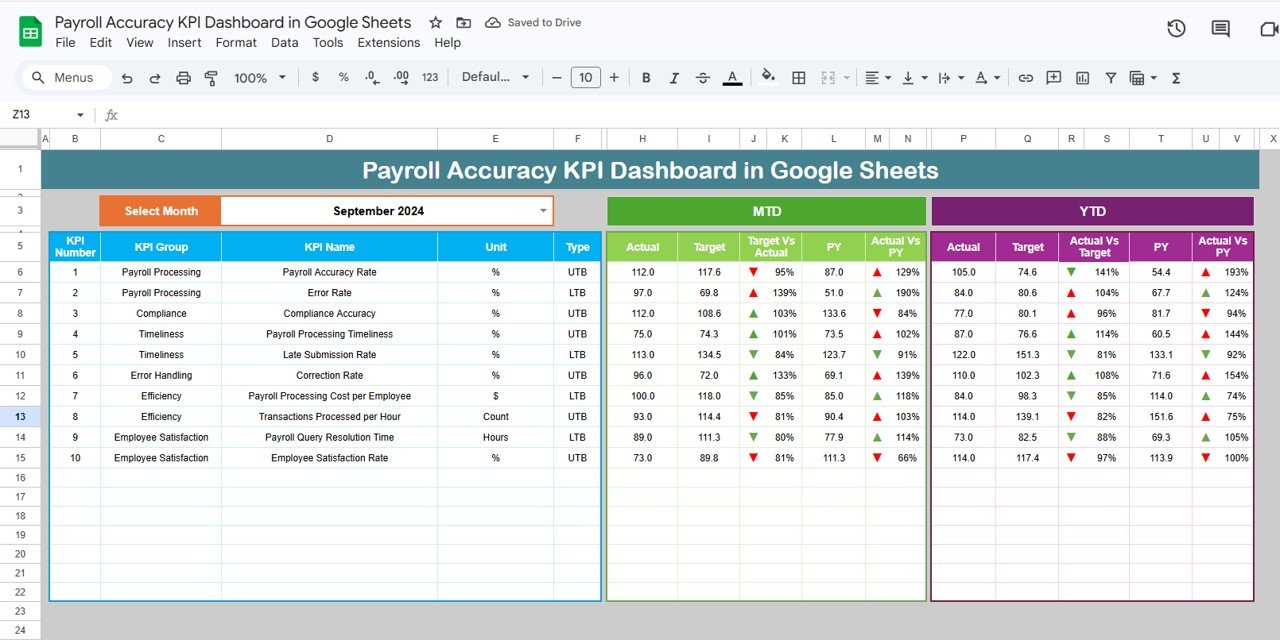
1️⃣ Dashboard Sheet
This is the main analytical page where all payroll accuracy KPIs are displayed.
Features include:
-
Month selection dropdown (Cell D3)
-
MTD Actual, Target, and Previous Year comparisons
-
Target vs Actual comparison indicators
-
PY vs Actual comparison indicators
-
YTD Actual, Target, and Previous Year metrics
All visuals update dynamically based on the selected month.
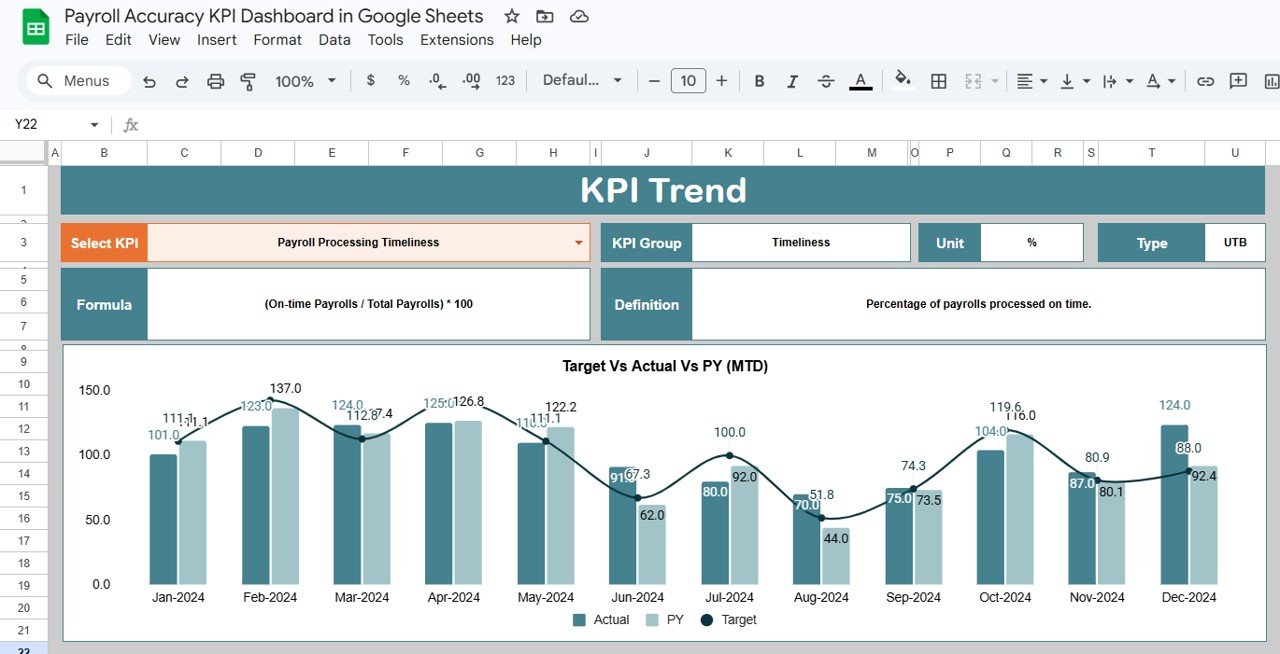
2️⃣ KPI Trend Sheet
This sheet provides detailed KPI analysis.
Users can select any KPI using the dropdown in Cell C3 and view:
-
KPI Group
-
KPI Unit
-
KPI Type (Lower the Better / Upper the Better)
-
KPI Formula
-
KPI Definition
Charts display MTD and YTD performance trends, comparing Actual, Target, and Previous Year numbers.
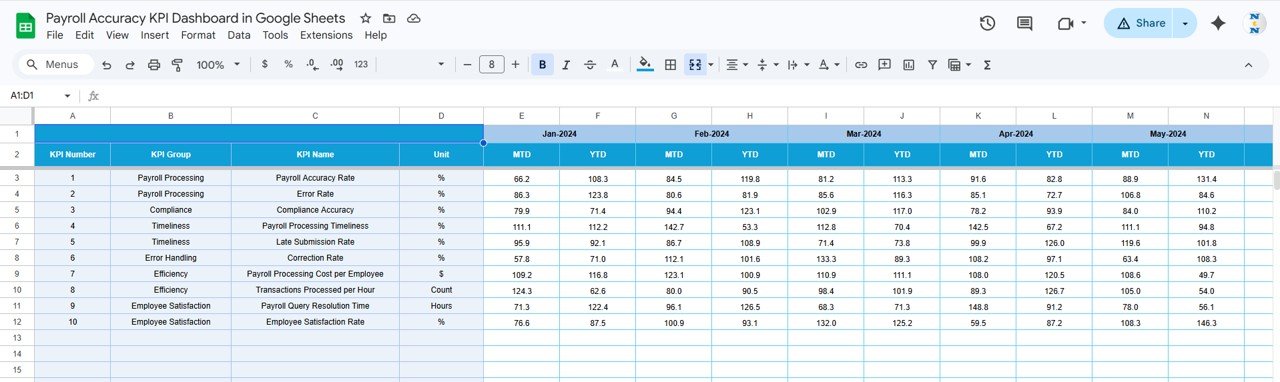
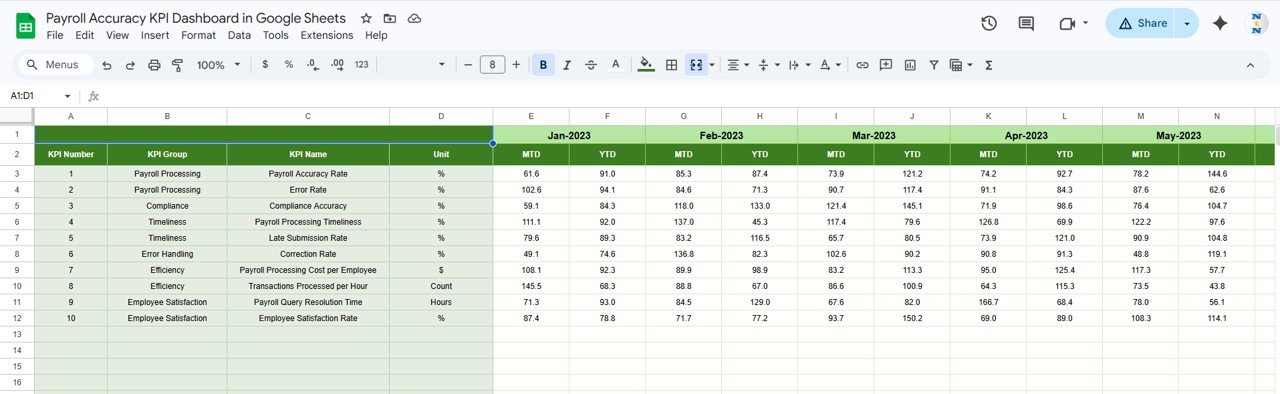
3️⃣ Actual Numbers Input Sheet
This sheet is used to enter actual payroll KPI data.
Features include:
-
Monthly MTD input values
-
YTD calculation tracking
-
Base month control in Cell E1
This sheet serves as the primary data source for the dashboard.
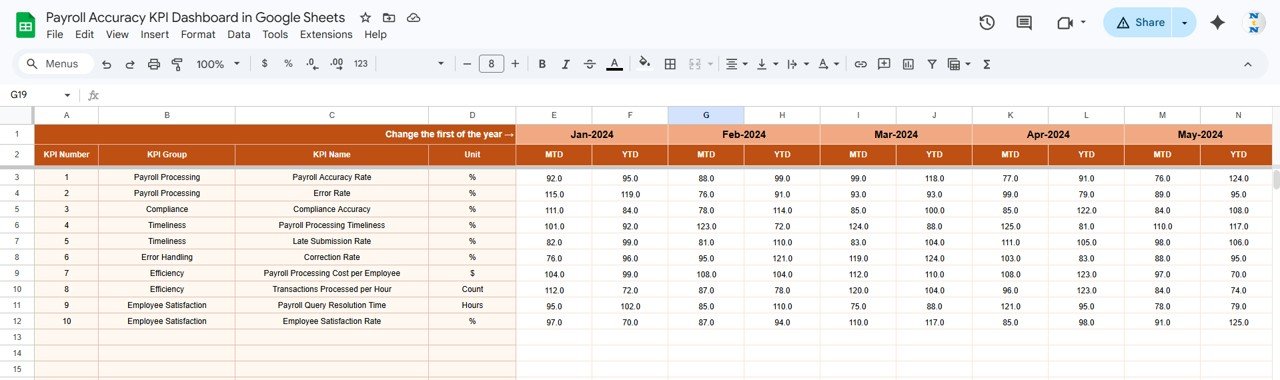
4️⃣ Target Numbers Input Sheet
Enter monthly target values for payroll KPIs in this sheet.
The dashboard uses this data to generate Target vs Actual performance comparisons.
5️⃣ Previous Year Numbers Sheet
This sheet stores payroll KPI data from the previous year.
By comparing this historical data with current results, organizations can evaluate payroll performance improvements.
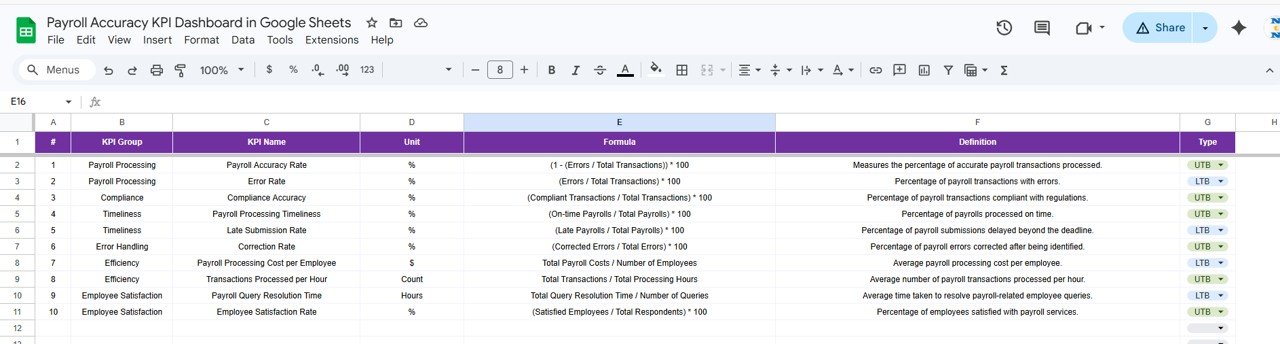
6️⃣ KPI Definition Sheet
This sheet clearly defines every KPI used in the dashboard.
It includes:
-
KPI Name
-
KPI Group
-
Unit of Measurement
-
KPI Formula
-
KPI Definition
-
KPI Type (LTB or UTB)
These definitions ensure consistent KPI interpretation across teams.
⚙️ How to Use the Payroll Accuracy KPI Dashboard in Google Sheets
Using this dashboard is simple and requires minimal setup.
1️⃣ Enter payroll KPI data in the Actual Numbers Input sheet.
2️⃣ Add KPI targets in the Target Numbers sheet.
3️⃣ Input historical data in the Previous Year sheet.
4️⃣ Define KPIs in the KPI Definition sheet if customization is needed.
5️⃣ Select the desired month from the dropdown in the Dashboard sheet.
The dashboard will automatically update charts, indicators, and performance comparisons.
Within minutes, you can transform payroll data into clear and actionable insights.
👥 Who Can Benefit from This Payroll Accuracy KPI Dashboard
This dashboard is designed for organizations that want to monitor payroll performance and ensure accuracy.
👩💼 Payroll Managers – Track payroll accuracy KPIs and error trends.
👨💻 HR Professionals – Monitor payroll performance and compliance.
📊 Business Analysts – Analyze payroll efficiency and performance metrics.
🏢 Finance Teams – Review payroll accuracy and financial impacts.
📈 Operations Managers – Ensure payroll processes run smoothly and efficiently.
Organizations of all sizes can use this dashboard to improve payroll transparency, accuracy, and decision-making.
### Click here to read the Detailed blog post
Watch the step-by-step video tutorial:
Visit our YouTube channel to learn step-by-step video tutorials


