
A pathology lab runs hundreds of tests, patient interactions, equipment cycles, and quality checks every single day. Every minute saved, every process improved, and every accurate test result directly impacts patient health. But managing all these activities manually through spreadsheets becomes overwhelming, slow, and prone to errors. That’s why the Pathology Labs KPI Dashboard in Excel is the ultimate solution for modern labs that want clarity, speed, and accuracy in their performance monitoring.
This ready-to-use dashboard converts complex lab data into simple visuals. It helps managers track test volumes, turnaround time, QC pass rates, equipment performance, patient inflow, error rates, and more—everything neatly displayed on one screen. Pathology Labs KPI Dashboard in Excel Whether Pathology Labs KPI Dashboard in Excel you manage a diagnostic lab, hospital pathology unit, or standalone testing center, this dashboard gives you real-time insights to take smarter decisions and improve service quality instantly.
Let’s explore why this dashboard is becoming a must-have tool for every pathology lab.
🌟 Key Features of the Pathology Labs KPI Dashboard in Excel
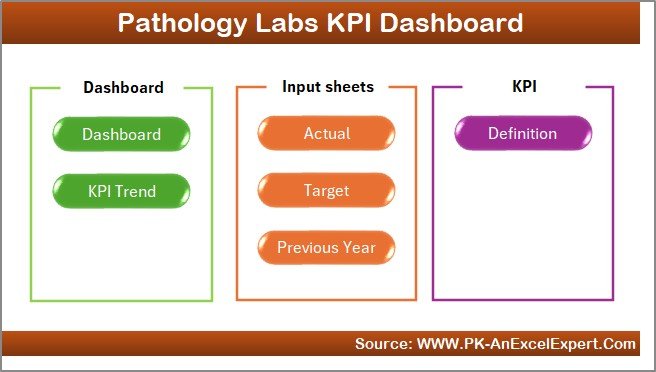
1️⃣ Home Sheet – Quick Navigation Made Easy 🏠
The Home Sheet works like an index page. It includes 6 clickable buttons that take users to different sheets.
-
New users navigate the file easily
-
No scrolling or searching required
-
Faster workflow for managers and lab staff
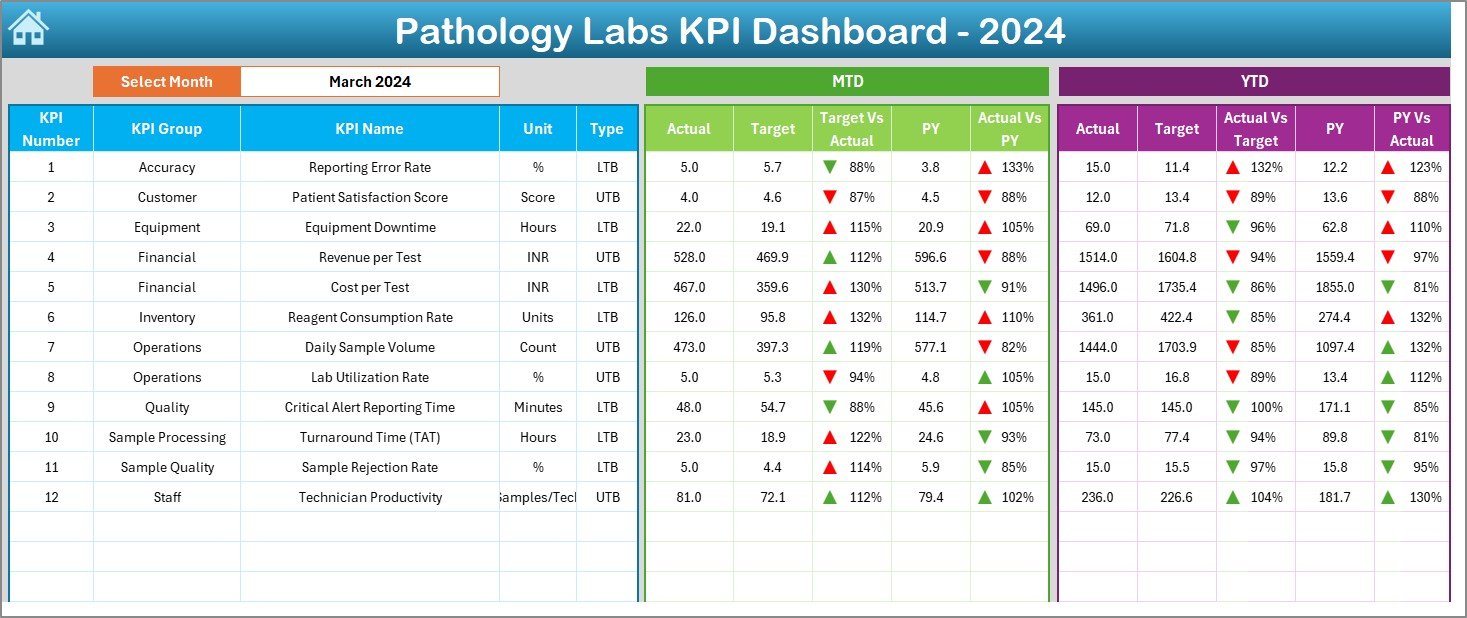
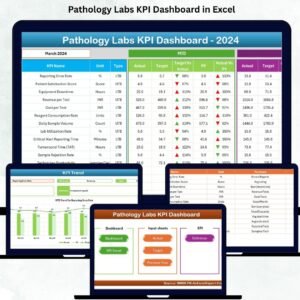
2️⃣ Dashboard Sheet – Your Main KPI Control Center 📈
This is the heart of the dashboard. It displays:
-
MTD Actual, MTD Target, MTD Previous Year
-
YTD Actual, YTD Target, YTD Previous Year
-
Target vs Actual%
-
PY vs Actual%
A dropdown in cell D3 allows users to pick a month and instantly view updated numbers.
Color coding makes it even easier:
-
Green ▲ = Performance on track
-
Red ▼ = Needs immediate attention
Track KPIs like:
-
Test accuracy rate
-
Report delivery time
-
Patient wait time
-
Testing volume
-
QC pass rate
-
Equipment utilization
-
Error rate
This sheet provides both short-term (MTD) and long-term (YTD) visibility.
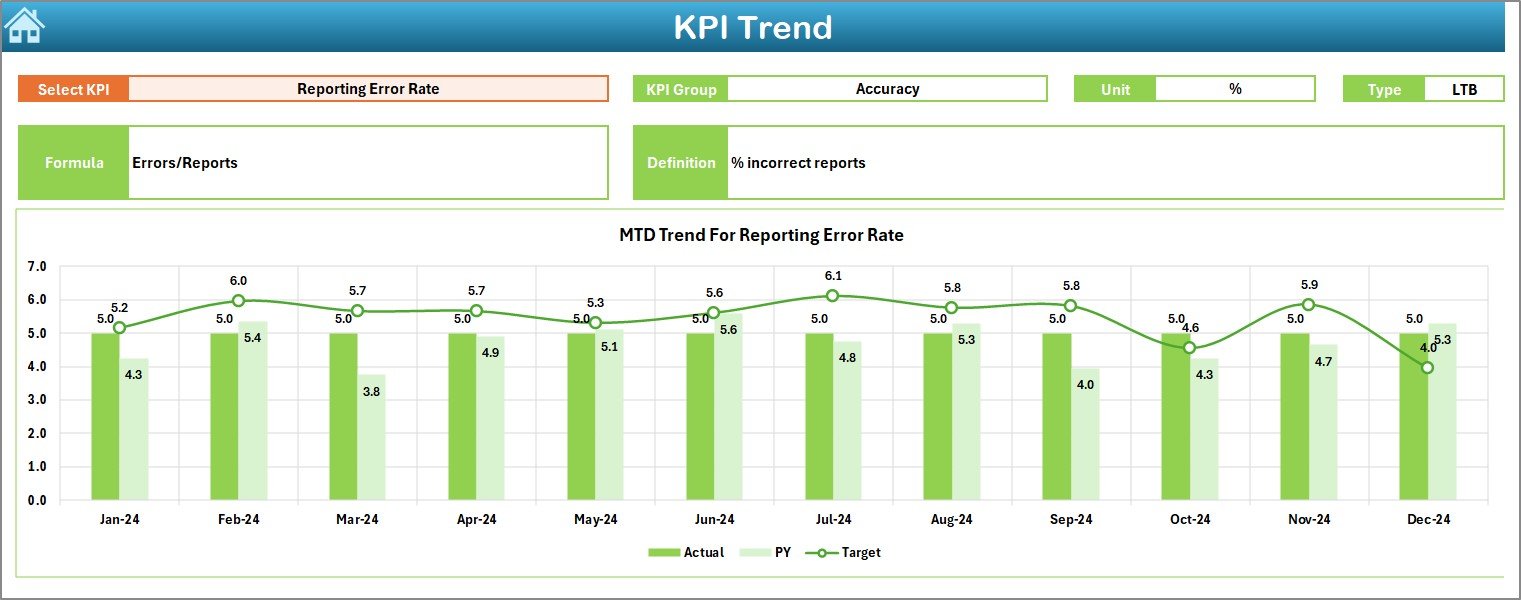
3️⃣ KPI Trend Sheet – Track Month-wise & Year-wise Patterns 📊
This sheet gives labs a deeper understanding of KPI behavior:
-
Select any KPI from a dropdown
-
View KPI group, unit, type, formula, definition
-
Two trend charts:
-
MTD Trend Chart – Actual vs Target vs Previous Year
-
YTD Trend Chart – Yearly cumulative performance
-
These visuals help labs detect:
-
Delays in turnaround time
-
Dip in accuracy or QC rates
-
Increase in patient load
-
Equipment performance issues
Trends reveal problems earlier—before they affect patients.
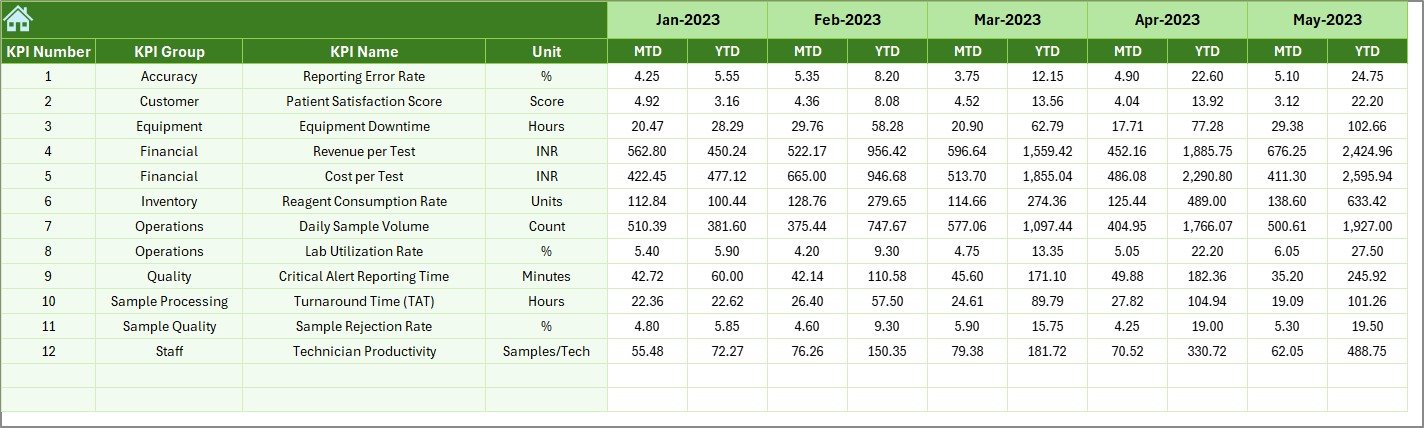
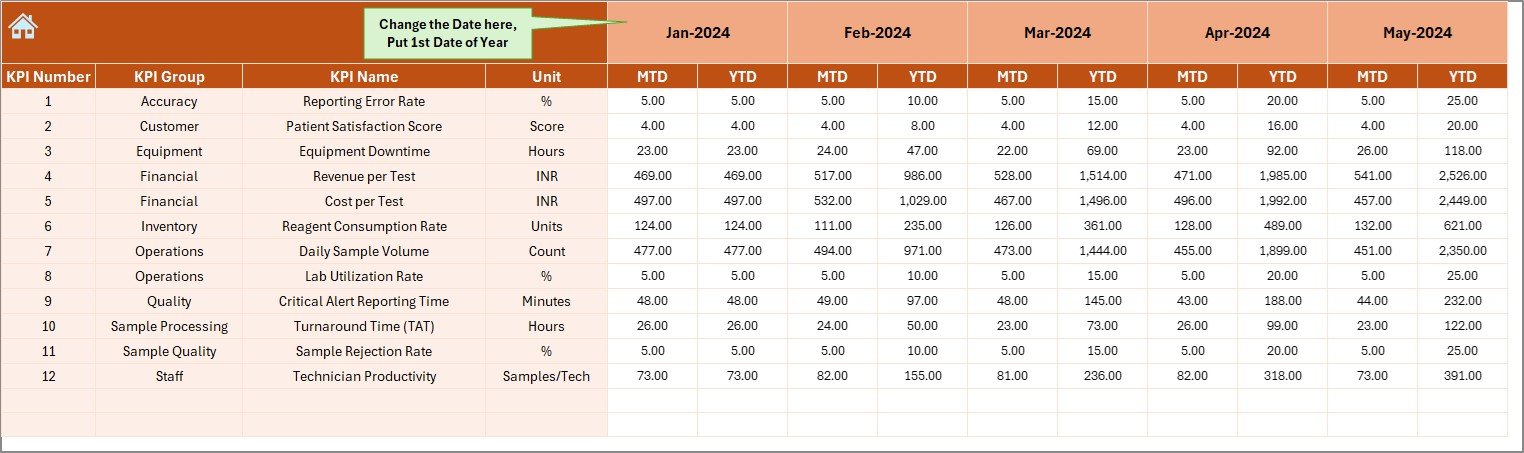
4️⃣ Actual Numbers Input Sheet – Enter Real Performance Data ✍️
A user-friendly sheet to enter:
-
KPI Name
-
Month
-
Actual MTD
-
Actual YTD
Select the first month of the year once, and the sheet auto-generates the full annual sequence. One update refreshes the entire dashboard.
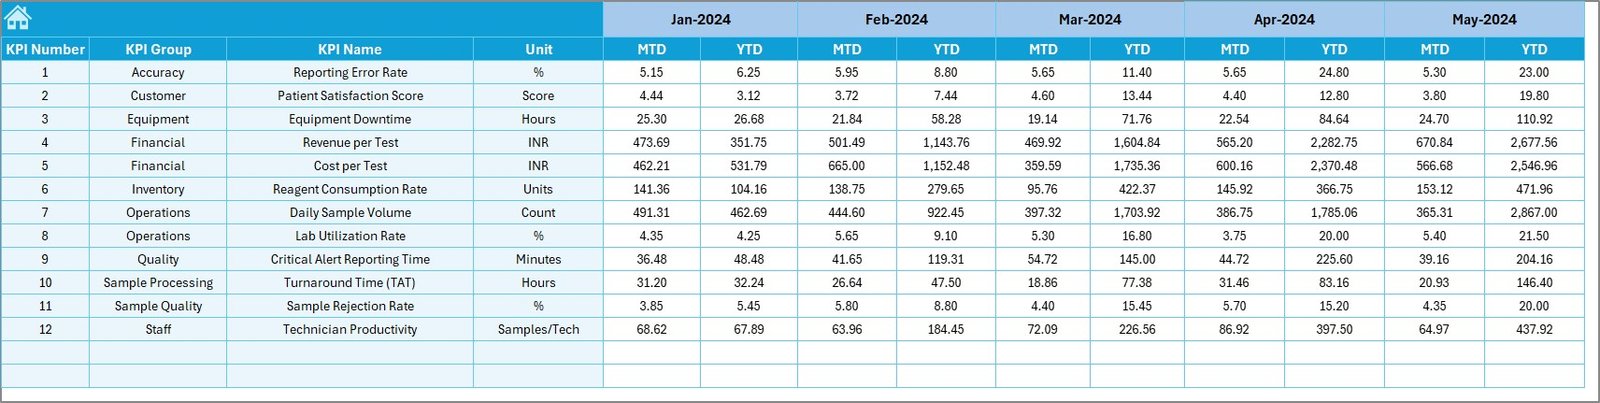
5️⃣ Target Sheet – Define Clear Monthly & Yearly Goals 🎯
Labs enter:
-
KPI Name
-
Month
-
MTD Target
-
YTD Target
Targets help labs analyze whether they are improving or falling behind.
6️⃣ Previous Year Sheet – Track Year-over-Year Performance 🔁
This sheet stores:
-
Previous year’s MTD
-
Previous year’s YTD
Year-over-year comparison is crucial for planning, budgeting, and clinical quality improvement.
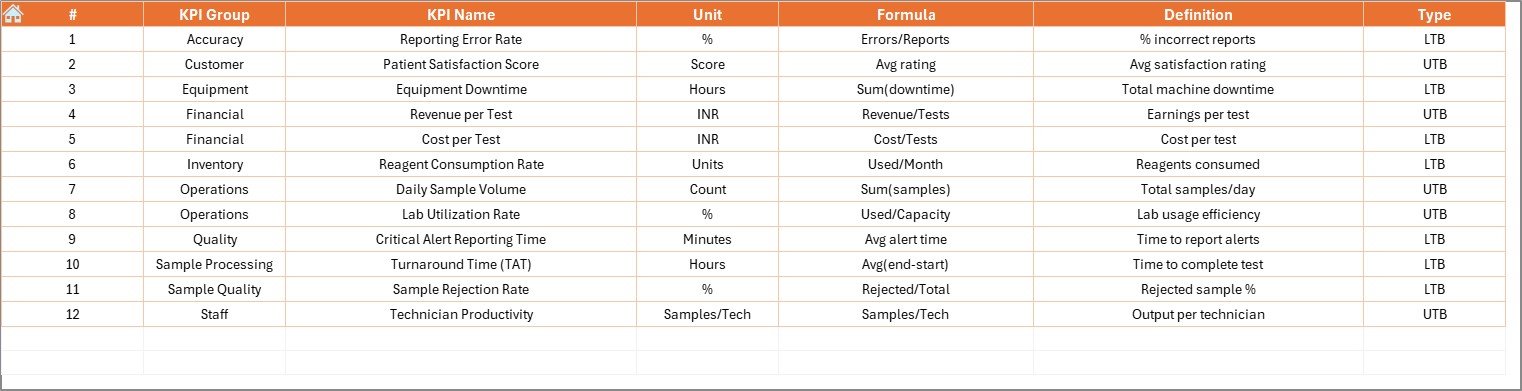
7️⃣ KPI Definition Sheet – Clear Meaning for Every KPI 📘
This sheet includes:
-
KPI Name
-
KPI Group
-
KPI Unit
-
KPI Formula
-
KPI Definition
Clear definitions ensure that everyone—from lab assistants to senior managers—understands KPIs correctly.
📦 What’s Inside the Pathology Labs KPI Dashboard in Excel
You get a full Excel dashboard system, complete with:
✔ Interactive summary page
✔ Monthly & yearly KPI comparisons
✔ Trend analysis charts
✔ Ready-to-use input sheets
✔ KPI definition database
✔ Drop-down filters & conditional formatting
✔ Professional design and easy navigation
No complex formulas required—everything works automatically.
🧰 How to Use the Pathology Labs KPI Dashboard in Excel
1️⃣ Enter actual data into the Actual Numbers sheet
2️⃣ Enter monthly and yearly targets
3️⃣ Enter previous year values
4️⃣ Review KPIs on the Dashboard Sheet
5️⃣ Analyze trends from the trend sheet
6️⃣ Update data monthly for accurate reporting
Even beginners can use this dashboard without training.
👥 Who Can Benefit from This Pathology Labs KPI Dashboard?
🧪 Pathology Lab Owners
Monitor performance, patient volumes, accuracy, and costs.
👩⚕️ Lab Managers & Supervisors
Improve workflows, reduce delays, and maintain compliance.
🏥 Hospitals & Diagnostic Centers
Ensure high-quality testing and reporting.
📊 Healthcare Analysts
Use ready dashboards for detailed analysis.
🎓 Students & Researchers
Understand clinical KPI tracking with real datasets.
If your lab wants accuracy, speed, and full control—this dashboard is the smartest tool you can use.


Reviews
There are no reviews yet.