In today’s fast-moving and partnership-driven business environment, alliances are no longer optional—they are growth engines. However, without clear visibility into partner performance, even the strongest alliances fail to deliver expected results. That is exactly where the Partner Alliances KPI Dashboard in Power BI becomes a game-changing solution.
This ready-to-use dashboard transforms raw alliance data into clear, actionable insights. Instead of juggling multiple Excel files, static reports, or manual reviews, you get a single, interactive Power BI dashboard that tracks targets, performance trends, and year-over-year results—all in one place. As a result, organizations can improve accountability, optimize partner strategies, and maximize alliance ROI with confidence.
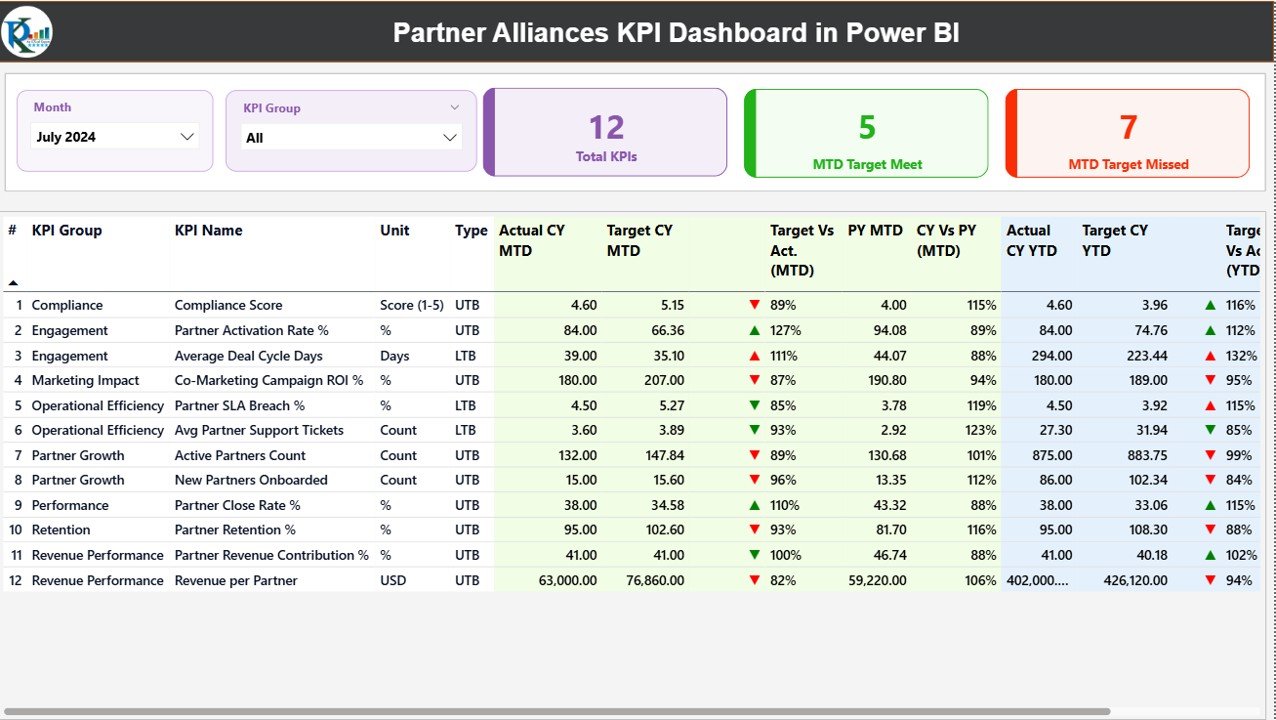
Key Features of Partner Alliances KPI Dashboard in Power BI
📊 Centralized KPI Monitoring – Track all partner alliance KPIs from one interactive dashboard without switching between reports.
📅 Dynamic Month & KPI Group Slicers – Instantly filter data by month and KPI category for focused analysis.
📈 MTD & YTD Performance Tracking – Monitor Month-to-Date and Year-to-Date performance side by side.
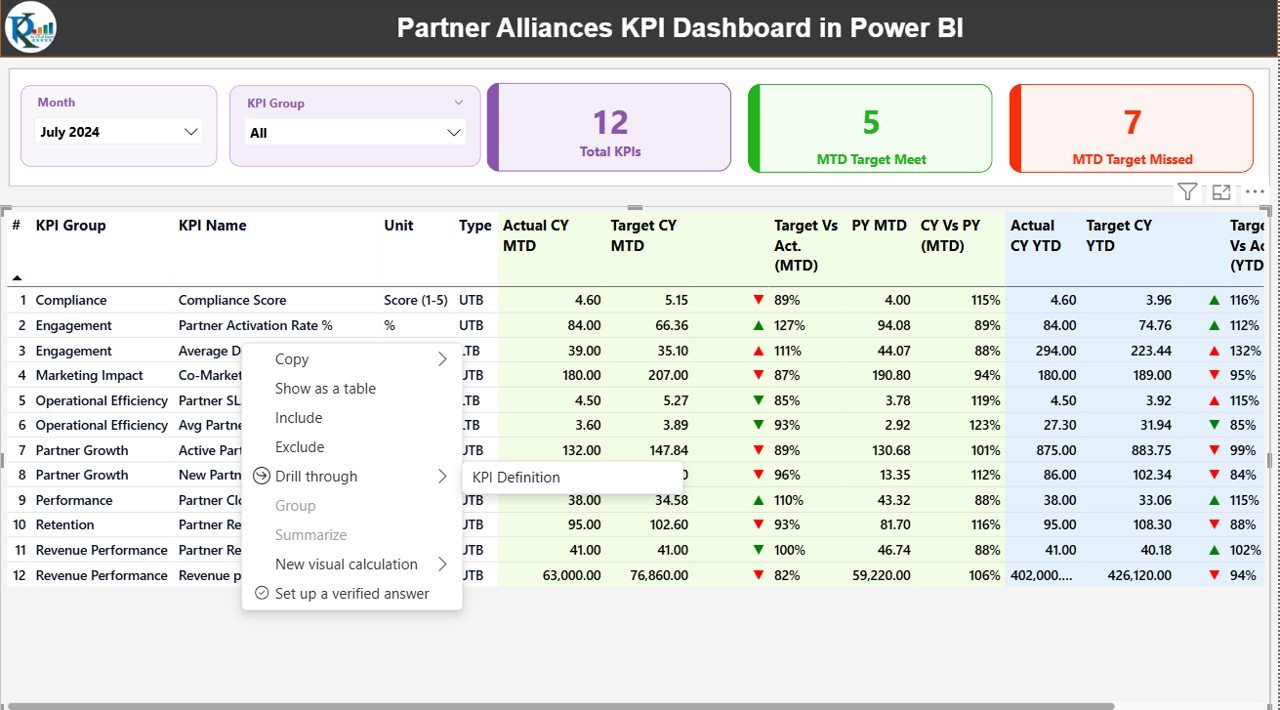
🎯 Target vs Actual Analysis – Instantly identify KPIs that are meeting or missing targets using visual indicators.
📉 Previous Year Comparison – Measure growth and performance improvement with CY vs PY analysis.
🧭 Drill-Through KPI Definitions – Understand formulas, definitions, and KPI intent with a dedicated definition page.
⚙️ Excel-Driven Data Model – Simple Excel input ensures easy updates and scalability.
🚀 Executive-Ready Reporting – Designed for leadership reviews, strategy meetings, and performance discussions.
What’s Inside the Partner Alliances KPI Dashboard
This Power BI solution includes three professionally designed pages, each serving a clear purpose:
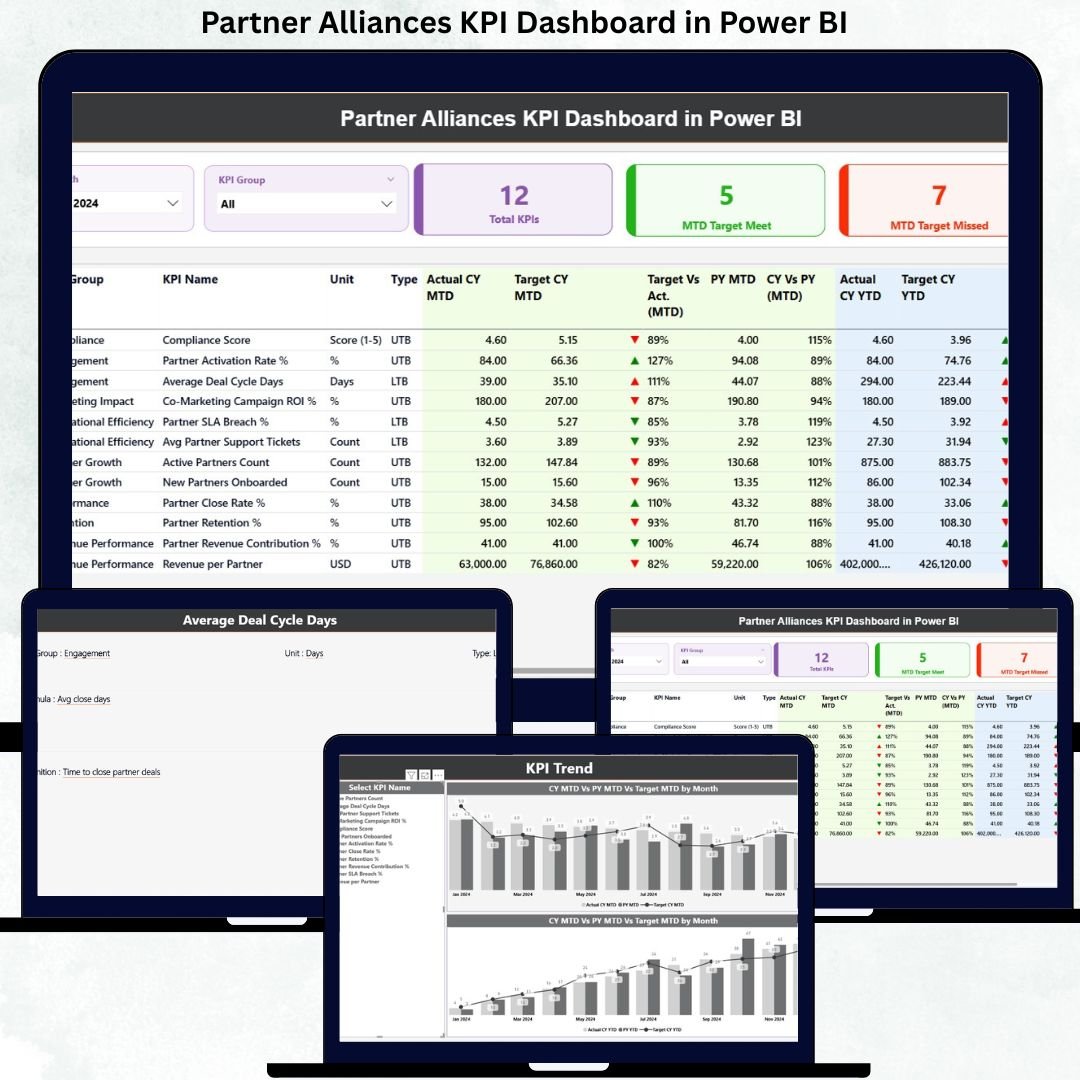
🟢 Summary Page
A complete high-level overview of alliance performance with KPI cards, slicers, and a detailed KPI table showing MTD, YTD, targets, trends, and icons.
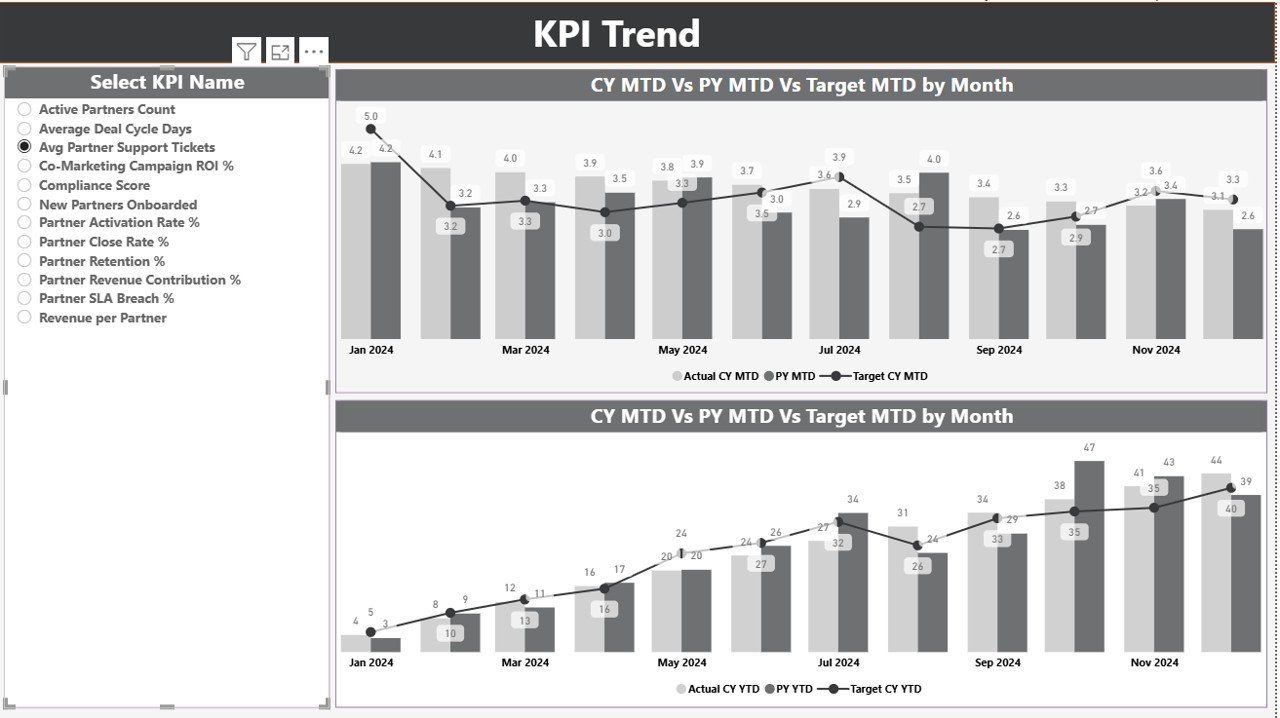
📊 KPI Trend Page
Visual combo charts comparing Current Year Actuals, Previous Year Actuals, and Targets for both MTD and YTD performance—perfect for spotting trends and gaps.
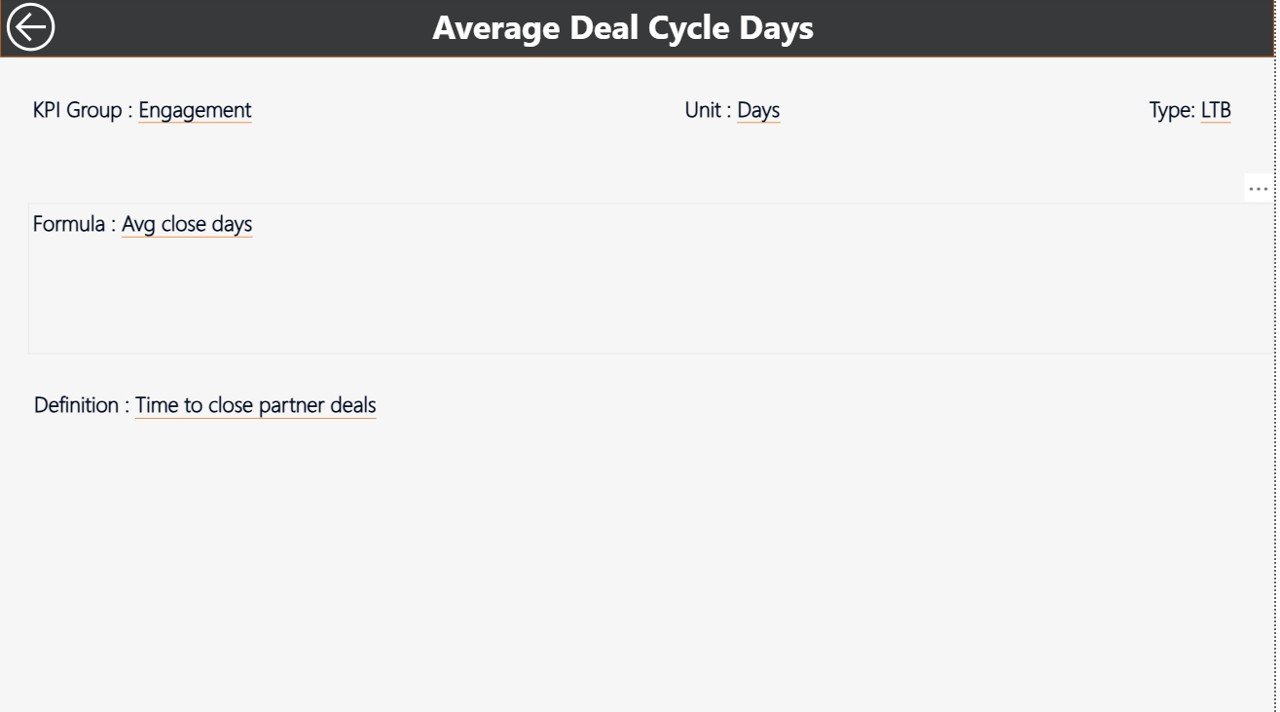
📘 KPI Definition Page
A drill-through reference page displaying KPI formulas, definitions, units, and performance logic to ensure clarity across teams.
Additionally, the dashboard connects to a structured Excel file containing:
-
Input_Actual sheet
-
Input_Target sheet
-
KPI Definition master sheet
This design keeps the dashboard flexible, scalable, and easy to maintain.
🛠️ How to Use the Partner Alliances KPI Dashboard
Using this dashboard is simple and user-friendly:
1️⃣ Update monthly actual values in the Input_Actual Excel sheet
2️⃣ Enter targets in the Input_Target Excel sheet
3️⃣ Maintain KPI details in the KPI Definition sheet
4️⃣ Refresh the Power BI file
5️⃣ Instantly explore insights using slicers, tables, and trend charts
No advanced Power BI skills are required—making it ideal for both technical and non-technical users.
👥 Who Can Benefit from This Partner Alliances KPI Dashboard?
This dashboard is ideal for:
🤝 Alliance & Partner Managers – Track partner success and accountability
📈 Business Development Teams – Identify high-performing and underperforming alliances
🧑💼 Sales & Channel Leaders – Align partnerships with revenue goals
🏢 Corporate Strategy Teams – Measure strategic impact of alliances
📊 Executives & Leadership – Get clear, data-driven insights for decision-making
Whether you manage a few strategic partners or a large partner ecosystem, this dashboard scales with your business.
Click here to read the Detailed blog post
Watch the step-by-step video tutorial:


Reviews
There are no reviews yet.