Managing partner alliances without structured KPI tracking often leads to unclear performance, missed targets, and weak collaboration. The Partner Alliances KPI Dashboard in Excel solves this problem by converting complex alliance data into clear, actionable performance insights—inside Excel.
This ready-to-use dashboard empowers alliance managers, leadership teams, and business development professionals to monitor partner performance, track targets, analyze trends, and drive smarter partnership decisions without any dependency on BI tools or coding.
Designed with simplicity, flexibility, and business impact in mind, this dashboard turns alliance management into a strategic growth engine.
🔑 Key Features of Partner Alliances KPI Dashboard in Excel
✅ Centralized monitoring of all partner alliance KPIs in one dashboard
✅ Month-to-Date (MTD) and Year-to-Date (YTD) performance tracking
✅ Automatic Target vs Actual and Previous Year comparisons
✅ Visual indicators with conditional formatting arrows
✅ Interactive month and KPI selection using dropdowns
✅ Dedicated trend analysis for each KPI
✅ Complete KPI definition and documentation inside Excel
✅ Fully customizable structure and KPIs
📦 What’s Inside the Partner Alliances KPI Dashboard in Excel
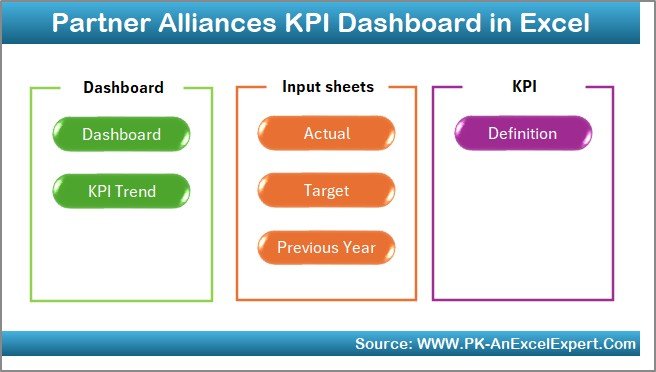
This professional Excel dashboard consists of 7 well-structured worksheets, each designed for a specific purpose:
📊 Summary Page
Acts as a navigation hub with buttons to jump between dashboard sections quickly, improving usability and user experience.
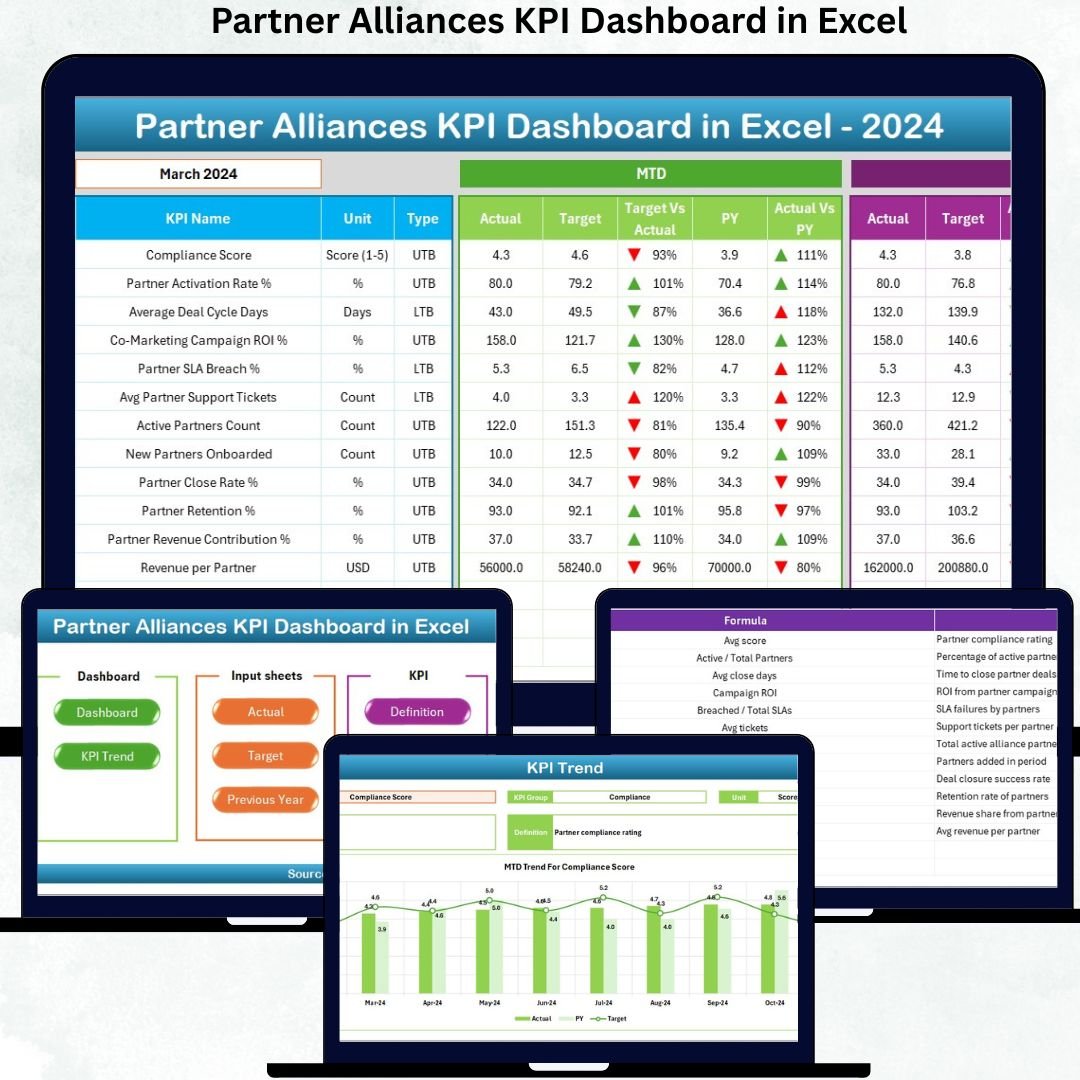
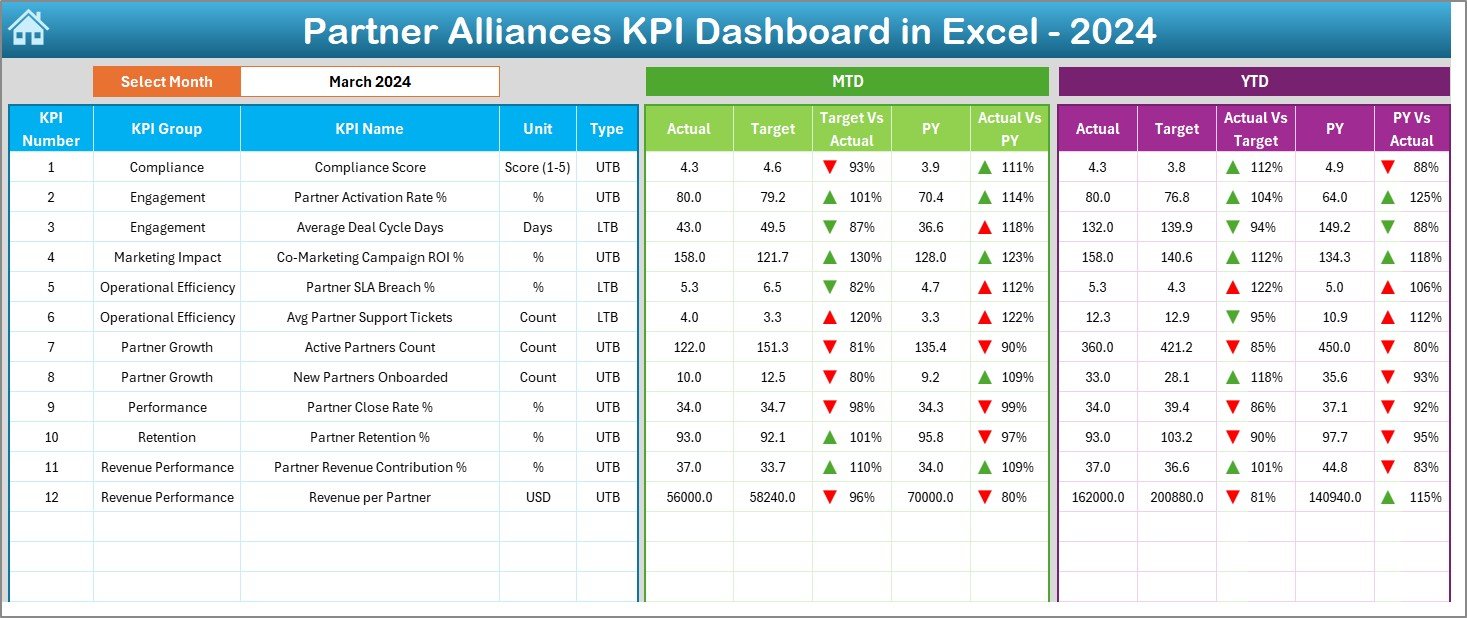
📈 Dashboard Sheet
The main analytical view showing all KPIs in one place. Select the month from cell D3 and instantly view:
-
MTD Actual, Target, Previous Year
-
YTD Actual, Target, Previous Year
-
Target vs Actual variances
-
Previous Year vs Actual comparisons
Performance is highlighted using up/down arrows for quick interpretation.
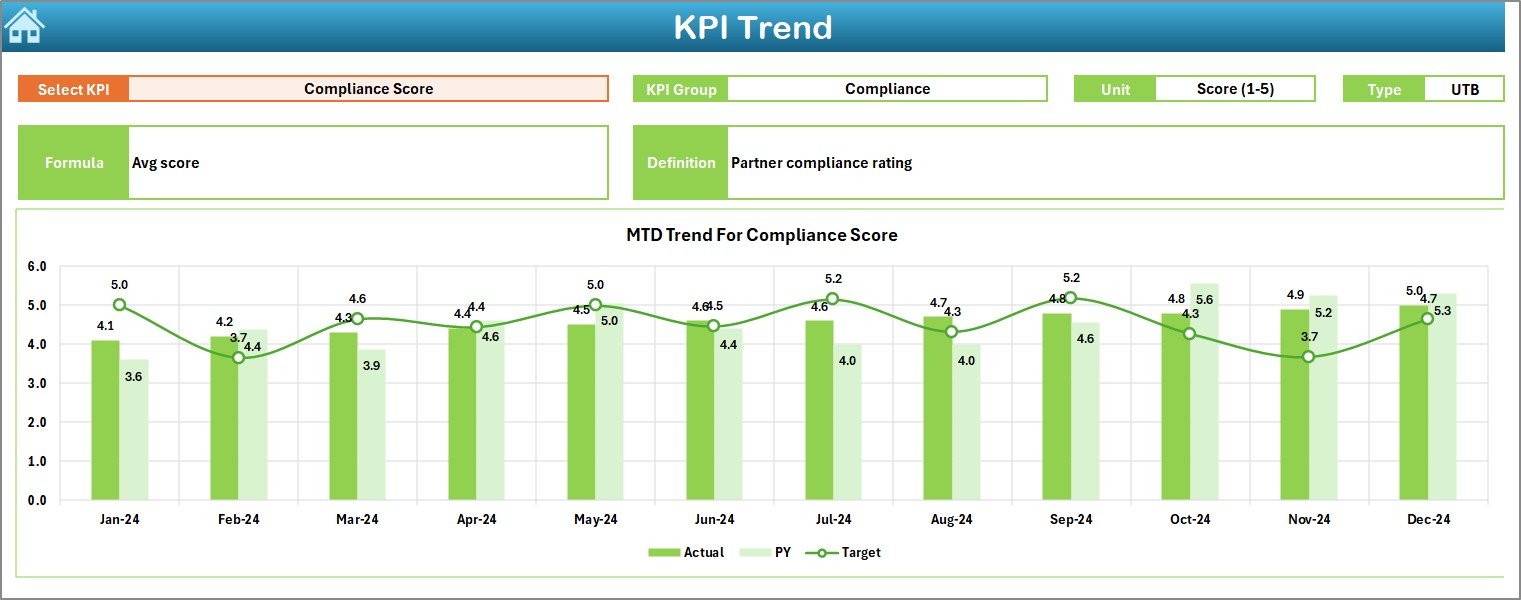
📉 Trend Sheet
Analyze KPI performance over time by selecting a KPI from a dropdown. This sheet displays:
-
KPI group, unit, type (LTB/UTB)
-
KPI formula and definition
-
MTD & YTD trends for Actual, Target, and Previous Year
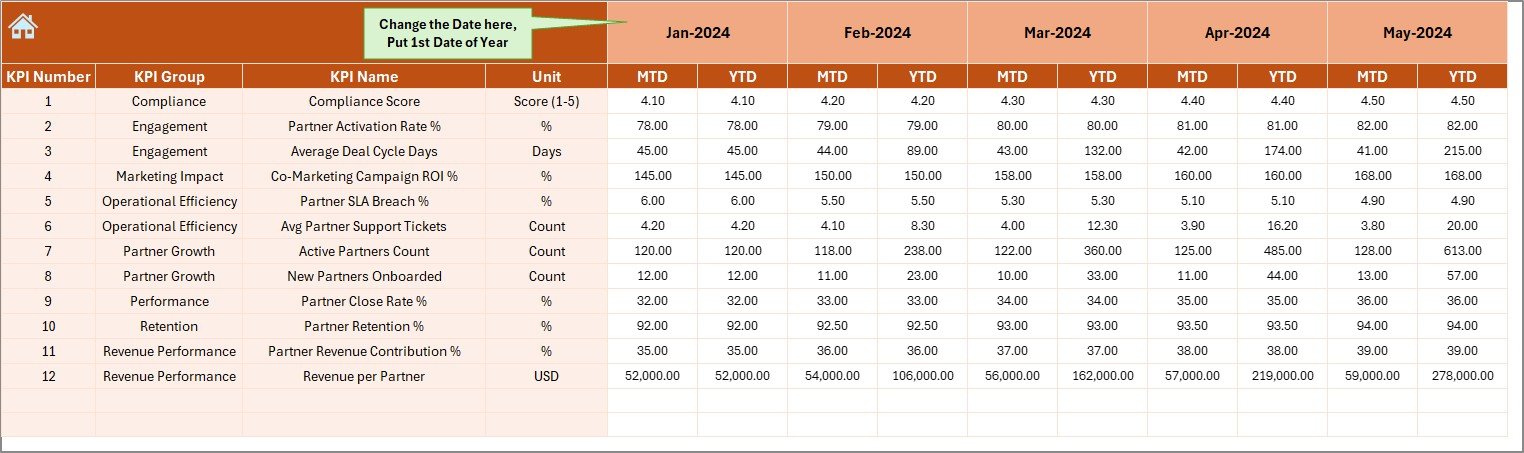
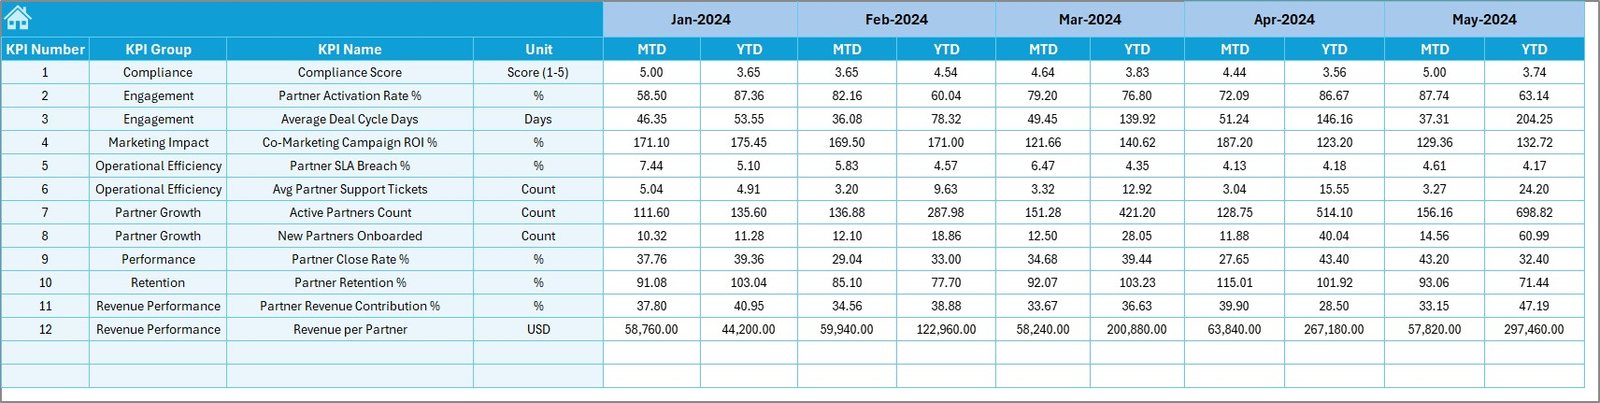
🧮 Actual Numbers Input Sheet
Enter MTD and YTD actual values with full flexibility. Define the financial year start month to auto-adjust calculations.
🎯 Target Sheet
Store planned MTD and YTD targets for each KPI to enable accurate benchmarking and goal tracking.
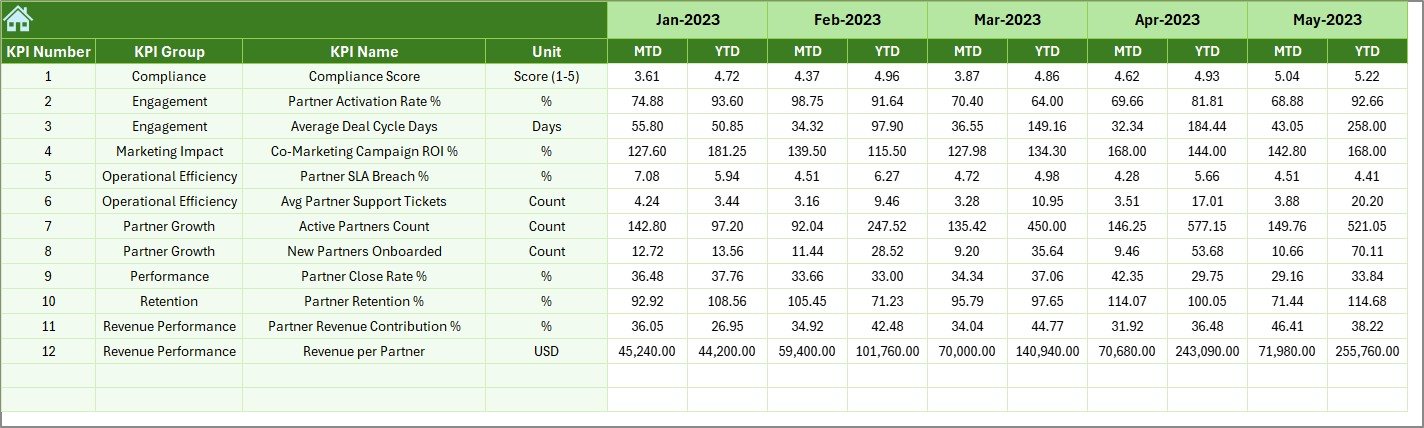
📅 Previous Year Numbers Sheet
Input historical data to enable year-over-year performance comparison and trend analysis.
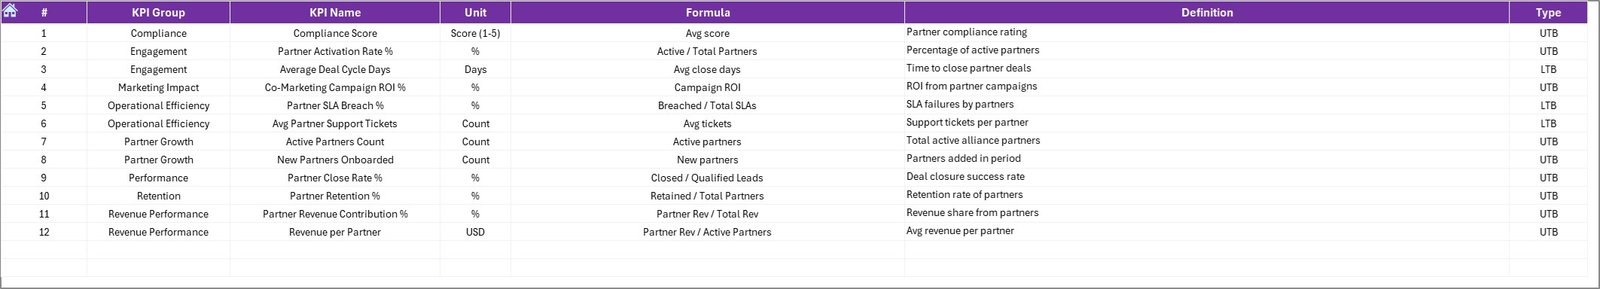
📘 KPI Definition Sheet
A reference guide containing KPI names, groups, units, formulas, and definitions—ensuring clarity and consistency.
▶️ How to Use the Partner Alliances KPI Dashboard in Excel
Using this dashboard is simple:
1️⃣ Enter actual KPI values in the Actual Input Sheet
2️⃣ Define targets in the Target Sheet
3️⃣ Add previous year data for YoY analysis
4️⃣ Select a month from the dashboard dropdown
5️⃣ Instantly analyze MTD and YTD performance
6️⃣ Review trends, variances, and performance gaps
No advanced Excel knowledge required—basic Excel skills are more than enough.
👥 Who Can Benefit from This Partner Alliances KPI Dashboard in Excel
This dashboard is ideal for:
👔 Partnership Managers
🤝 Channel & Alliance Managers
📈 Business Development Teams
📊 Sales Operations Teams
🧠 Strategy & Planning Teams
🏢 CXOs and Leadership
If your organization works with partners, resellers, distributors, or alliances, this dashboard delivers instant value.
📎 Click here to read the Detailed Blog Post
Watch the step-by-step video tutorial:


Reviews
There are no reviews yet.