In today’s highly competitive outsourcing industry, performance is everything. Business Process Outsourcing (BPO) and Knowledge Process Outsourcing (KPO) organizations handle large teams, multiple clients, strict SLAs, and demanding productivity targets. Outsourcing (BPO and KPO) KPI Dashboard in Excel However, many outsourcing companies still rely on scattered Excel sheets, manual calculations, and delayed reports. As a result, productivity gaps, SLA risks, and quality issues often go unnoticed.
Outsourcing (BPO and KPO) KPI Dashboard in Excel That is exactly why the Outsourcing (BPO and KPO) KPI Dashboard in Excel becomes a powerful and practical solution 🚀.
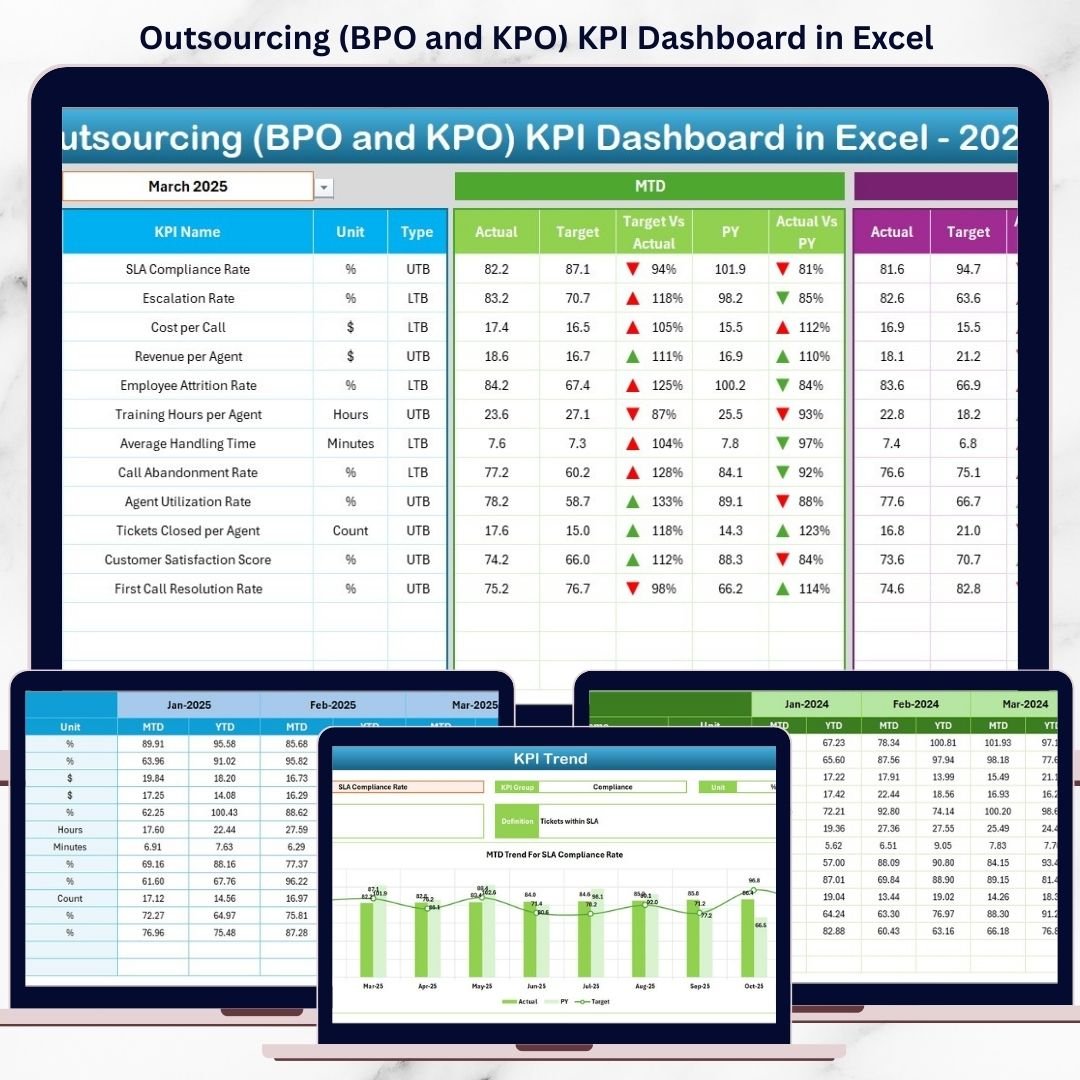
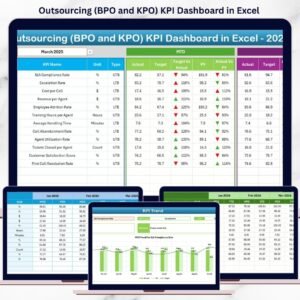
This ready-to-use Excel dashboard consolidates all critical outsourcing KPIs into one interactive performance management system. Instead of reviewing multiple reports for operations, quality, finance, and service levels, managers can track everything from a single dashboard. Moreover, the dashboard provides MTD (Month-to-Date) and YTD (Year-to-Date) performance visibility, trend analysis, and visual indicators to support faster decisions.
Built entirely in Microsoft Excel, this dashboard is affordable, flexible, and easy to customize—making it ideal for both small outsourcing firms and large delivery centers.
⭐ Key Features of Outsourcing (BPO and KPO) KPI Dashboard in Excel
📊 Centralized KPI Monitoring
Track productivity, quality, financial, and SLA KPIs in one dashboard.
⏱️ MTD & YTD Performance Tracking
Monitor short-term and long-term performance clearly.
🎯 Target vs Actual Comparison
Instantly identify gaps between planned and actual performance.
📈 Trend Analysis for KPIs
Analyze historical performance patterns using MTD and YTD trend charts.
⚠️ Visual Performance Indicators
Green and red arrows highlight positive and negative performance instantly.
🎛️ Interactive Month Selection
Change the reporting month and update the entire dashboard automatically.
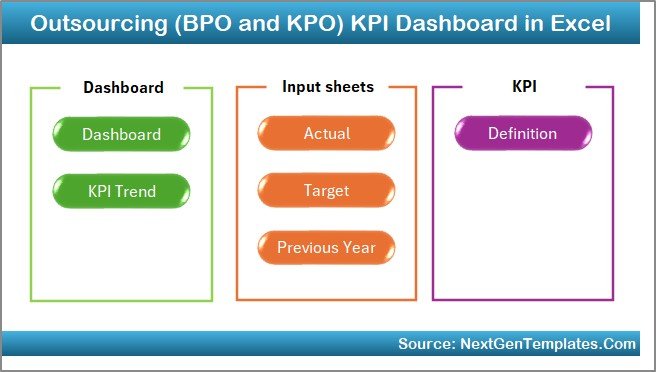
📦 What’s Inside the Outsourcing (BPO and KPO) KPI Dashboard in Excel
This professionally designed Excel file includes 7 structured worksheets, ensuring clarity, accuracy, and ease of use.
🏠 Home Sheet
Acts as the navigation hub with 6 buttons for quick access to all sheets.
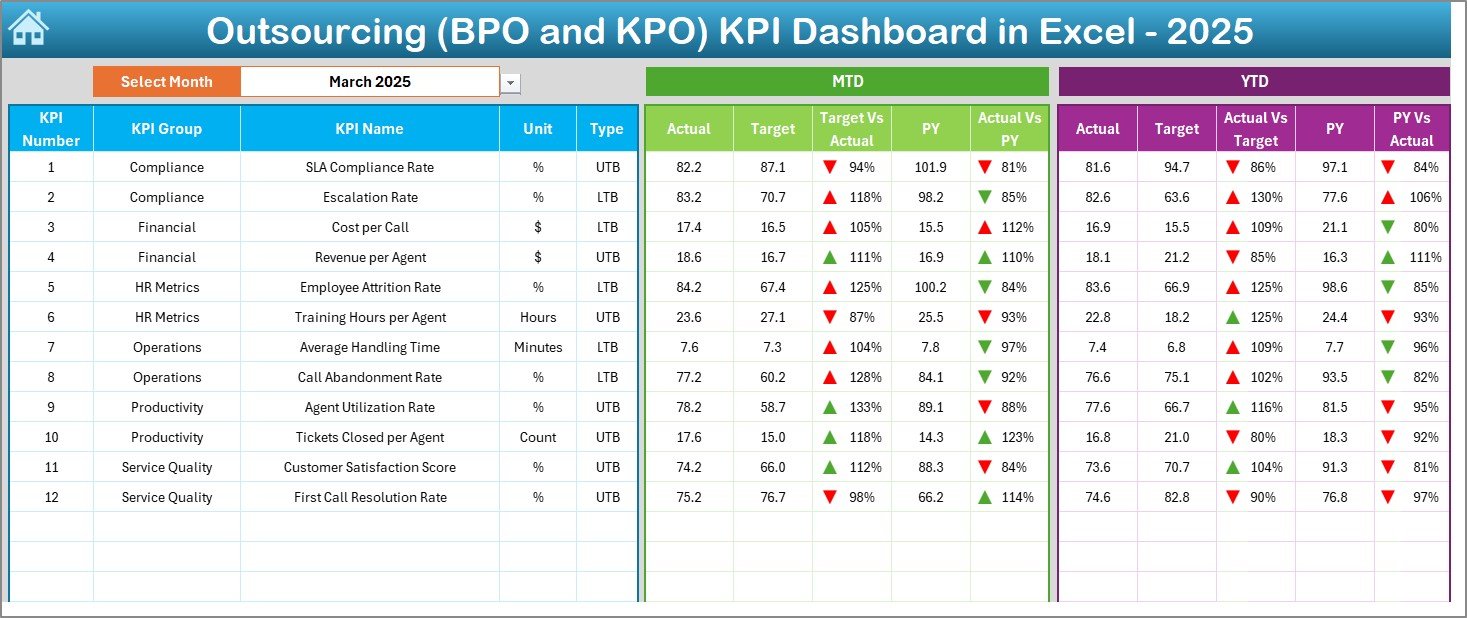
📊 Dashboard Sheet
The main performance view showing:
-
MTD Actual, Target, and Previous Year
-
YTD Actual, Target, and Previous Year
-
Target vs Actual comparisons
-
Previous Year vs Actual comparisons
-
Conditional formatting arrows for performance status
A Month Selector in cell D3 updates the entire dashboard instantly.
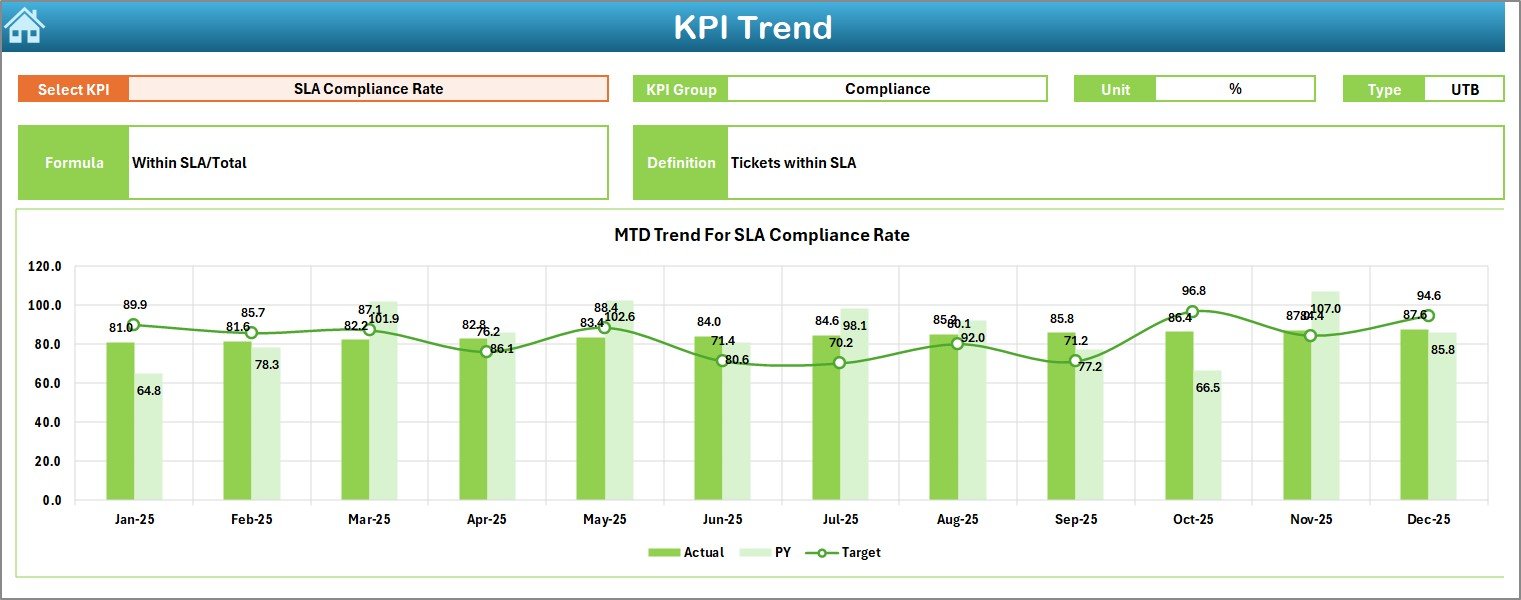
📈 KPI Trend Sheet
Supports deep KPI analysis with:
-
KPI Name dropdown (cell C3)
-
KPI Group, Unit, Type (LTB/UTB)
-
KPI Formula and Definition
-
MTD Trend Chart (Actual, Target, PY)
-
YTD Trend Chart (Actual, Target, PY)
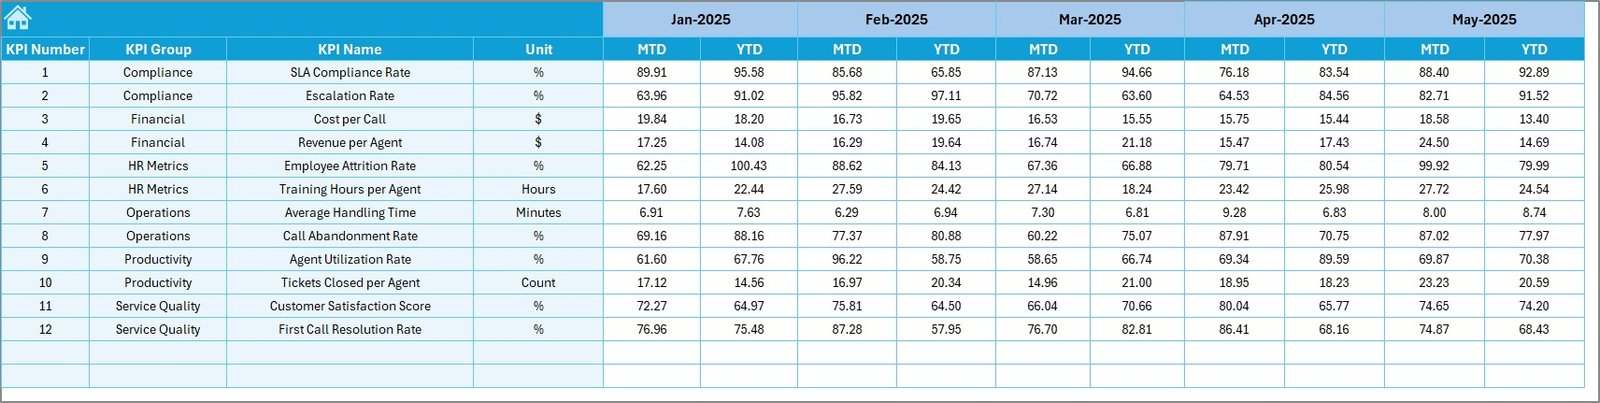
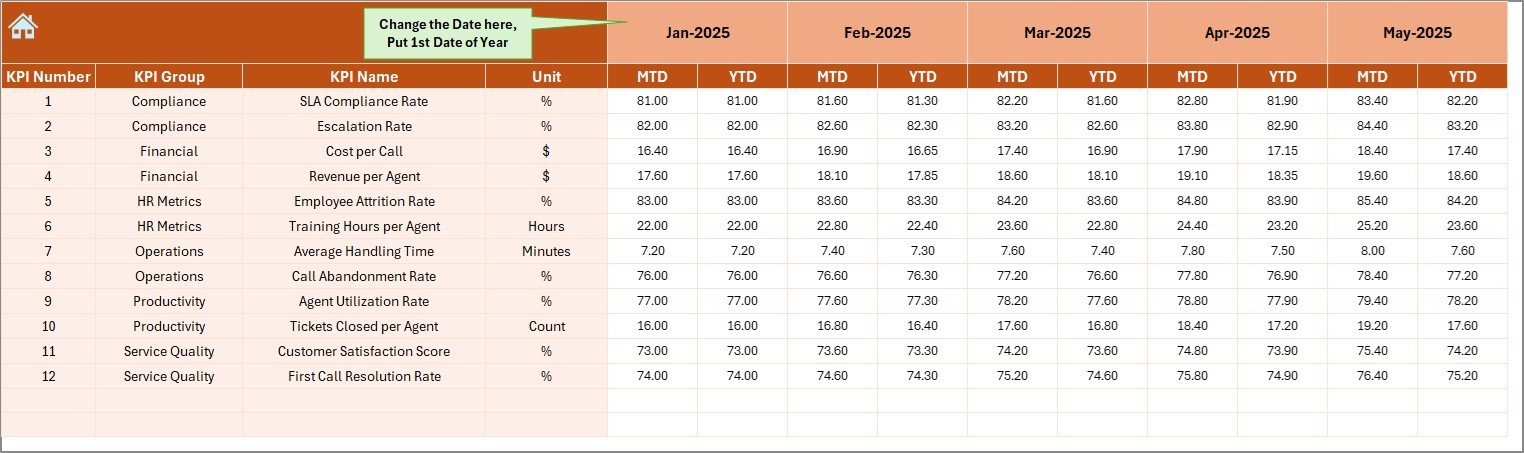
📝 Actual Numbers Input Sheet
Primary data entry sheet where users:
-
Enter MTD and YTD actual values
-
Select the reporting month in cell E1
-
Maintain consistent monthly data
🎯 Target Sheet
Stores planned performance values:
-
Monthly MTD targets
-
Cumulative YTD targets
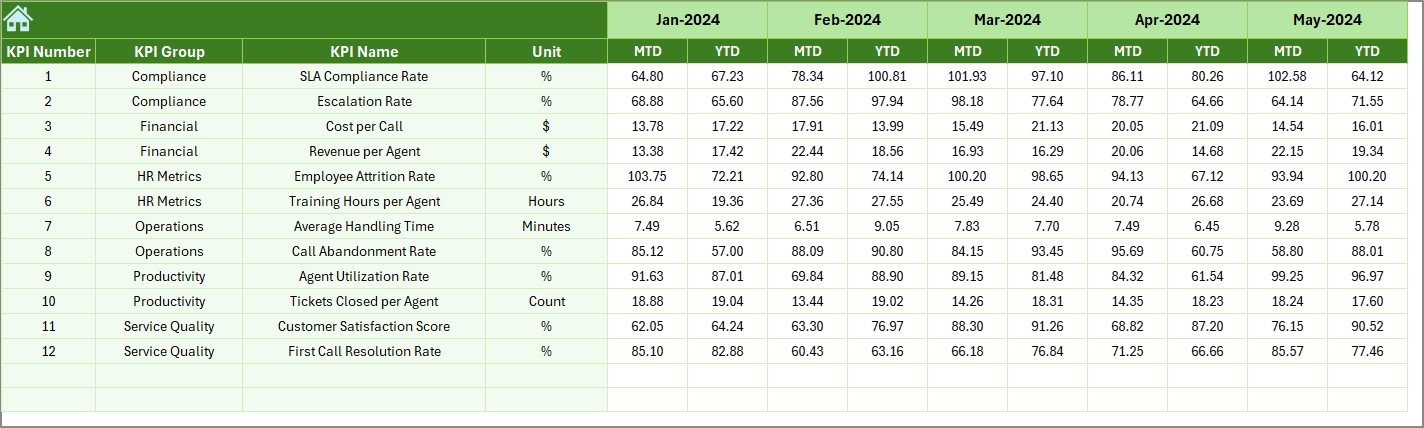
📅 Previous Year Number Sheet
Captures historical performance data:
-
Previous year MTD values
-
Previous year YTD values
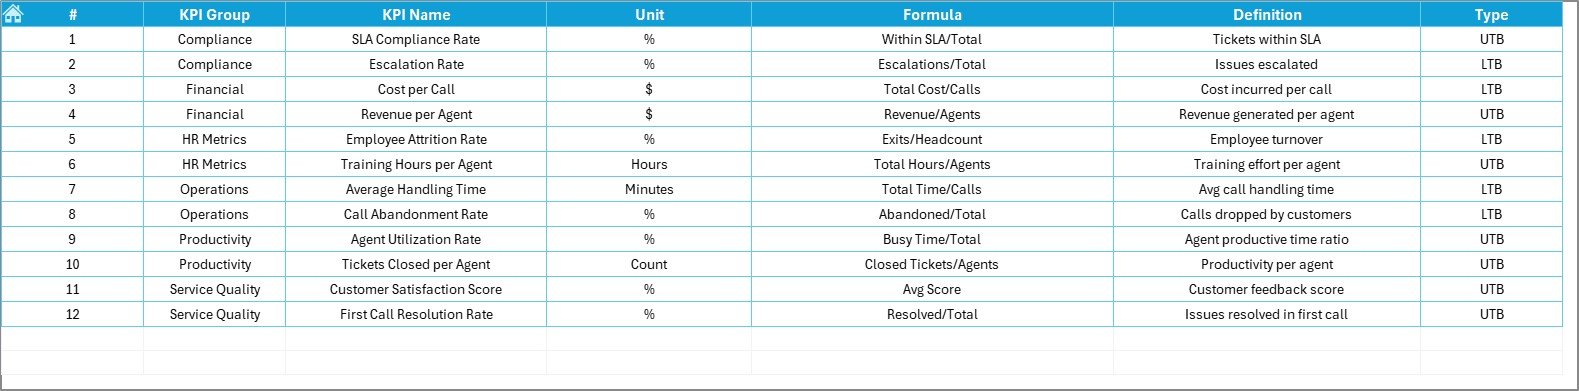
📘 KPI Definition Sheet
Defines KPI governance with:
-
KPI Name
-
KPI Group
-
Unit
-
Formula
-
Definition
🛠️ How to Use the Outsourcing KPI Dashboard in Excel
Using this dashboard is simple:
1️⃣ Enter actual performance data in the Actual Numbers Input sheet
2️⃣ Update targets and previous year data
3️⃣ Select the month from the Dashboard
4️⃣ Review KPI performance using arrows and comparisons
5️⃣ Use the KPI Trend sheet for deeper analysis
Because calculations are automated, reporting becomes fast and error-free.
👥 Who Can Benefit from This Outsourcing KPI Dashboard
This dashboard is ideal for:
📞 BPO & KPO Operations Managers
📦 Delivery Managers
🎯 Quality Managers
💰 Finance & Billing Teams
📊 Process Excellence Teams
👔 Senior Leadership
Any outsourcing organization focused on performance improvement will benefit from this dashboard.


Reviews
There are no reviews yet.