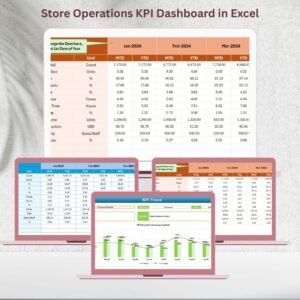
Running outlet stores profitably is not just about offering discounts—it is about tracking the right numbers at the right time. When sales data, inventory figures, and performance metrics remain scattered across multiple Excel files, decision-making becomes slow and risky. That is exactly where the Outlet Stores KPI Dashboard in Excel becomes a game-changer for retail businesses.
This ready-to-use dashboard converts raw outlet store data into clear, actionable insights. It helps you monitor sales performance, margins, inventory movement, targets, and year-on-year comparisons in one centralized system. Instead of spending hours creating reports, you can focus on improving store performance and profitability.
Designed specifically for outlet retail operations, this Excel dashboard works without any complex BI tools. You simply enter data, select a month, and instantly see performance trends that matter most.
🔑 Key Features of Outlet Stores KPI Dashboard in Excel
📊 Centralized KPI Monitoring
Track all critical outlet store KPIs in one interactive dashboard instead of juggling multiple reports.
📅 Dynamic Month Selection
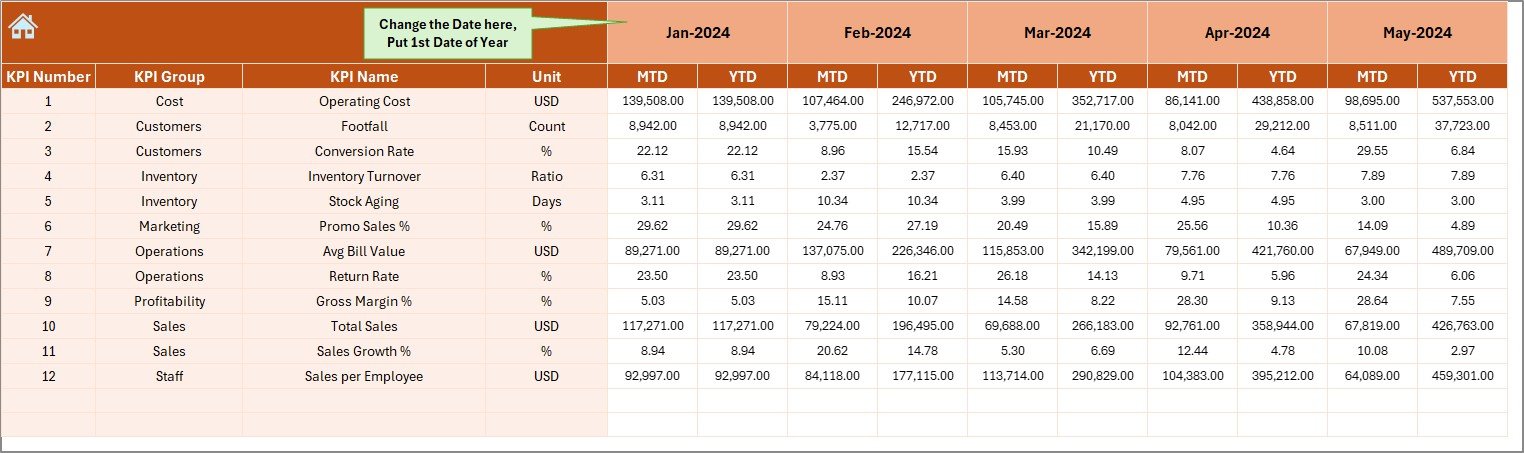
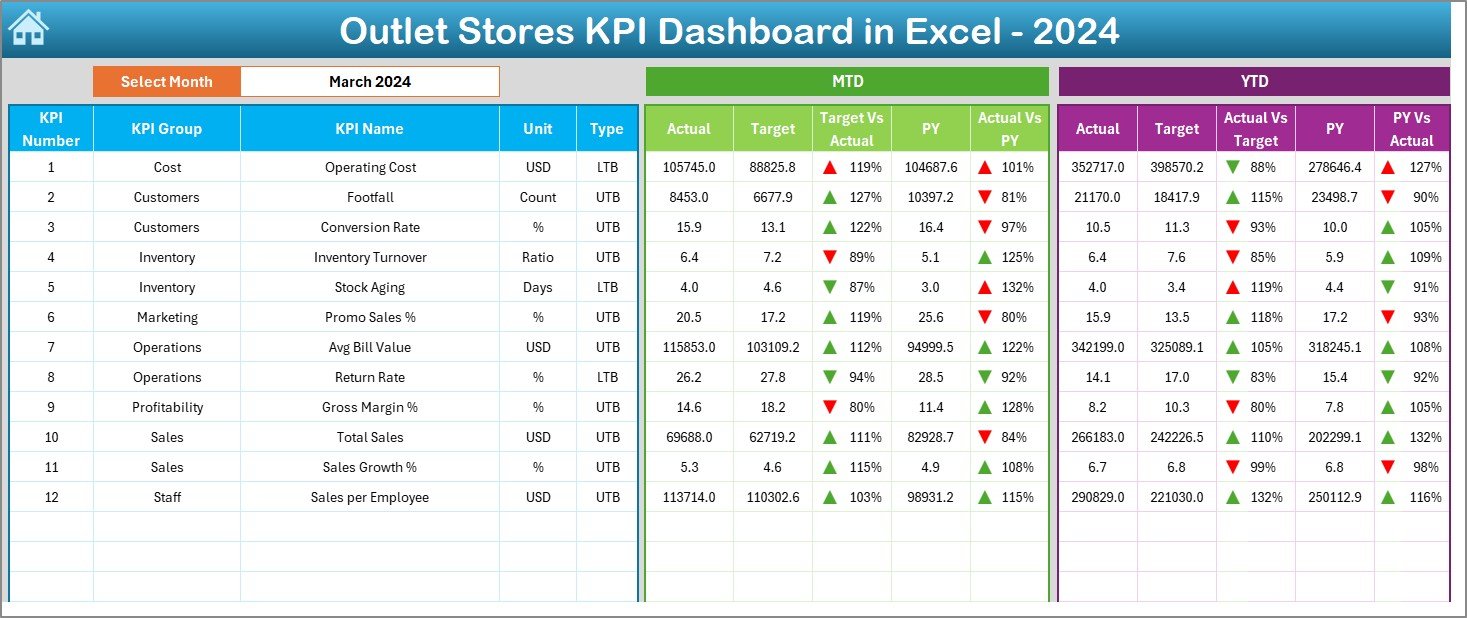
Select any month using a drop-down (cell D3), and the entire dashboard updates automatically.
📈 MTD & YTD Performance Tracking
Analyze Month-to-Date and Year-to-Date results side by side for better control.
🎯 Target vs Actual Comparison
Instantly identify performance gaps using percentage variances and directional arrows.
🔁 Previous Year Comparison
Compare current performance with last year to understand growth, seasonality, and trends.
🚦 Visual Performance Indicators
Conditional formatting with up/down arrows makes performance interpretation quick and intuitive.
🧭 Easy Navigation
A dedicated Summary page with navigation buttons ensures effortless movement across worksheets.
📦 What’s Inside the Outlet Stores KPI Dashboard in Excel
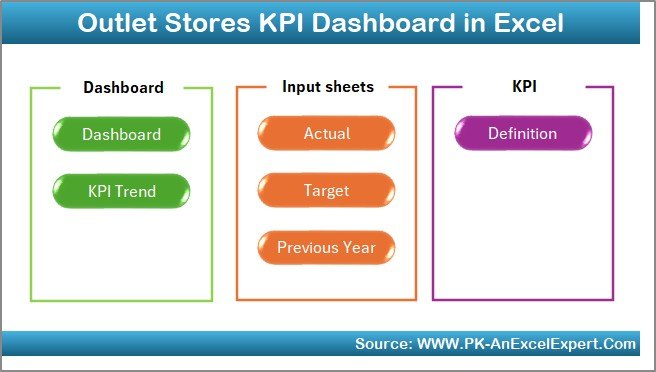
This dashboard includes 7 professionally structured worksheets, each designed for a specific purpose:
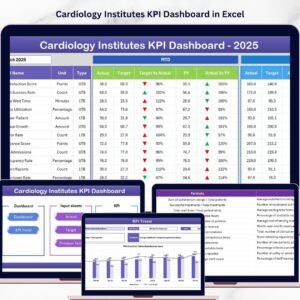
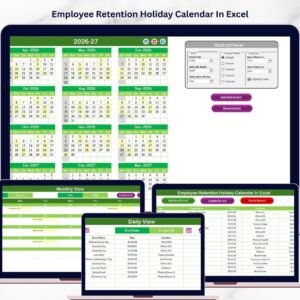
🗂 Summary Page – Acts as an index with one-click navigation to all major sections.
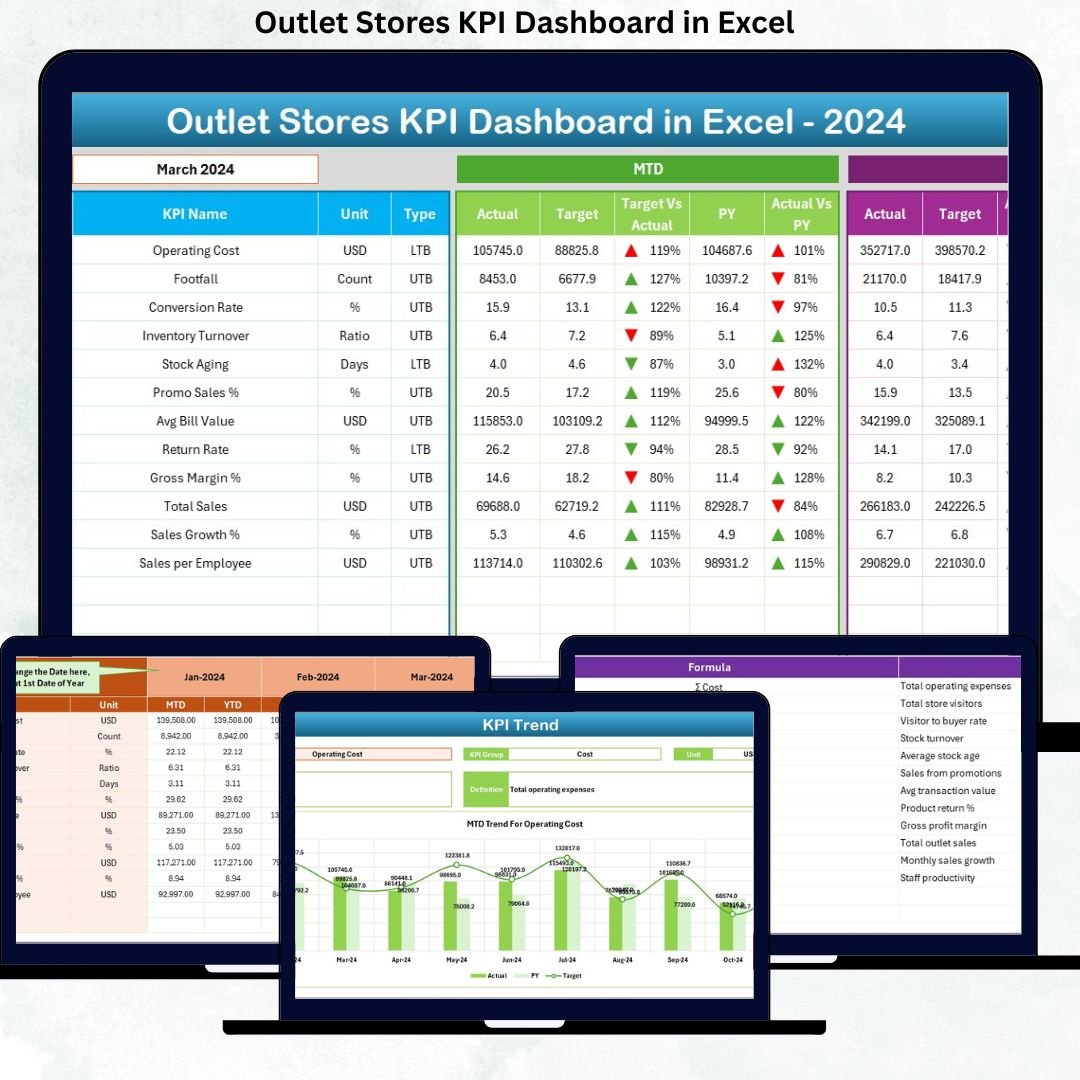
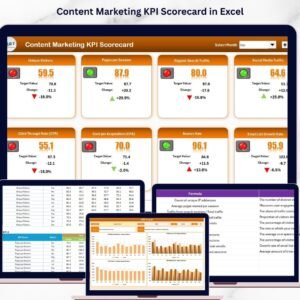
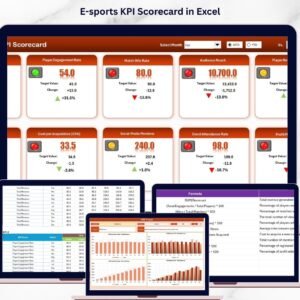
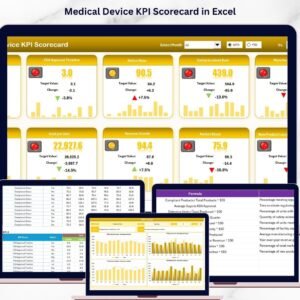
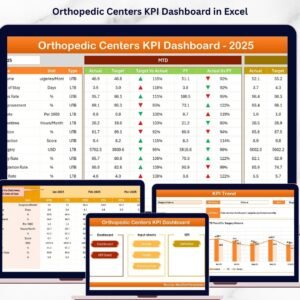
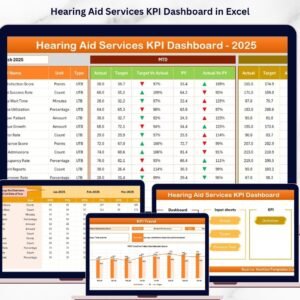
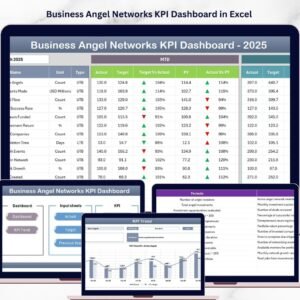
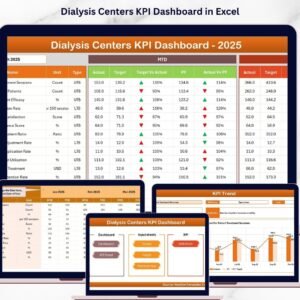
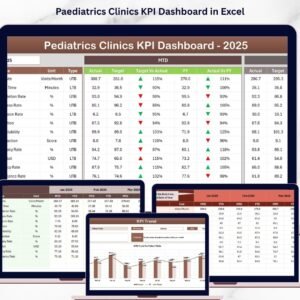
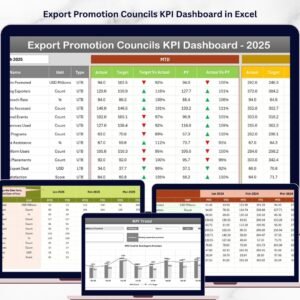
📊 Dashboard Sheet – Displays all KPIs with MTD, YTD, Target, and Previous Year comparisons.
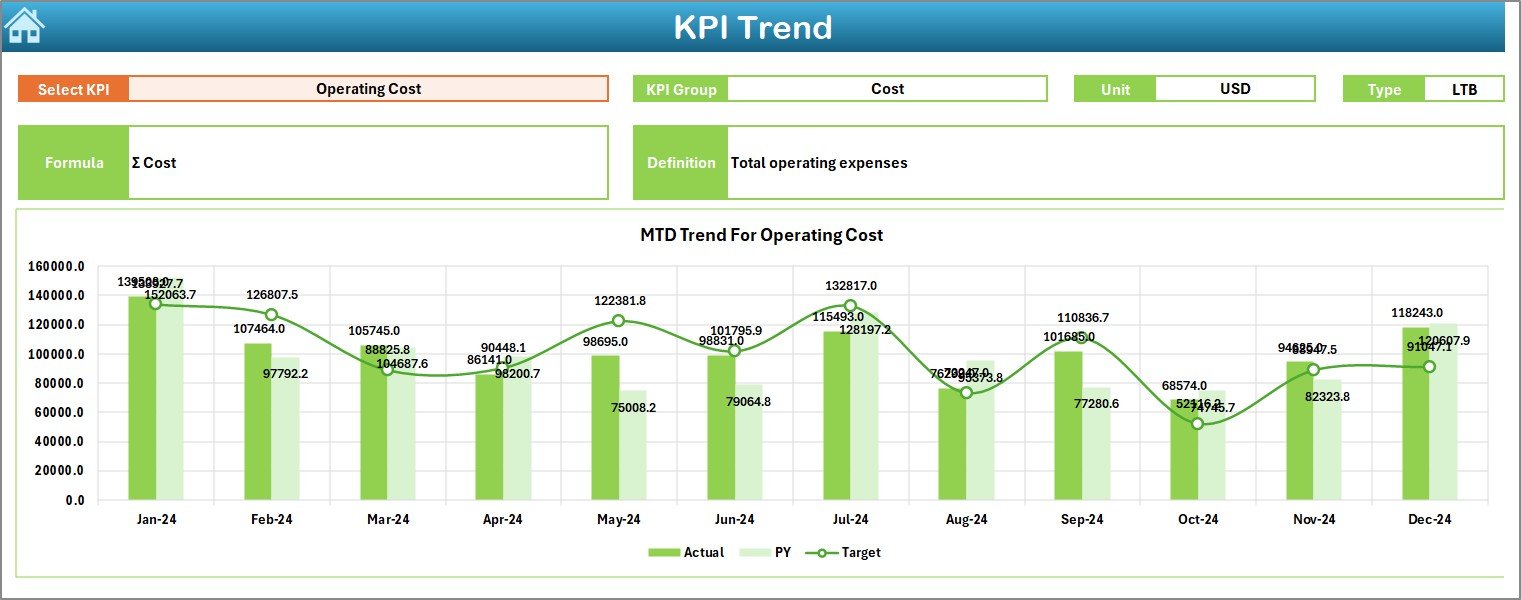
📉 Trend Sheet – Analyze individual KPI trends over time using dynamic charts.
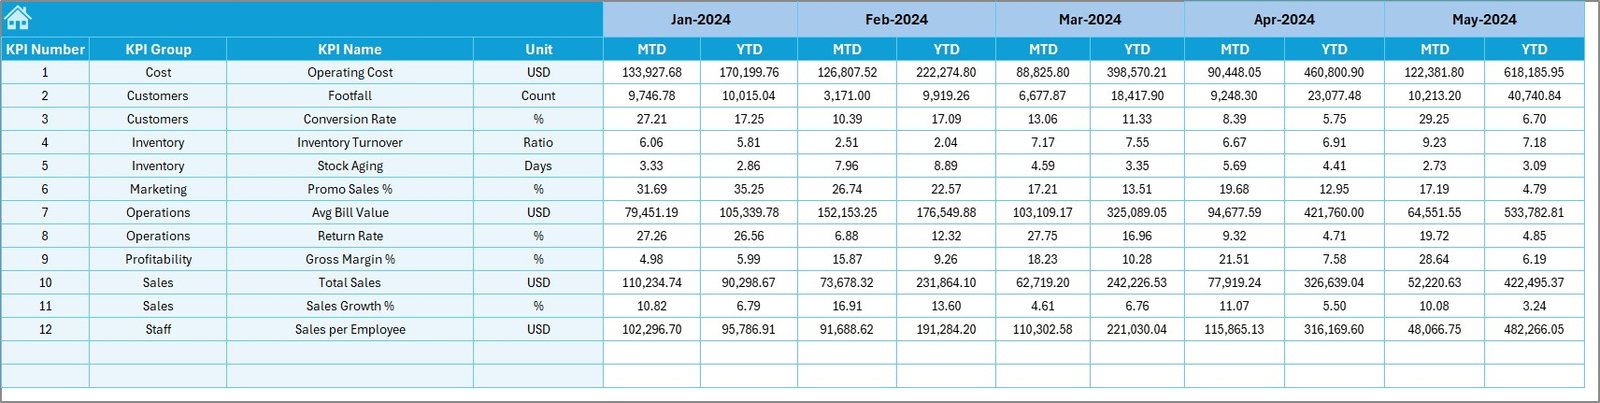
🧾 Actual Numbers Input Sheet – Enter real performance data safely without affecting visuals.
🎯 Target Sheet – Define and manage KPI targets independently.
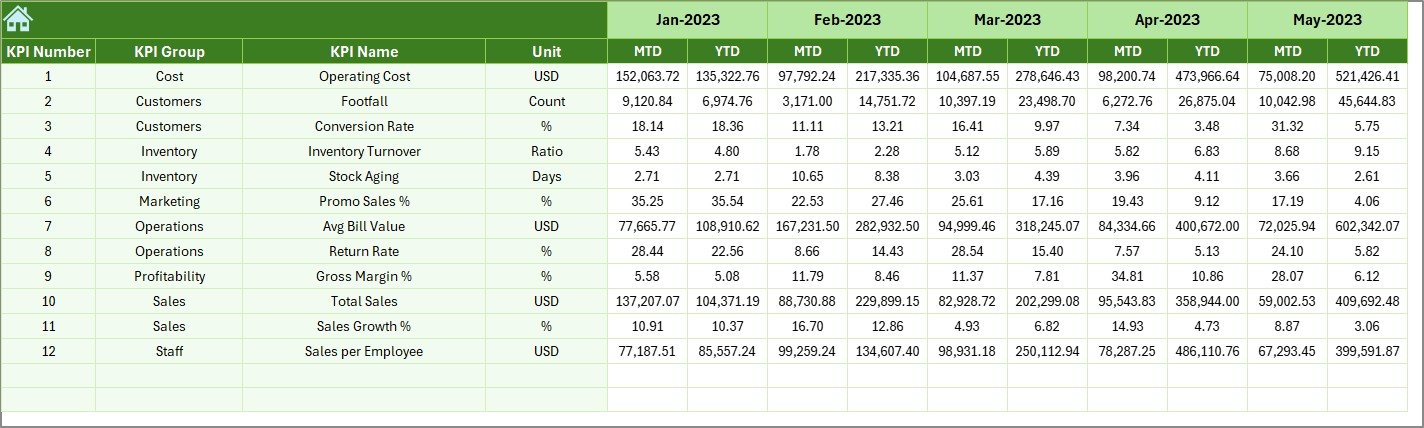
📆 Previous Year Numbers Sheet – Store historical data for accurate year-on-year analysis.
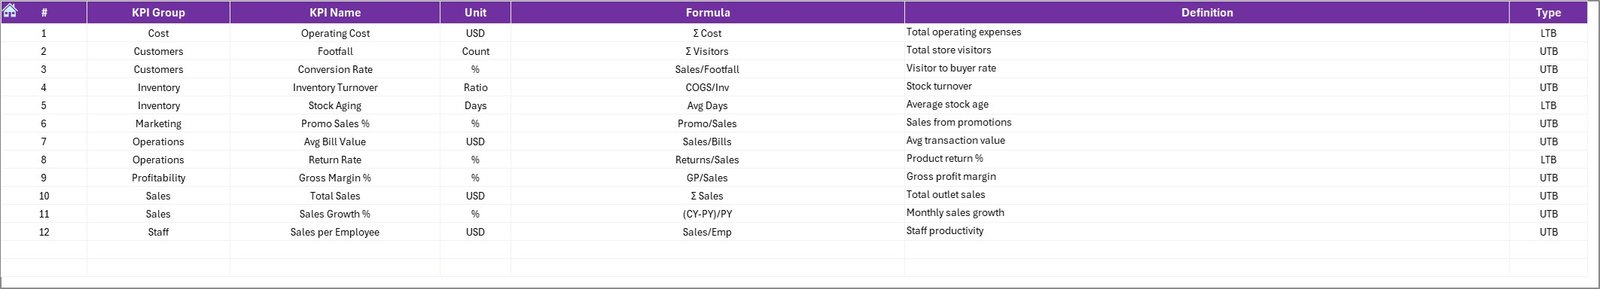
📘 KPI Definition Sheet – Maintain consistent KPI definitions, formulas, and units.
This separation ensures data accuracy, flexibility, and scalability.
🛠 How to Use the Outlet Stores KPI Dashboard in Excel
Using this dashboard is simple—even for non-technical users:
1️⃣ Enter Actual KPI values in the Actual Numbers Input sheet
2️⃣ Define Targets in the Target sheet
3️⃣ Add Previous Year data for comparison
4️⃣ Select the desired Month from the Dashboard
5️⃣ Review KPI performance using charts, percentages, and arrows
6️⃣ Drill deeper using the Trend Sheet for individual KPIs
Within minutes, you gain a clear picture of outlet store performance without manual calculations.
👥 Who Can Benefit from This Outlet Stores KPI Dashboard
🏬 Outlet Store Managers – Track daily and monthly performance easily
📍 Regional Retail Heads – Monitor multiple outlet KPIs at a glance
📊 Sales & Operations Teams – Identify bottlenecks and growth opportunities
💰 Finance & Planning Teams – Analyze margins, targets, and trends
👔 Business Owners – Make confident, data-driven decisions
Because the dashboard uses Excel, no advanced technical skills are required.
Click here to read the Detailed blog post
Watch the step-by-step video tutorial:
Visit our YouTube channel to learn step-by-step video tutorials
👉 YouTube.com/@PKAnExcelExpert


Reviews
There are no reviews yet.