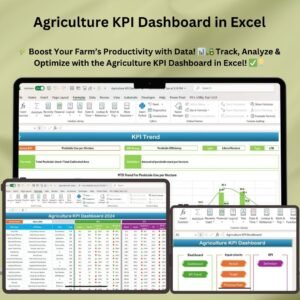
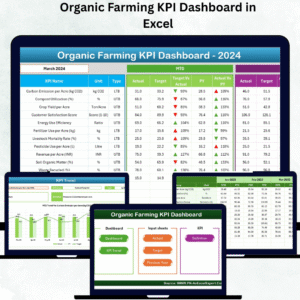
Sustainable agriculture is the future — and data is the foundation of that future. In today’s eco-conscious world, farmers and agricultural organizations must balance productivity, profitability, and environmental responsibility. The Organic Farming KPI Dashboard in Excel helps you do exactly that.
This ready-to-use Excel tool enables farmers, agricultural consultants, and sustainability managers to monitor critical Key Performance Indicators (KPIs) like crop yield, soil health, fertilizer efficiency, water usage, pest control, and profitability — all in one place. Designed for simplicity and clarity, this interactive dashboard turns complex farming data into easy-to-read visual insights.
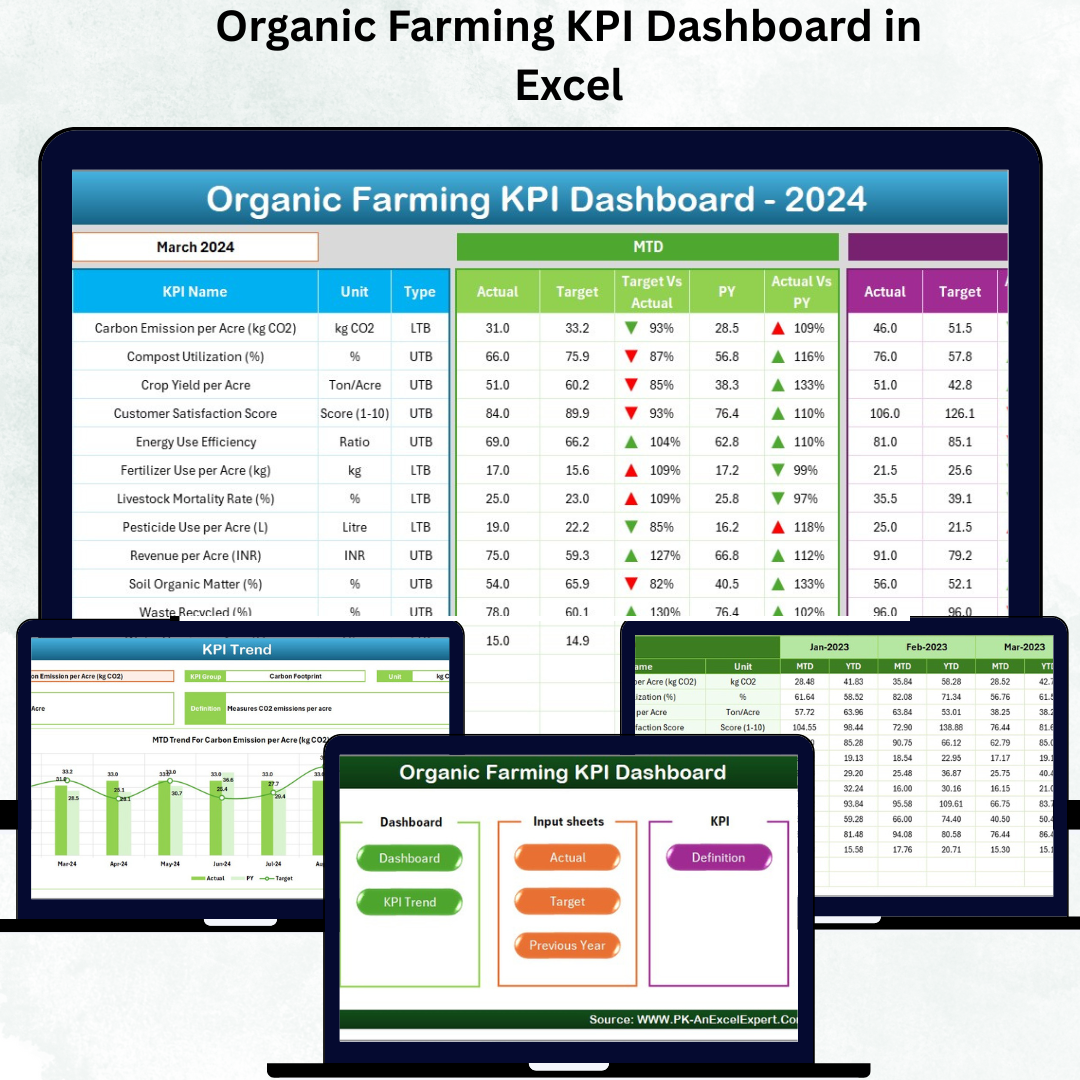
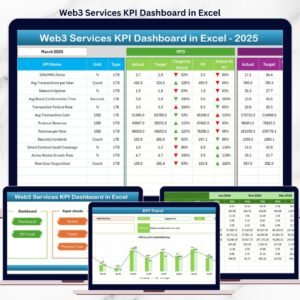
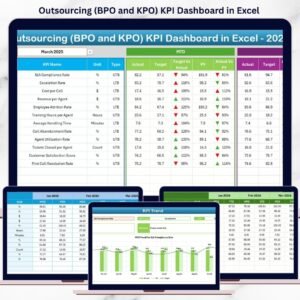
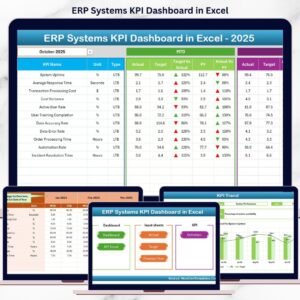
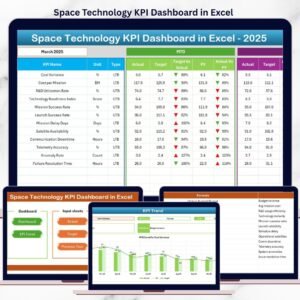
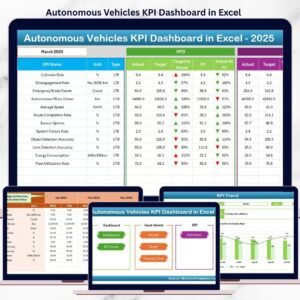
Built for data-driven farming decisions, this Excel dashboard lets users analyze Month-to-Date (MTD), Year-to-Date (YTD), Target, and Previous Year (PY) performance — empowering teams to manage their farms efficiently and sustainably.
⚙️ Key Features of the Organic Farming KPI Dashboard in Excel
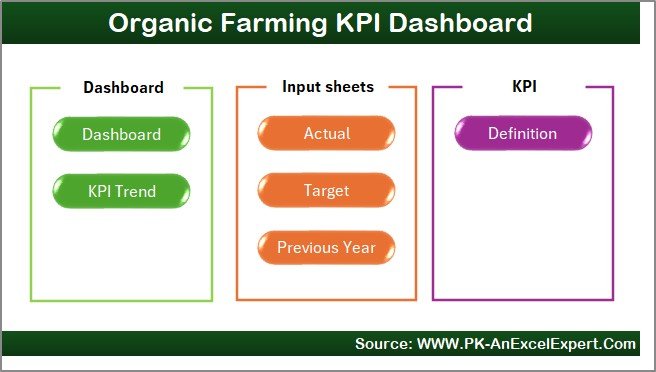
📊 7 Interconnected Worksheets – Home, Dashboard, KPI Trend, Actual Numbers Input, Target, Previous Year, and KPI Definition.
🧭 Interactive Navigation Buttons – Jump between sheets with a single click from the Home page.
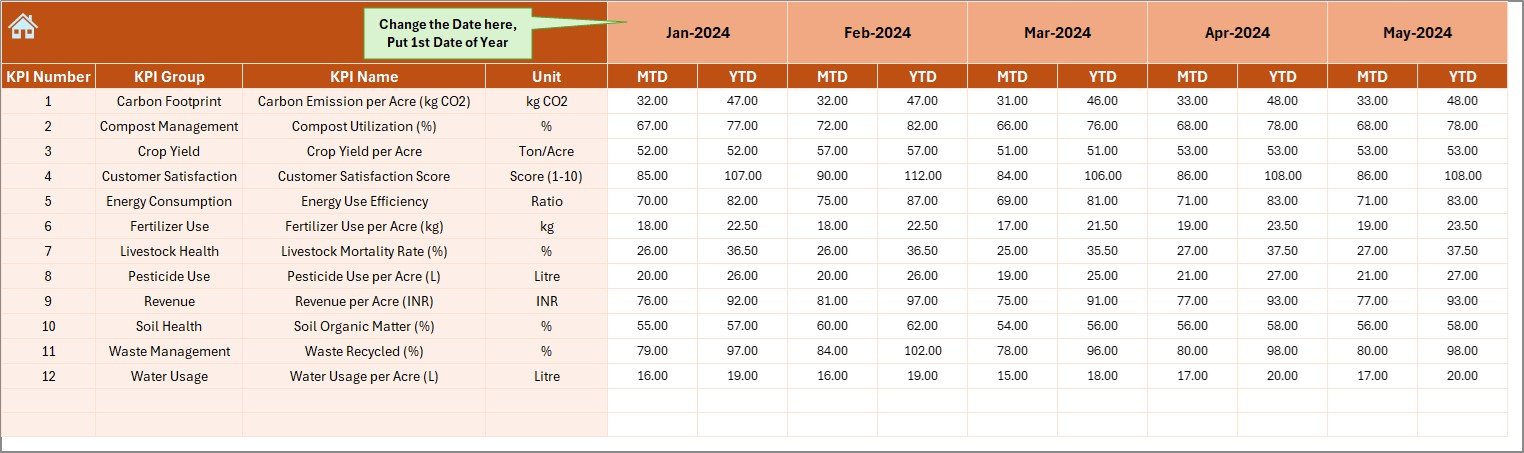
📅 Dynamic Month Selector – Choose any month (cell D3) to instantly view updated MTD and YTD results.
📈 Actual vs Target vs PY Tracking – Evaluate growth with clear visual indicators.
🔺 Conditional Formatting Arrows – Green ▲ for performance improvement, Red ▼ for underperformance.
📘 KPI Documentation Sheet – Includes KPI name, formula, type (UTB/LTB), and unit.
💧 Comprehensive Data Inputs – Track metrics like crop yield, fertilizer use, and water efficiency.
📤 Exportable Reports – Print or share visuals for audits and presentations.
💡 Fully Customizable – Add new KPIs, modify layouts, or integrate with other systems.
🌾 What’s Inside the Dashboard
🏠 1️⃣ Home Sheet – The Control Center
Acts as a navigation hub with buttons to access each sheet instantly — ensuring seamless movement between dashboards and data sheets.
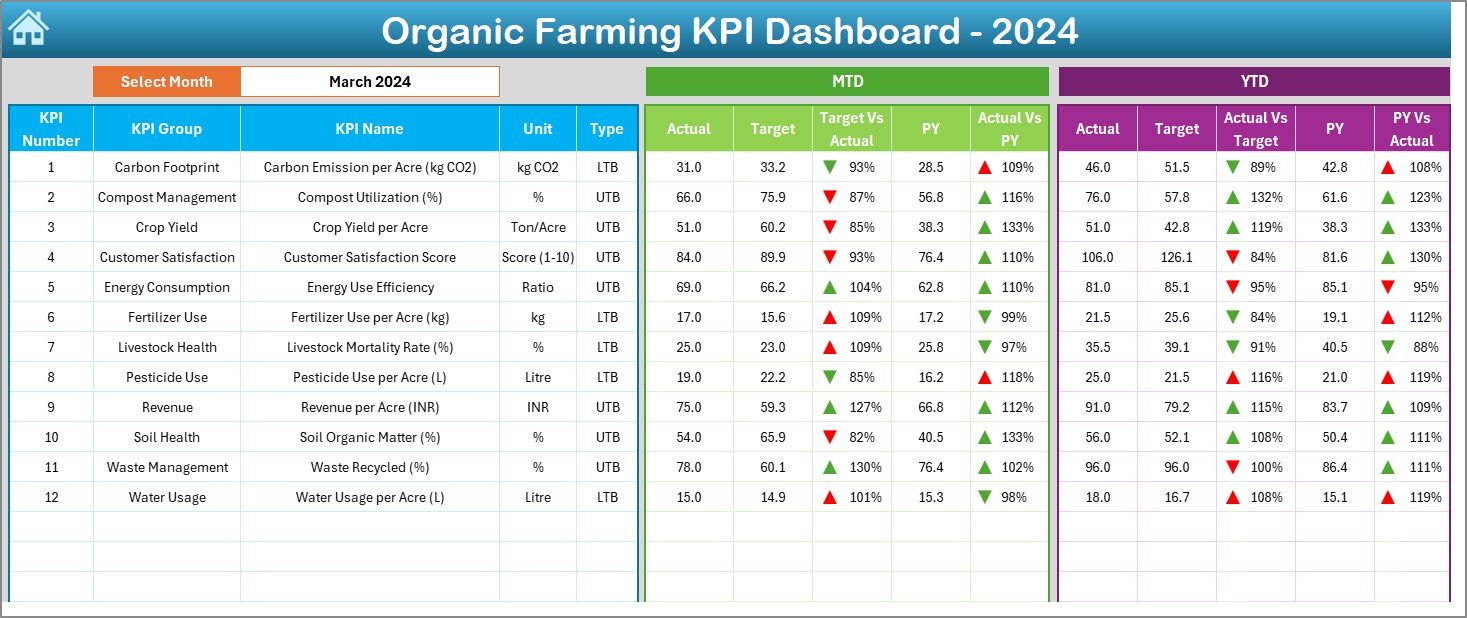
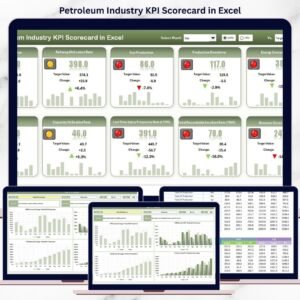
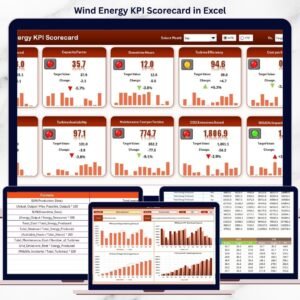
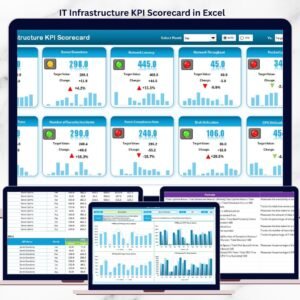
📊 2️⃣ Dashboard Sheet – The Core Visualization Panel
Displays all critical KPIs in an attractive, data-rich layout.
-
Month Selector (D3) updates visuals instantly.
-
MTD/YTD performance comparison.
-
Conditional formatting shows target vs actual progress.
💡 Purpose: Get a one-glance overview of farm productivity, soil quality, and sustainability results.
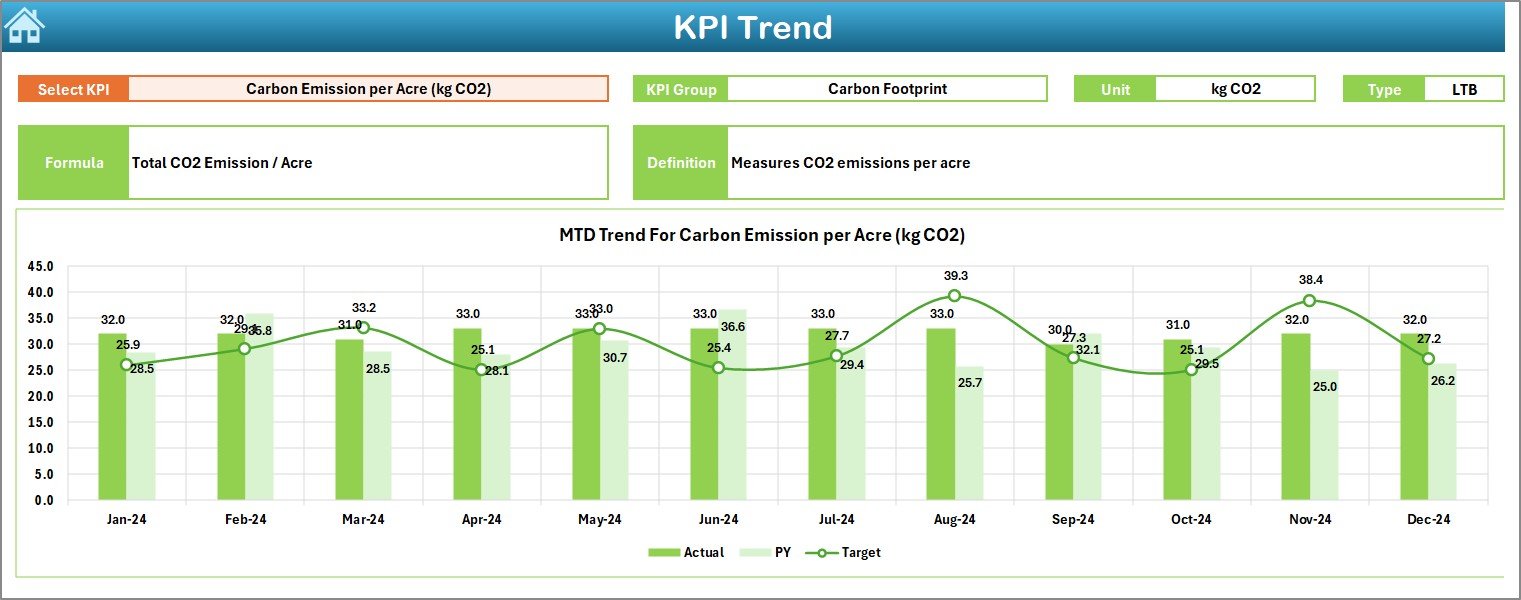
📈 3️⃣ KPI Trend Sheet – Track Seasonal Patterns
Select any KPI from the dropdown to view dynamic trend charts.
See how each metric has evolved month by month with Actual, Target, and PY comparisons.
🎯 Purpose: Identify yield patterns, efficiency trends, and performance dips.
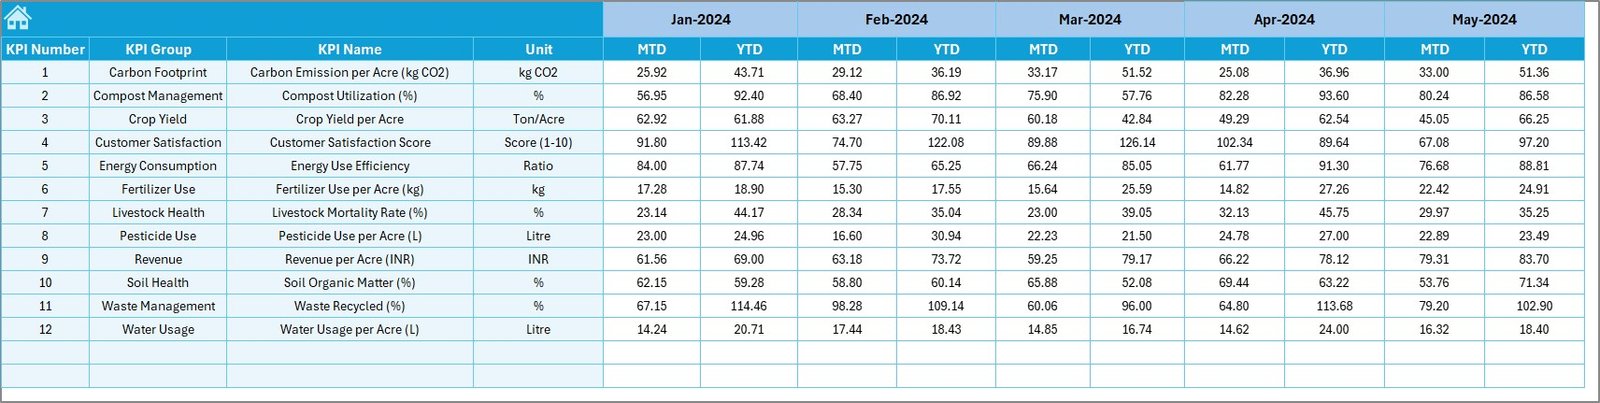
🌱 4️⃣ Actual Numbers Input Sheet – Data Entry Made Simple
Enter real-time monthly performance data like yield, area cultivated, fertilizer use, and revenue.
Automatic calculations refresh the dashboard instantly.
🎯 5️⃣ Target Sheet – Define Your Goals
Set targets for yield, cost reduction, sustainability, or resource efficiency.
Helps farmers stay goal-focused throughout the season.
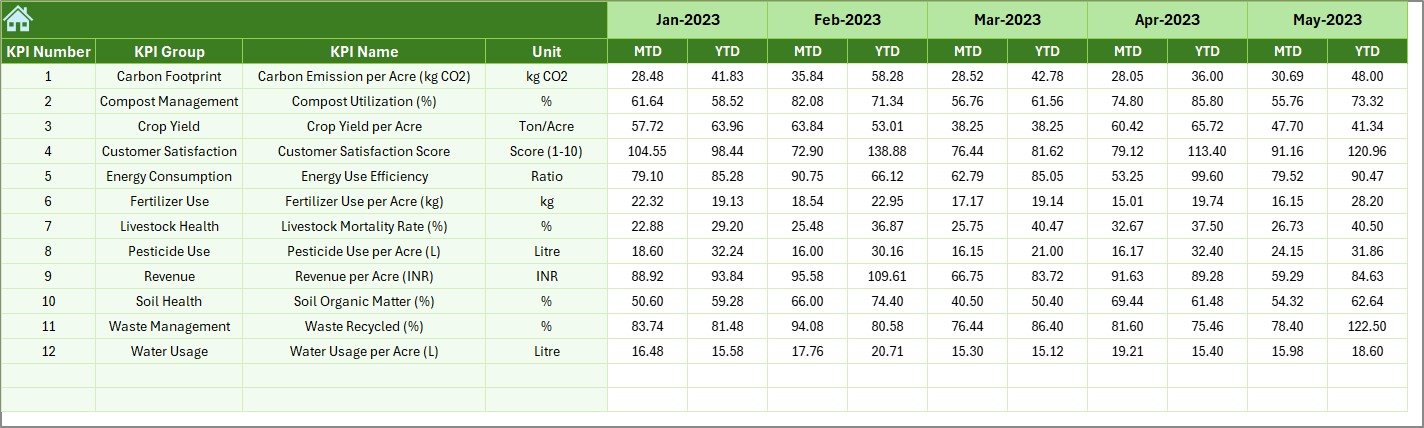
📉 6️⃣ Previous Year Sheet – Benchmark Historical Data
Store and compare past results to measure year-over-year improvements in productivity and resource use.
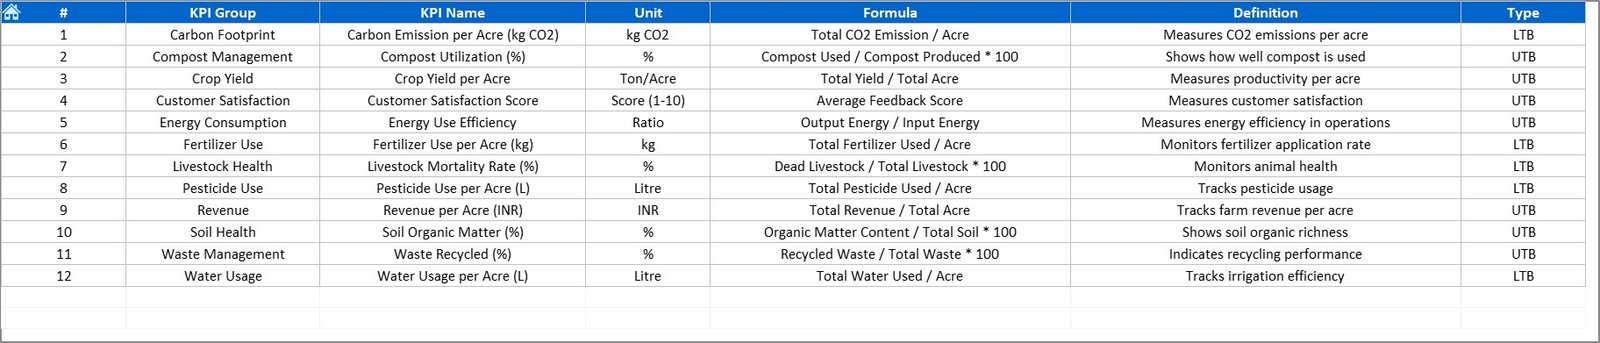
📘 7️⃣ KPI Definition Sheet – Full Clarity
Each KPI includes name, group, unit, formula, definition, and type (UTB/LTB).
Example:
🌾 Crop Yield (kg/ha) → UTB
🪰 Pesticide Use (L/ha) → LTB
🌟 Advantages of Using the Organic Farming KPI Dashboard
✅ Centralized Data Management – Track all farming KPIs in one Excel file.
✅ Faster Decision-Making – Visual cues simplify complex metrics.
✅ Audit-Ready – Ideal for certification programs and reporting.
✅ Cost Optimization – Identify waste in fertilizer, water, or energy use.
✅ Performance Benchmarking – Compare results across months or years.
✅ User-Friendly Interface – No coding; designed for practical farm use.
✅ Supports Sustainable Goals – Track environmental impact alongside profit.
🧠 Best Practices for Getting the Most Out of the Dashboard
📌 Maintain consistent units (kg, L, ha).
📌 Update MTD/YTD data regularly for accuracy.
📌 Set realistic yet challenging targets.
📌 Review progress monthly with your team.
📌 Use the KPI Trend Sheet to identify seasonality.
📌 Back up your file to the cloud for safety.
📌 Involve agronomists and workers in data entry for accuracy.
👥 Who Can Benefit from This Dashboard
🌾 Organic Farmers – Track yield, inputs, and sustainability metrics.
🏢 Farming Cooperatives – Standardize data across multiple farms.
🧑🌾 Agricultural Consultants – Support clients with visual performance reports.
🌍 NGOs and Sustainability Teams – Monitor environmental goals.
🎓 Educational Institutions – Teach data-driven organic farming.


Reviews
There are no reviews yet.