


Managing an organic farm is not easy. Farmers deal with soil conditions, fertilizer usage, irrigation patterns, labor cost, crop health, and revenue cycles—all at the same time. Tracking everything manually becomes slow, confusing, and unreliable. The Organic Farming Dashboard in Excel solves this problem instantly. It brings all your farming insights into one powerful, visual, and easy-to-use dashboard.
This dashboard helps you understand what increases your profit, which farm types perform best, how irrigation impacts crop health, and how cost and revenue change across months. You only enter data in the Data Sheet, and everything else updates automatically. With this dashboard, farmers save time, reduce errors, and make smarter farming decisions every day.
🌾 Key Features of the Organic Farming Dashboard in Excel
This ready-to-use dashboard includes five professional analysis pages. Each page displays clear KPIs, charts, and comparisons that simplify organic farm management.
⭐ Highlights of the Dashboard:
-
Automatic KPI calculations
-
Page Navigator for easy movement
-
Clean and interactive charts
-
Cost vs Revenue analysis
-
Farm type, fertilizer, irrigation & month-level insights
-
Easy Excel-based updates (no extra tools required)
Whether you manage a small organic farm or a large agricultural operation, this dashboard gives you the clarity you need to improve performance.
📦 What’s Inside the Organic Farming Dashboard in Excel
This dashboard is structured into five powerful analysis pages and two support sheets. Each page helps you understand a different part of your farming operations.
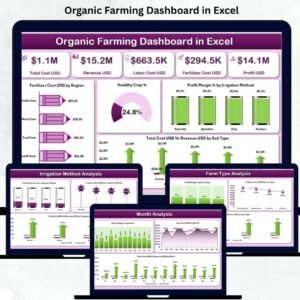
📍 1. Overview Page – Complete Farm Summary

The Overview Page gives an instant snapshot of your farming performance.
✔ KPI Cards Include:
-
Total Cost
-
Total Revenue
-
Fertilizer Cost
-
Healthy Crop %
-
Profit Margin
✔ Charts on This Page:
-
Fertilizer Cost (USD) by Region
-
Healthy Crop %
-
Profit Margin % by Irrigation Method
-
Total Cost vs Revenue by Soil Type
This page helps you quickly identify cost-heavy regions, profitable soil types, and the irrigation techniques that improve crop health.
📍 2. Farm Type Analysis Page – Best & Worst Performing Farms
Every farm type behaves differently. This page helps you compare their performance and profitability.
✔ Charts Include:
-
Profit Margin % by Farm Type
-
Fertilizer Cost (USD) by Farm Type
-
Total Cost vs Revenue by Farm Type
These insights help you understand which farm types deliver the best results and where you need to optimize.
📍 3. Irrigation Method Analysis Page – Improve Water Efficiency
Irrigation plays a major role in organic farming. This page shows:
-
Healthy Crop % by Irrigation Method
-
Irrigation Cost (USD) by Method
-
Total Cost vs Revenue by Method
Farmers use these insights to select the most profitable and water-efficient irrigation strategy.
📍 4. Fertilizer Type Analysis Page – Pick the Most Effective Fertilizers
This page helps you evaluate organic fertilizers with three detailed charts:
-
Profit Margin % by Fertilizer Type
-
Fertilizer Cost by Type
-
Total Cost vs Revenue by Type
This helps reduce unnecessary fertilizer expenses while improving soil quality.
📍 5. Month Analysis Page – Seasonal & Monthly Trends
Farming performance changes month by month. This page helps you track:
-
Profit Margin % by Month
-
Labor Cost by Month
-
Total Cost vs Revenue by Month
These trends help you prepare for upcoming seasons, control cost, and plan farm activities better.
👥 Who Can Benefit from This Dashboard?
-
🌱 Organic Farmers
-
🚜 Farm Managers
-
🧪 Agriculture Consultants
-
🏢 Agribusiness Teams
-
📊 Research & Development Units
-
🧑🌾 Multi-location farm owners
Anyone handling organic farming operations can use this dashboard to save time and increase profitability.
### 📘 Click here to read the Detailed Blog Post
### 📺 Visit our YouTube channel to learn step-by-step video tutorials
👉 Youtube.com/@PKAnExcelExpert


Reviews
There are no reviews yet.