Subscription businesses grow fast — but without structured reporting, growth becomes chaotic. Revenue trends remain unclear. Churn hides in the background. Device performance goes unnoticed. Regional gaps stay invisible.
What if you could track subscriptions, revenue, devices, regions, and monthly trends in one powerful, interactive Power BI dashboard?
The Online Subscription Platforms Dashboard in Power BI is your complete subscription performance control center. It converts raw data into dynamic visuals, intelligent comparisons, and real-time insights. Instead of relying on scattered spreadsheets, you gain centralized clarity that helps increase revenue, reduce churn, and improve retention.
If you want smarter decisions and faster growth, this dashboard delivers exactly that.
🚀 Key Feature of Online Subscription Platforms Dashboard in Power BI
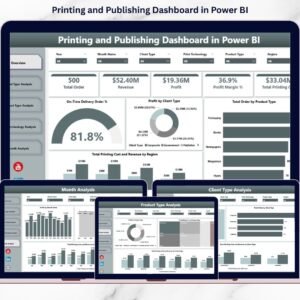
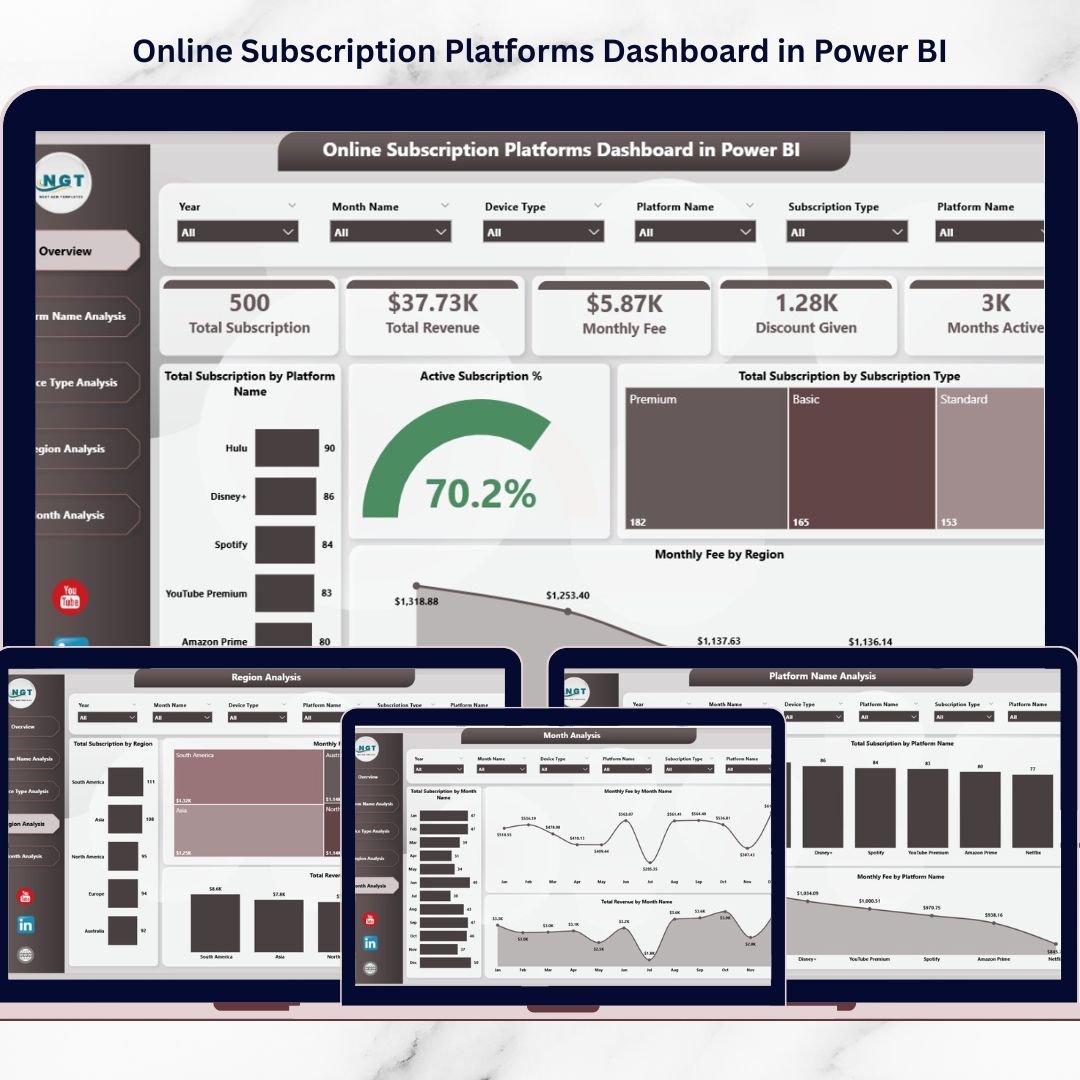
This ready-to-use dashboard includes 5 powerful analytical pages, each designed to monitor subscription performance from different angles.
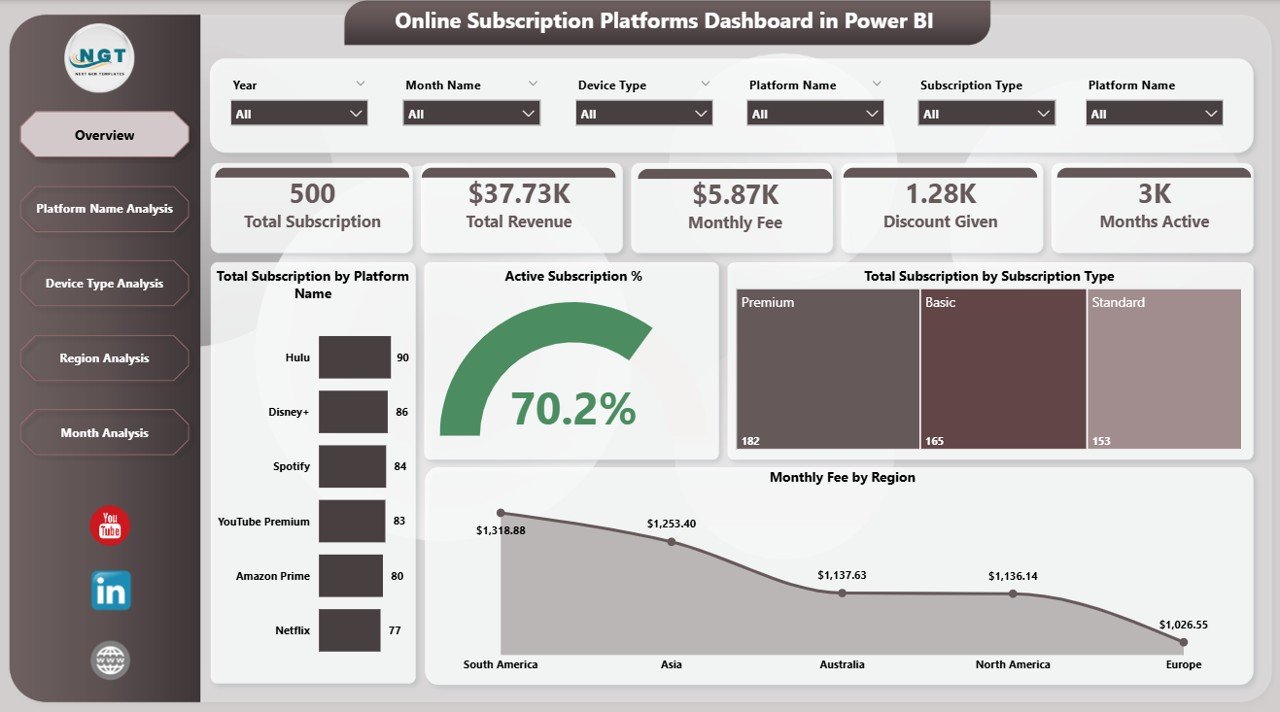
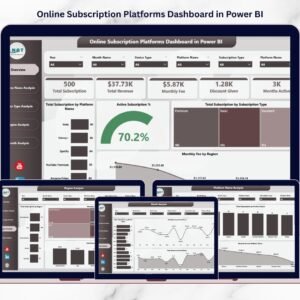
📊 Interactive Overview Page – Get an instant snapshot of Total Subscriptions, Active Subscription %, Revenue, and Monthly Fee insights.
🎯 Smart KPI Cards – Quickly evaluate business health with clear performance indicators.
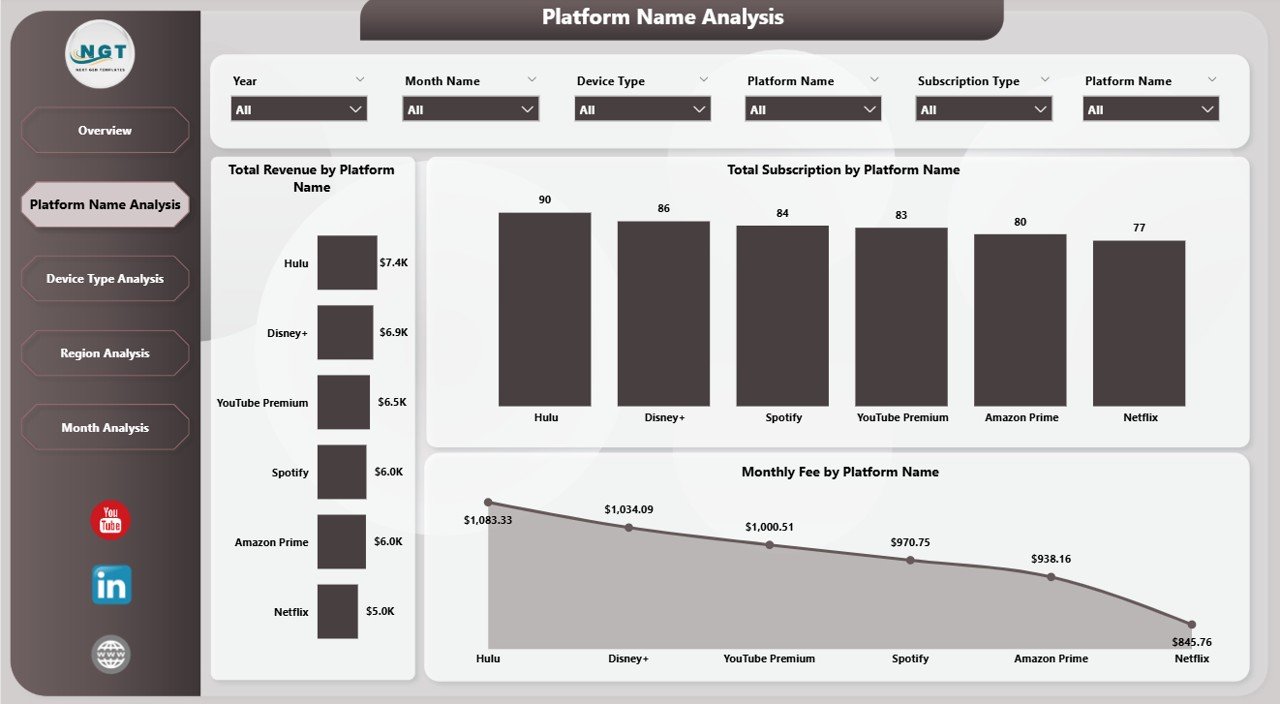
📈 Platform Performance Analysis – Compare total revenue and subscriptions across different platforms.
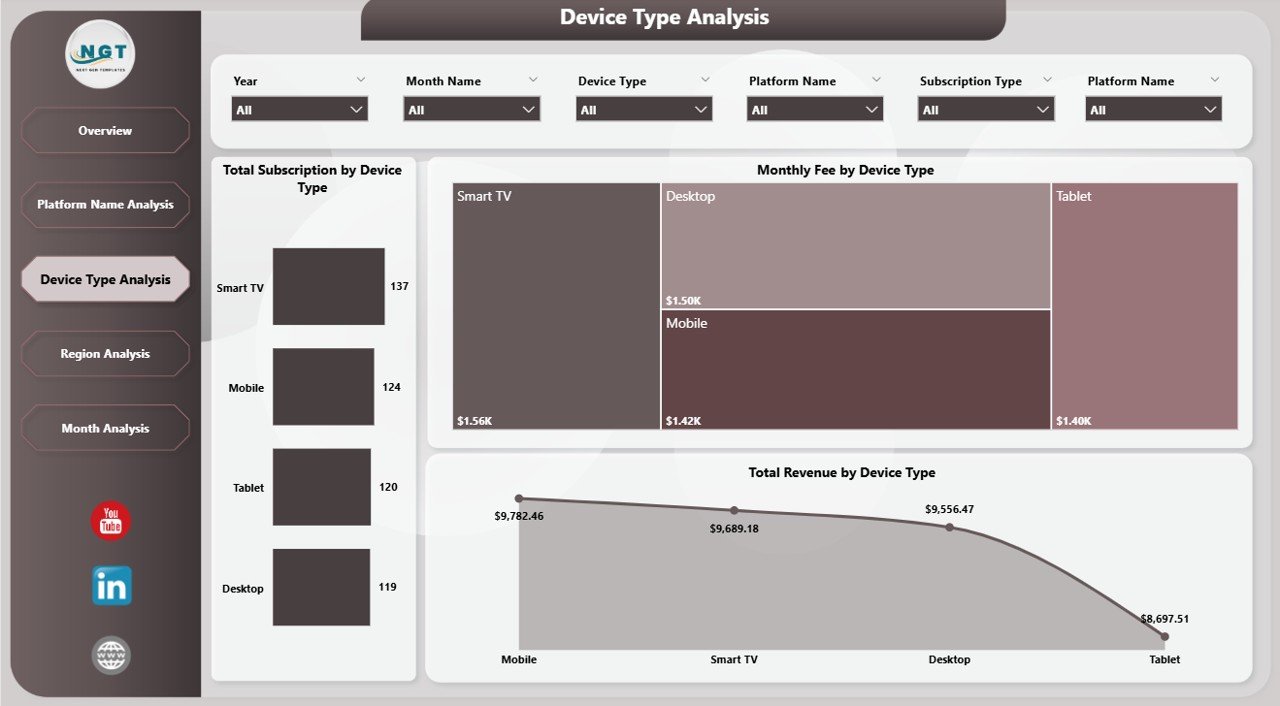
📱 Device Type Insights – Track how mobile, desktop, tablet, and smart TV users contribute to revenue.
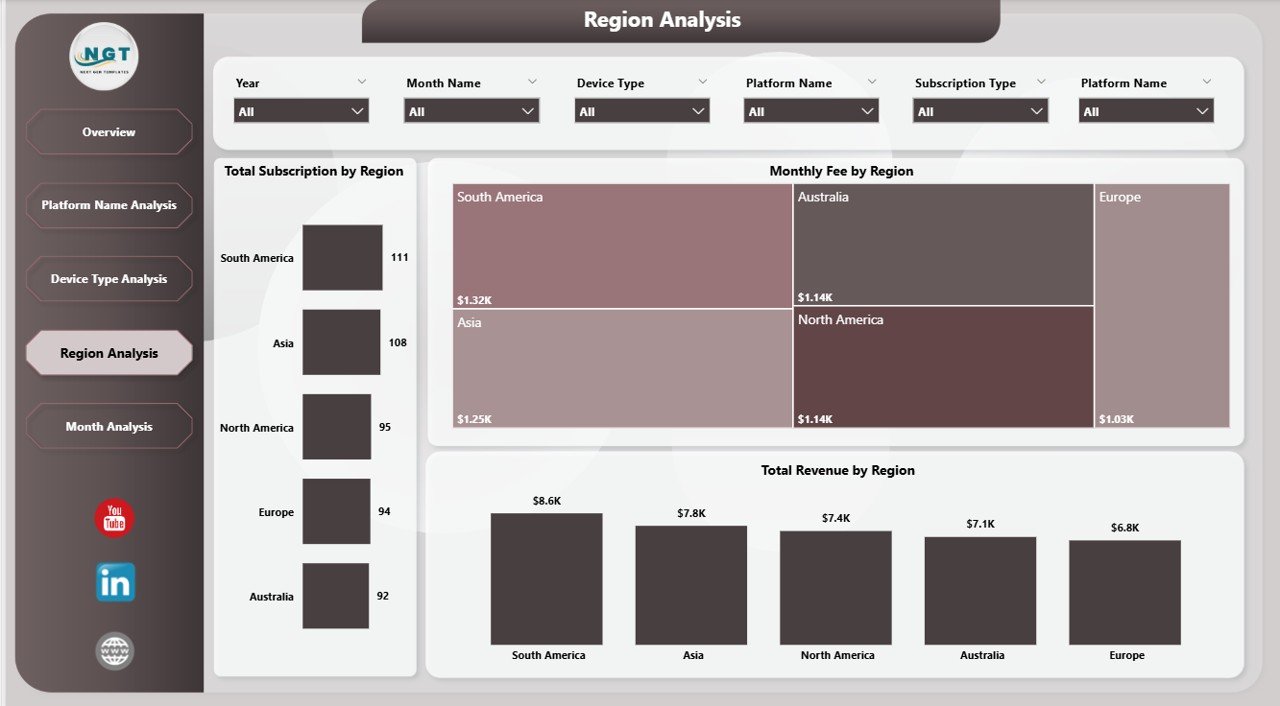
🌍 Region-Based Revenue Analysis – Identify high-growth and underperforming regions.
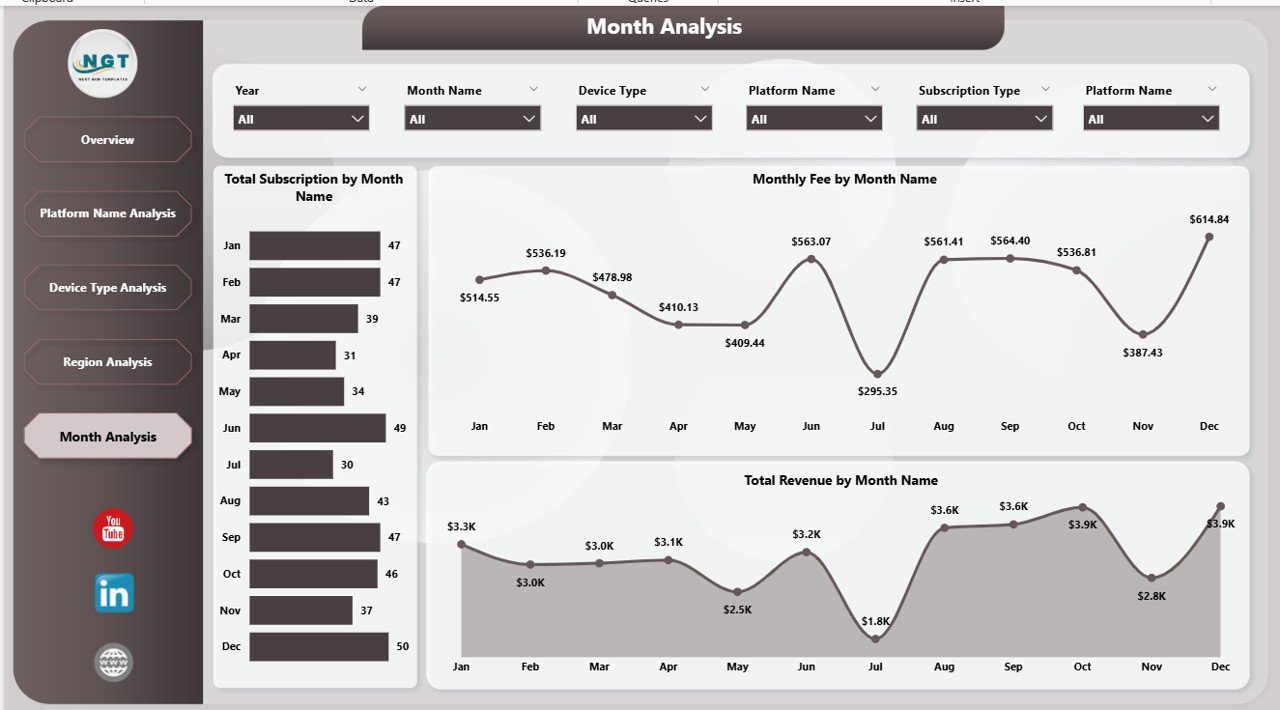
📅 Month Trend Tracking – Analyze revenue and subscription growth over time.
🔄 Dynamic Slicers & Filters – Instantly filter by platform, region, device type, subscription type, and month.
Because Power BI updates visuals dynamically, every filter selection refreshes the entire dashboard in seconds.
📦 What’s Inside the Online Subscription Platforms Dashboard in Power BI
This dashboard is built using structured data modeling and powerful DAX measures to ensure accuracy and flexibility.
Inside the solution, you get:
✅ 5 fully designed Power BI report pages
✅ Structured data model for subscription tracking
✅ Pre-built DAX measures for revenue and growth calculations
✅ KPI comparison visuals (Actual vs Trend insights)
✅ Dynamic filtering system
✅ Scalable structure for adding new platforms or KPIs
✅ Executive-ready visual layout
You can connect data from:
Excel files
CRM systems
SaaS databases
Subscription management platforms
The dashboard supports analysis by:
Platform Name
Subscription Type
Device Type
Region
Month
Because the structure is flexible, you can customize it according to your business model.
⚙️ How to Use the Online Subscription Platforms Dashboard in Power BI
Implementation is simple and structured.
1️⃣ Import your subscription dataset into Power BI.
2️⃣ Ensure relationships are correctly defined between tables.
3️⃣ Refresh data to update visuals.
4️⃣ Use slicers to filter by platform, region, device, or month.
5️⃣ Analyze KPIs and trends for smarter decisions.
No advanced Power BI expertise is required. Basic understanding of filters and visuals is enough to operate the dashboard effectively.
👥 Who Can Benefit from This Online Subscription Platforms Dashboard in Power BI
This dashboard is perfect for:
💼 SaaS Companies
🎬 Streaming Platforms
📚 Online Education Platforms
🏋️ Fitness Membership Apps
🌐 Digital Service Providers
📦 Subscription-Based Businesses
If your business depends on recurring revenue, this dashboard helps you monitor growth and prevent revenue leakage.
💡 Why This Dashboard Drives Business Growth
✔ Centralized subscription reporting
✔ Real-time revenue insights
✔ Early churn detection using Active Subscription %
✔ Clear device and regional performance tracking
✔ Faster strategic planning
✔ Better marketing campaign analysis
✔ Improved financial forecasting
✔ Executive-level reporting clarity
Instead of guessing what drives revenue, you see the complete picture instantly.
This dashboard transforms subscription data into strategic intelligence.
### Click here to read the Detailed blog post
Visit our YouTube channel to learn step-by-step video tutorials
Youtube.com/@PKAnExcelExpert