


Online learning platforms generate huge amounts of data every day—enrollments, course performance, revenue, discounts, learner satisfaction, and more. Tracking all this manually becomes complex and time-consuming. That’s why this Online Learning Platforms Dashboard in Power BI is the perfect solution. It gives you clean visuals, real-time KPIs, interactive charts, and instant insights to understand exactly how your learning platform is performing.
This dashboard converts raw data into meaningful analytics that help you optimize courses, improve learner engagement, increase revenue, and make smarter decisions. With five powerful pages, each designed to analyze a different part of your learning ecosystem, this dashboard becomes your all-in-one performance command center.
Whether you run an EdTech company, an online academy, corporate training programs, or digital courses, this dashboard gives you clarity like never before.
📦 What’s Inside the Online Learning Platforms Dashboard in Power BI
This dashboard is organized into five high-impact pages. Each page includes filters and slicers, giving you complete control over how you explore your data.
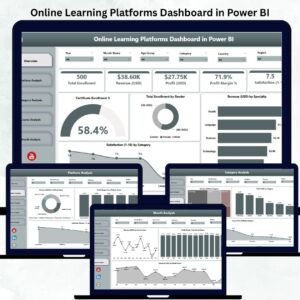
✨ 1. Overview Page – Your Learning Performance at a Glance

The Overview Page gives you a full summary of your platform’s performance. You can instantly track:
-
⭐ Certificate Enrollment %
-
⭐ Total Enrollment by Gender
-
⭐ Revenue by Specialty
-
⭐ Satisfaction by Category
This page shows you which learning categories, specialties, and demographics are performing well. With one quick view, you see strengths, gaps, and improvement opportunities.
✨ 2. Platform Analysis Page – Compare All Platforms Easily
If you publish courses on multiple platforms like Udemy, Coursera, LinkedIn Learning, Teachable, or internal portals, this section becomes extremely valuable. You can analyze:
-
Revenue (USD) by Platform
-
Profit Margin % by Platform
-
Instructor Rating by Platform
This helps you identify which platform brings the most revenue, which one gives the best margins, and where your courses perform the best.
✨ 3. Category Analysis Page – Find High-Performing Learning Areas
Different categories attract different types of learners. This page shows:
-
Revenue by Category
-
Profit by Category
-
Course Price by Category
You can identify trending categories, profitable topics, and categories that need improvement in pricing or content.
✨ 4. Course Analysis Page – Track Course-Level Success
See how individual course types perform in terms of revenue, profit, and enrollments. This helps you:
-
Promote high-performing courses
-
Improve weak courses
-
Expand winning course types
-
Remove low-demand products
With course-wise clarity, you make smarter business and marketing decisions.
✨ 5. Monthly Trends Page – Understand Seasonality and Growth Patterns
This page shows monthly trends for:
-
Revenue
-
Profit
-
Discount impact
You can identify peak months, slow periods, and marketing opportunities. Monthly patterns help with planning new launches, promotions, and subscription campaigns.
🛠️ How to Use the Online Learning Platforms Dashboard in Power BI
This dashboard is simple and beginner-friendly. You don’t need technical skills.
Follow these easy steps:
➡️ Open the Power BI file
➡️ Load your data from Excel, database, or LMS
➡️ Use slicers to explore platform-wise, category-wise, and course-wise insights
➡️ Track monthly trends and satisfaction patterns
➡️ Export visuals for meetings or reports
➡️ Customize charts, colors, and KPIs as needed
The dashboard is completely flexible and supports expansion, additional KPIs, and advanced DAX measures.
👥 Who Can Benefit from This Online Learning Platforms Dashboard in Power BI
🎯 EdTech Companies
Track platform performance, revenue, enrollment, and satisfaction effortlessly.
🎯 Online Course Creators & Instructors
Identify top-performing courses and improve content.
🎯 Training Providers & Online Academies
Understand student behavior, demand trends, and high-value categories.
🎯 Corporate Learning Teams
Analyze course adoption, learning completion, and monthly learning patterns.
🎯 Marketing & Strategy Teams
Use revenue, category, and platform insights to plan campaigns and promotions.
🎯 Learning Managers & CEOs
Get a bird’s-eye view of business performance in seconds.
This dashboard is ideal for anyone aiming to scale their online learning business with data-driven clarity.
### 📘 Click here to read the Detailed Blog Post
### 📺 Visit our YouTube channel to learn step-by-step video tutorials:
👉 Youtube.com/@PKAnExcelExpert


Reviews
There are no reviews yet.