


Efficient office space utilization has become more important than ever with the rise of hybrid work, flexible seating, and multi-location teams. Organizations must ensure that their workspaces are being used effectively—not only to reduce costs but also to improve employee experience. The Office Utilization Dashboard in Power BI is a ready-to-use, interactive solution designed to help facilities teams, HR departments, and managers track, analyze, and optimize office usage.
This dashboard consolidates critical metrics like booking rates, occupancy, space type utilization, and departmental efficiency into one interactive platform. With real-time visualization and drill-down capabilities, it enables smarter workplace decisions backed by data.
✨ Key Features of the Office Utilization Dashboard
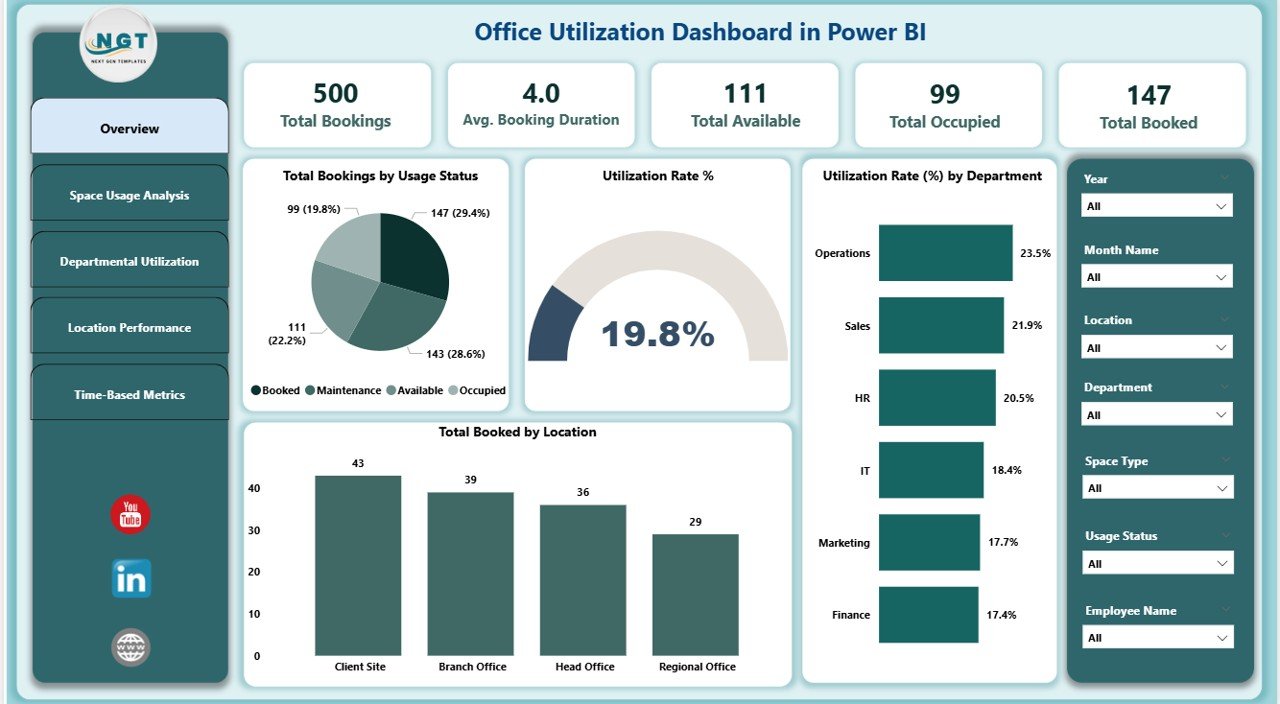
1. Overview Page
The Overview Page gives you a high-level snapshot of office usage.
-
📊 Cards: Total Bookings, Avg. Booking Duration, Total Available, Total Occupied, and Total Booked.
-
📈 Charts: Utilization Rate %, Bookings by Status, Departmental Utilization %, and Bookings by Location.
This summary allows you to instantly see space efficiency, identify bottlenecks, and track occupancy trends across the organization.
2. Space Usage Analysis Page
Gain insight into how different types of spaces are being used:
-
🏢 Total Bookings by Space Type (conference rooms, workstations, pods, etc.)
-
📉 Utilization Rate (%) by Space Type
-
⏱ Avg. Booking Duration by Space Type
These insights help managers identify underutilized areas and make better allocation decisions.
3. Departmental Utilization Page
Understand which departments are using office spaces most effectively.
-
🔹 Total Bookings by Department
-
⏱ Avg. Booking Duration by Department
-
🏬 Total Occupied vs Total Available
This ensures equitable space distribution and highlights departments with either high demand or unused allocations.
4. Location Performance Page
For organizations with multiple offices, the Location Performance Page is a game-changer:
-
📍 Utilization Rate (%) by Location
-
📊 Booked vs Available Spaces per Location
-
🏢 Capacity Distribution across branches
This feature enables leaders to evaluate high-performing offices and repurpose underutilized spaces.
5. Time-Based Metrics Page
Analyze utilization over time to identify patterns:
-
📅 Bookings by Month
-
⏱ Avg. Booking Duration Trends
-
🏬 Occupancy & Booking vs Available Spaces
Time-based insights help forecast demand, plan resources, and make proactive real estate decisions.
📦 What’s Inside the Office Utilization Dashboard
-
A fully functional Power BI dashboard file (.pbix)
-
Multiple pages of interactive visuals
-
Predefined slicers, filters, and drill-downs
-
Ready-to-use sample dataset for instant demo
-
Structured data model for easy customization
⚙️ How to Use the Office Utilization Dashboard
-
Open in Power BI Desktop – Load the .pbix file.
-
Input Your Data – Replace the sample dataset with your office utilization data.
-
Explore Insights – Use interactive filters to drill into departments, locations, and timelines.
-
Share with Teams – Publish to Power BI Service for organization-wide access.
-
Customize as Needed – Add KPIs or adjust visuals to align with your workplace policies.
👥 Who Can Benefit from This Dashboard?
-
🏢 Facilities Managers – Optimize office space and reduce costs.
-
👩💼 HR Teams – Plan hybrid work schedules and employee seating.
-
📊 Business Analysts – Drive data-backed decisions on workplace strategy.
-
🏬 Executives – Monitor multi-location performance and utilization trends.
-
👨💻 IT/Operations Teams – Integrate booking software and occupancy sensors for real-time analysis.
✅ Advantages of Using This Dashboard
-
Centralized visibility of all office spaces
-
Real-time analysis of bookings, occupancy, and availability
-
Drill-down by department, location, and time period
-
Helps identify underutilized areas for repurposing
-
Supports hybrid work and flexible seating strategies
🚀 Opportunities for Improvement
-
Integration with meeting room booking software for real-time updates
-
Adding employee feedback/satisfaction metrics
-
Cost analysis per square foot for financial planning
-
Predictive analytics for future space requirements
🏆 Best Practices
-
Update data weekly for accurate insights
-
Review departmental and location utilization monthly
-
Use time-based analysis to forecast peak usage periods
-
Combine with HR/IT data for hybrid workforce planning
Click here to read the Detailed blog post
Watch the step-by-step video Demo:


Reviews
There are no reviews yet.