


Managing office utility expenses manually is no longer efficient in today’s data-driven world. Rising electricity bills, water charges, internet costs, maintenance expenses, taxes, and invoice delays can silently drain your budget if they are not tracked properly. That is exactly why the Office Utility Cost Dashboard in Excel is a must-have solution for modern organizations.
This ready-to-use Excel dashboard converts scattered financial and utility data into a clear, interactive, and visual performance system. Instead of juggling multiple spreadsheets, you get one centralized dashboard that delivers instant insights into costs, revenue, invoices, assets, liabilities, and monthly trends—all in Microsoft Excel.
Designed with simplicity and business usability in mind, this dashboard empowers finance teams, facility managers, and business leaders to control costs, improve transparency, and make faster decisions without any additional software or technical complexity.
🔑 Key Features of Office Utility Cost Dashboard in Excel
⚡ Centralized Utility Cost Tracking
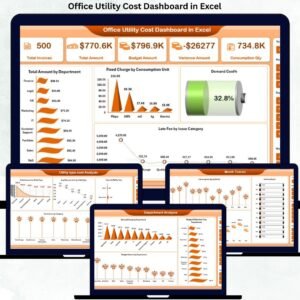
Monitor electricity, water, internet, maintenance, taxes, and invoices in one structured Excel dashboard.
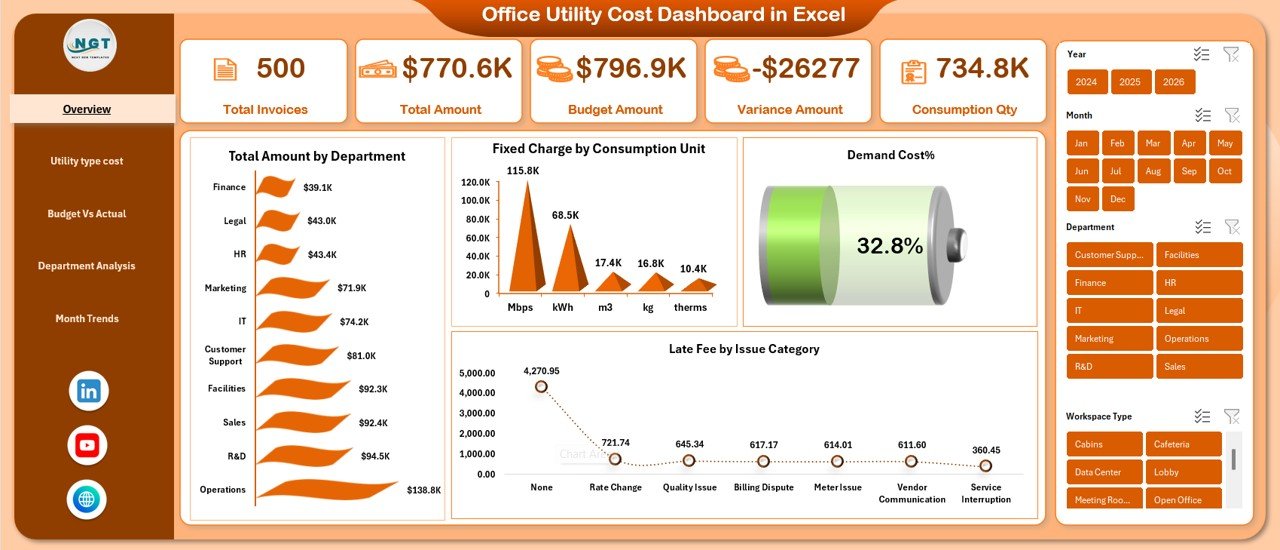
📊 Executive Overview Dashboard
Instantly view Revenue Amount, Expense Amount, Asset Amount, Liability Amount, and Tax % through KPI cards.
🏢 Department-Wise Cost Analysis
Identify unpaid invoices, overdue invoices, and tax amounts by department to improve accountability.
🌍 Region & Payment Method Insights
Analyze expenses, liabilities, and revenue distribution across regions and payment methods.
📈 Monthly Trend Analysis
Track month-wise revenue, paid invoice percentage, and tax trends to detect seasonal cost patterns.
🔄 Automatic Calculations
Powered by Excel formulas, pivot tables, and slicers for real-time updates with new data.
💡 User-Friendly & Customizable
Easily modify charts, KPIs, and layouts without advanced Excel skills.
📁 What’s Inside the Office Utility Cost Dashboard in Excel
📌 Overview Sheet
Provides a high-level snapshot with KPI cards and charts such as Paid Invoice by Department, Expense by Region, and Payment Method analysis.
📌 Department Analysis Sheet
Focuses on unpaid invoices, overdue invoices, tax amounts, and overdue invoice percentage by department.
📌 Revenue & Expense Analysis Sheet
Compares revenue and expense distribution by department, region, and payment method.
📌 Liability & Asset Analysis Sheet
Tracks asset allocation and liability exposure across departments, regions, and payment types.
📌 Monthly Trends Sheet
Visualizes revenue, paid invoice %, and tax amount trends month by month for forecasting and budgeting.
📌 Structured Data Tables
Clean and organized data tables that feed the entire dashboard seamlessly.
🛠️ How to Use the Office Utility Cost Dashboard in Excel
1️⃣ Enter or paste your utility, invoice, revenue, and expense data into the provided tables
2️⃣ Refresh pivot tables (if required)
3️⃣ Use slicers and filters to analyze by department, region, or month
4️⃣ Review visual KPIs, charts, and trends instantly
5️⃣ Share insights with stakeholders and take data-driven actions
No macros. No complex setup. Just plug, analyze, and decide.
👥 Who Can Benefit from This Office Utility Cost Dashboard in Excel
🏢 Corporate Offices & Enterprises
💼 Finance & Accounting Teams
🏗️ Facility & Operations Managers
🎓 Educational Institutions
🏥 Healthcare Organizations
👔 Business Owners & Executives
🏢 Co-working & Shared Office Spaces
If your organization tracks utility costs, invoices, or office expenses, this dashboard will deliver immediate value.
Click here to read the Detailed blog post
Watch the step-by-step video tutorial:


Reviews
There are no reviews yet.