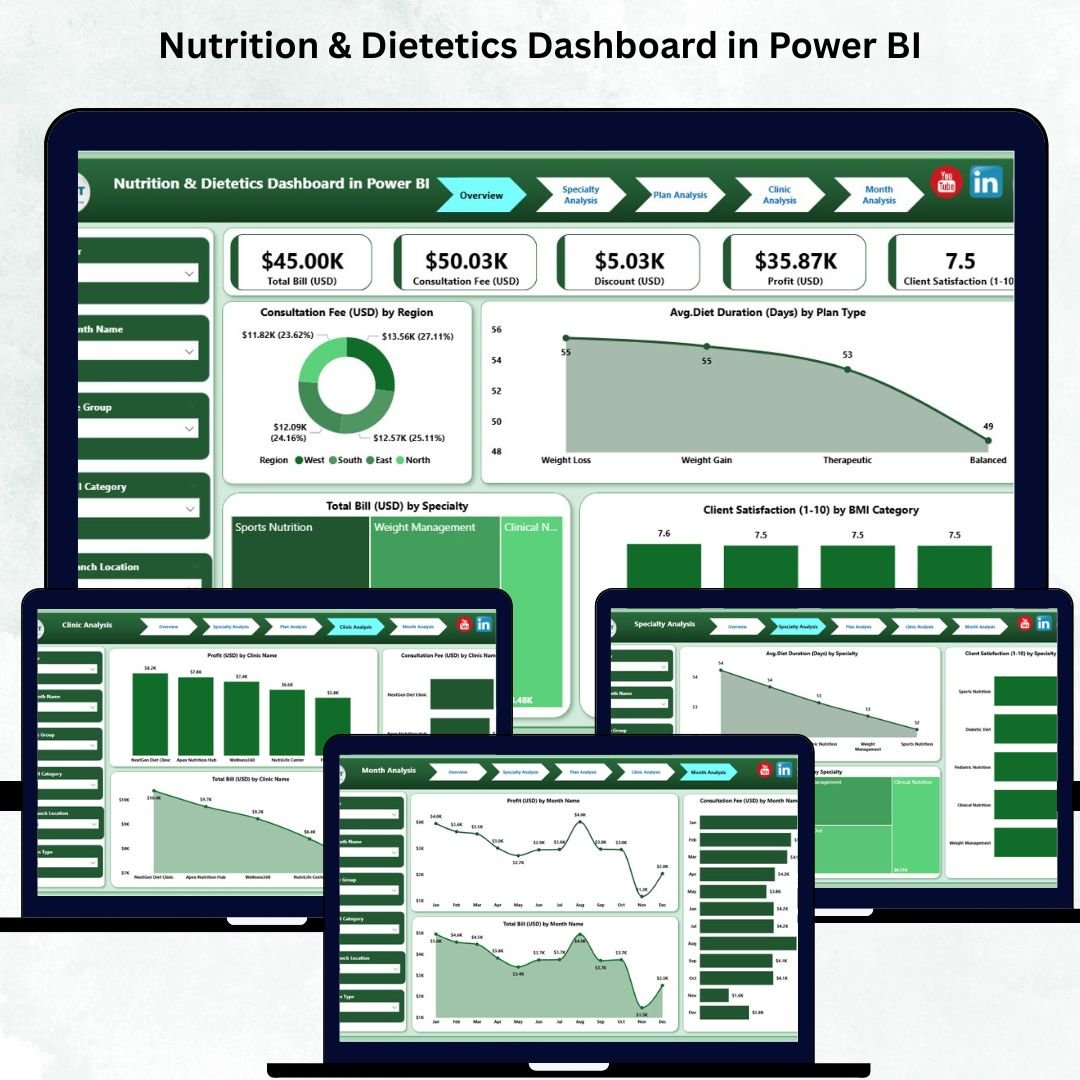
Managing nutrition and dietetics data becomes complex as your client base grows—more consultations, more diet plans, more performance metrics, and more monthly results to track. Without a proper system, teams spend hours preparing manual reports and switching between spreadsheets. This slows down decision-making and hides important insights that could improve client outcomes and business results.
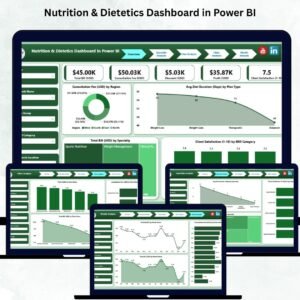
The Nutrition & Dietetics Dashboard in Power BI transforms the way nutrition clinics, dietitians, health coaches, and wellness centers analyze their operations. It turns raw data into interactive visuals, insightful charts, and automated performance reports. With just a few clicks, you view consultation fees, diet duration, specialty performance, client satisfaction, billing trends, clinic-wise results, and month-wise patterns—all in one powerful dashboard. 🌟
This ready-to-use solution is perfect for teams who want clear, fast, and reliable insights without spending hours on manual data work. Whether you manage a single clinic or a multi-location nutrition chain, this dashboard helps you control costs, understand client behavior, improve diet plans, and grow your business with data-driven decisions.
✨ Key Features of Nutrition & Dietetics Dashboard in Power BI
This dashboard includes all the tools and visuals required to understand your nutrition business instantly.
📊 Fully Interactive KPI Cards
Track your key performance metrics such as:
-
Consultation Fee (USD)
-
Avg. Diet Duration (Days)
-
Total Bill Value (USD)
-
Client Satisfaction Score
These KPIs give you a real-time snapshot of your clinic performance.
📈 Professional Visual Charts
View region-wise earnings, specialty trends, plan performance, and BMI-based satisfaction using beautifully designed Power BI charts.
📅 Smart Slicers & Filters
Switch Regions, Plan Types, BMI Categories, Specialties, Dates, or Clinics with one click. Every chart updates instantly.
⚡ Automated Reporting
No manual calculations. No formulas. Just refresh your data and the dashboard updates automatically.
📦 What’s Inside the Nutrition & Dietetics Dashboard in Power BI
This template includes five deep-analysis pages, each designed to answer critical business questions.
1️⃣ Overview Page
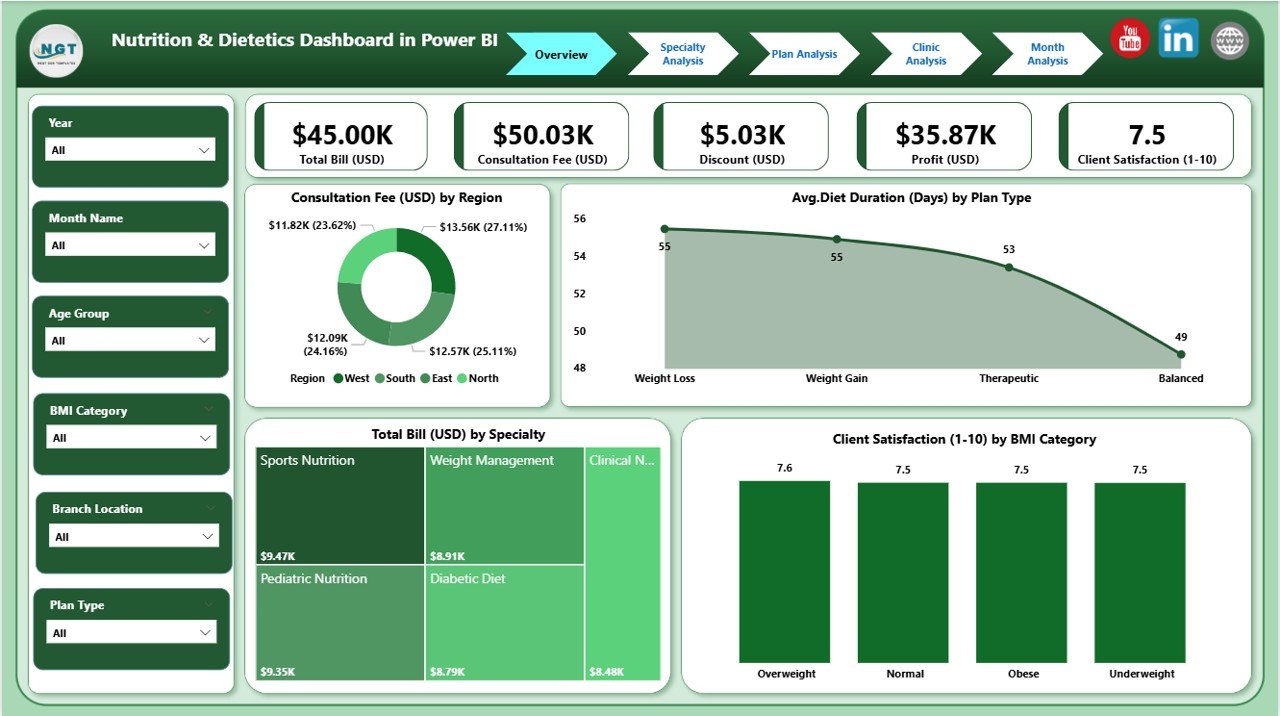
The command center of your dashboard.
You see:
-
Region-wise Consultation Fee
-
Avg. Diet Duration by Plan Type
-
Total Bill by Specialty
-
Satisfaction by BMI Category
This helps answer key questions like which region earns the most, which plan is most effective, and where client satisfaction is highest.
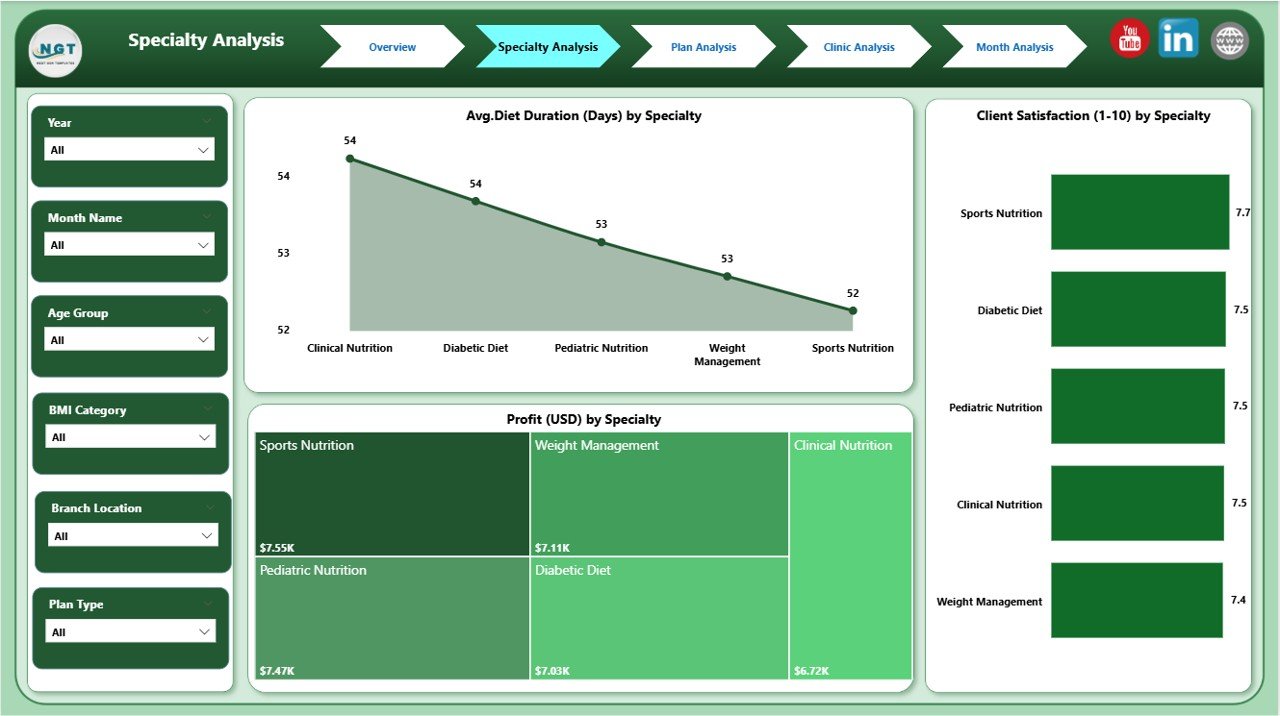
2️⃣ Specialty Analysis Page
Explore how sports nutrition, obesity management, child nutrition, metabolic therapy, and clinical dietetics perform.
Track:
-
Diet Duration
-
Profit
-
Satisfaction
This page helps identify strong and weak specialties.
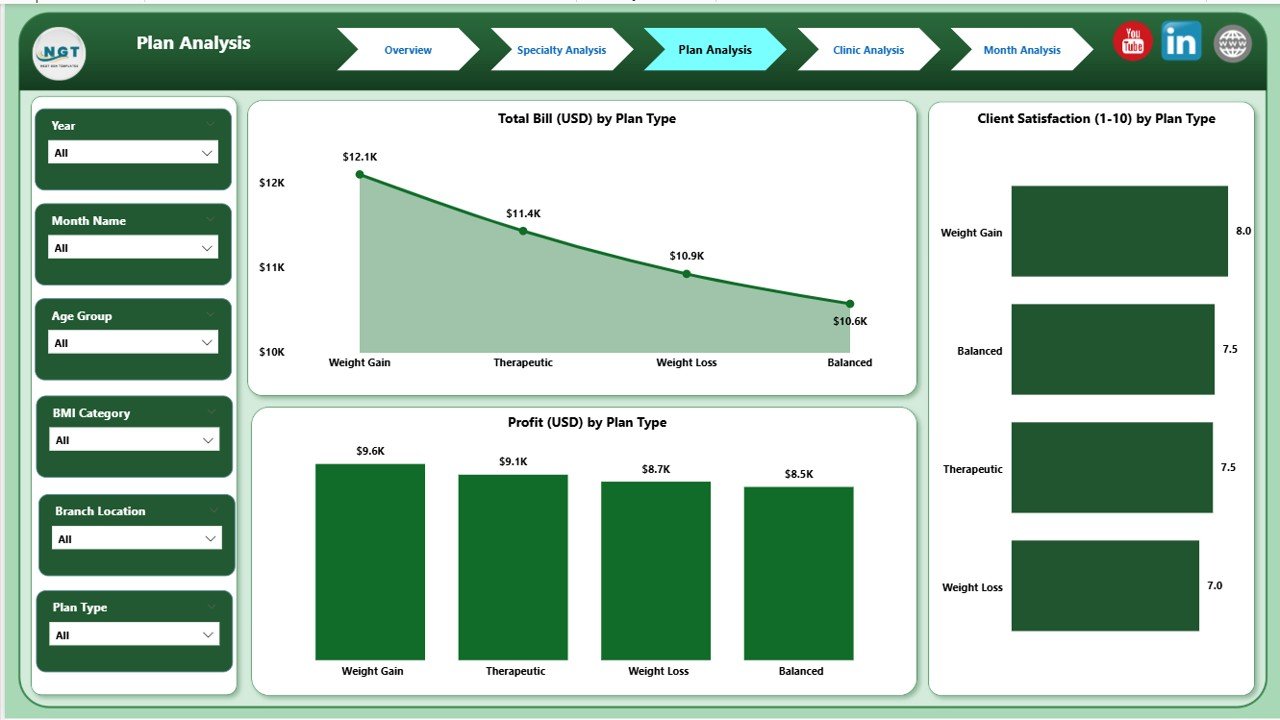
3️⃣ Plan Analysis Page
Compare diet plans such as weight loss, diabetic plans, muscle gain, detox, pregnancy diets, and lifestyle management.
View:
-
Client Satisfaction
-
Profit
-
Total Bill
Perfect for optimizing pricing and improving low-performing plans.
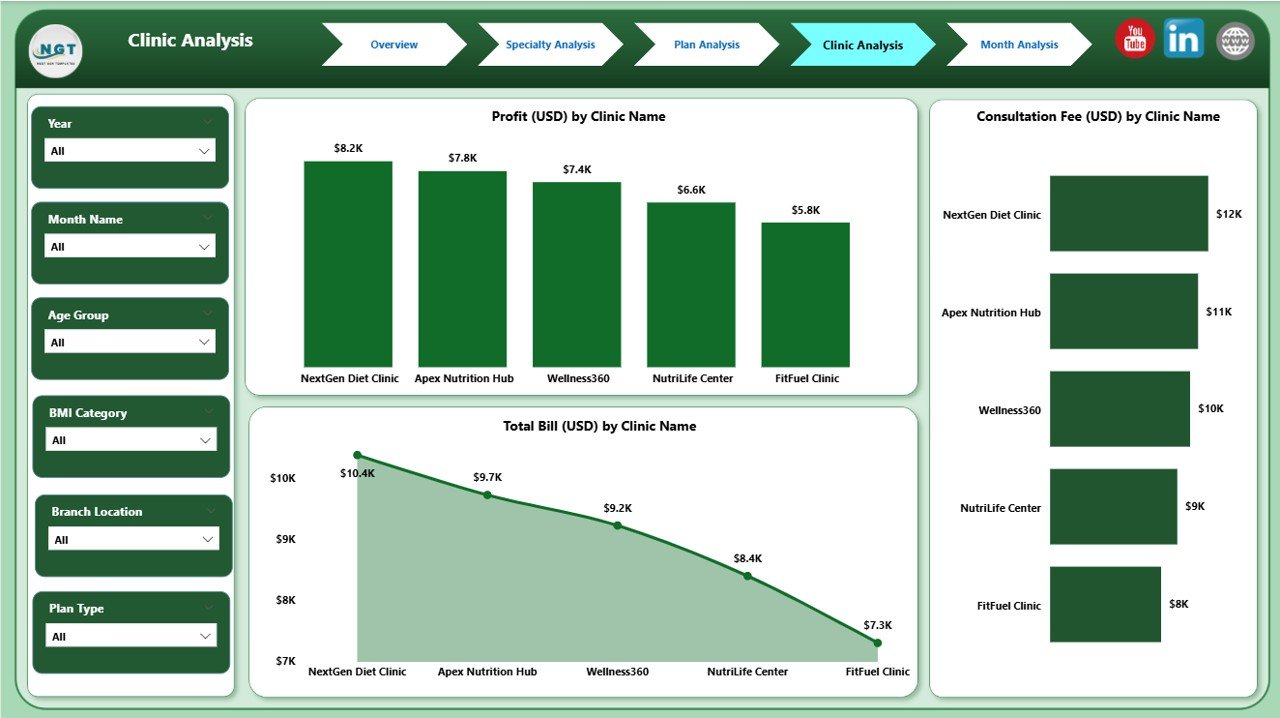
4️⃣ Clinic Analysis Page
Ideal for multi-location nutrition chains.
Analyze:
-
Satisfaction
-
Profit
-
Billing
This page identifies your best and weakest clinics, helping improve service quality and resource distribution.
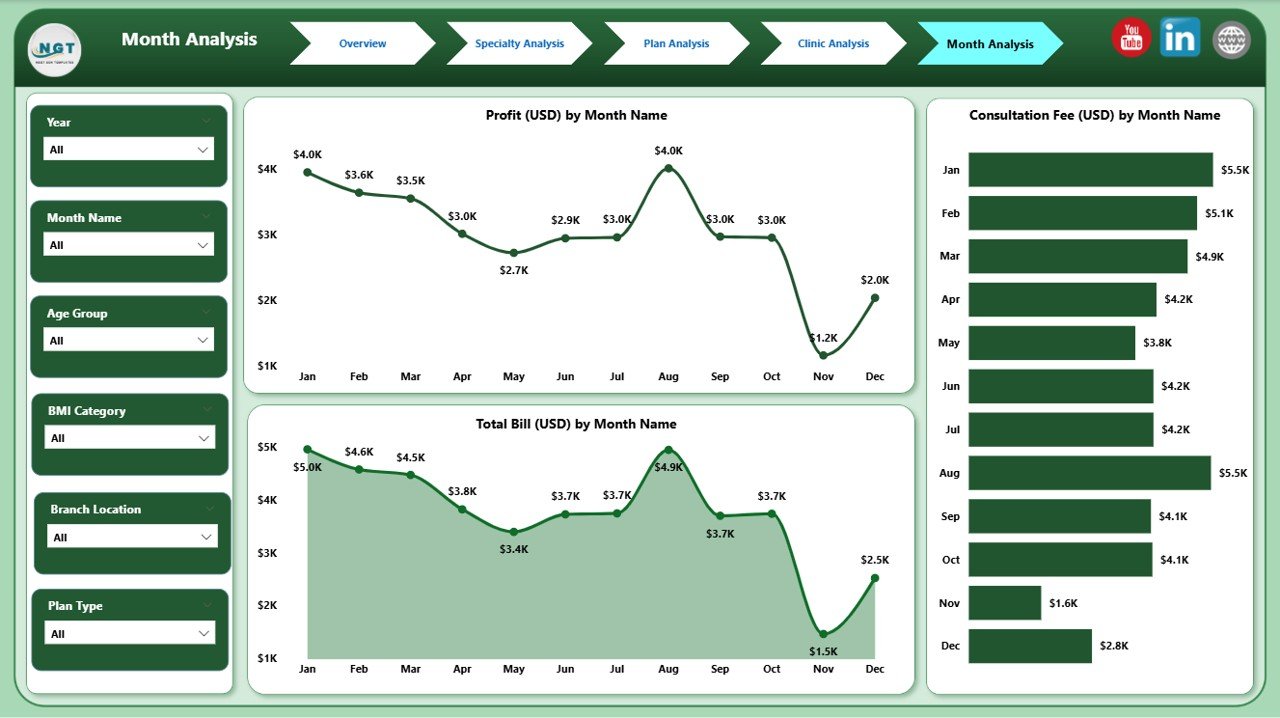
5️⃣ Monthly Trends Page
Track seasonality and month-wise performance.
View:
-
Consultation Fee Trends
-
Monthly Profit
-
Total Billing
This supports forecasting and long-term planning.
🛠️ How to Use the Nutrition & Dietetics Dashboard in Power BI
Using this dashboard is extremely easy—even for beginners.
1️⃣ Connect or import your dataset
2️⃣ Refresh the dashboard
3️⃣ Use slicers to explore results
4️⃣ Analyze charts and KPIs
5️⃣ Identify growth and improvement areas
No coding. No formulas. Everything is automated. ⚡
🎯 Who Can Benefit from This Dashboard?
This dashboard is ideal for:
-
🧑⚕️ Dietitians
-
🥗 Nutritionists
-
🩺 Clinical Dietetics Teams
-
🏥 Nutrition Clinics & Wellness Centers
-
💼 Clinic Managers
-
📊 Financial & Operations Teams
-
🏋️ Health Coaches
If you want clearer insights, faster decisions, and improved client outcomes, this dashboard is for you.
### Click here to read the Detailed blog post
Visit our YouTube channel to learn step-by-step video tutorials
👉 Youtube.com/@PKAnExcelExpert


Reviews
There are no reviews yet.