Managing music festivals, theatre productions, concerts, and live performances is exciting — but tracking performance, revenue, and audience engagement can quickly become overwhelming. Event organizers often struggle with scattered spreadsheets, manual reporting, and delayed insights that slow down decision-making.
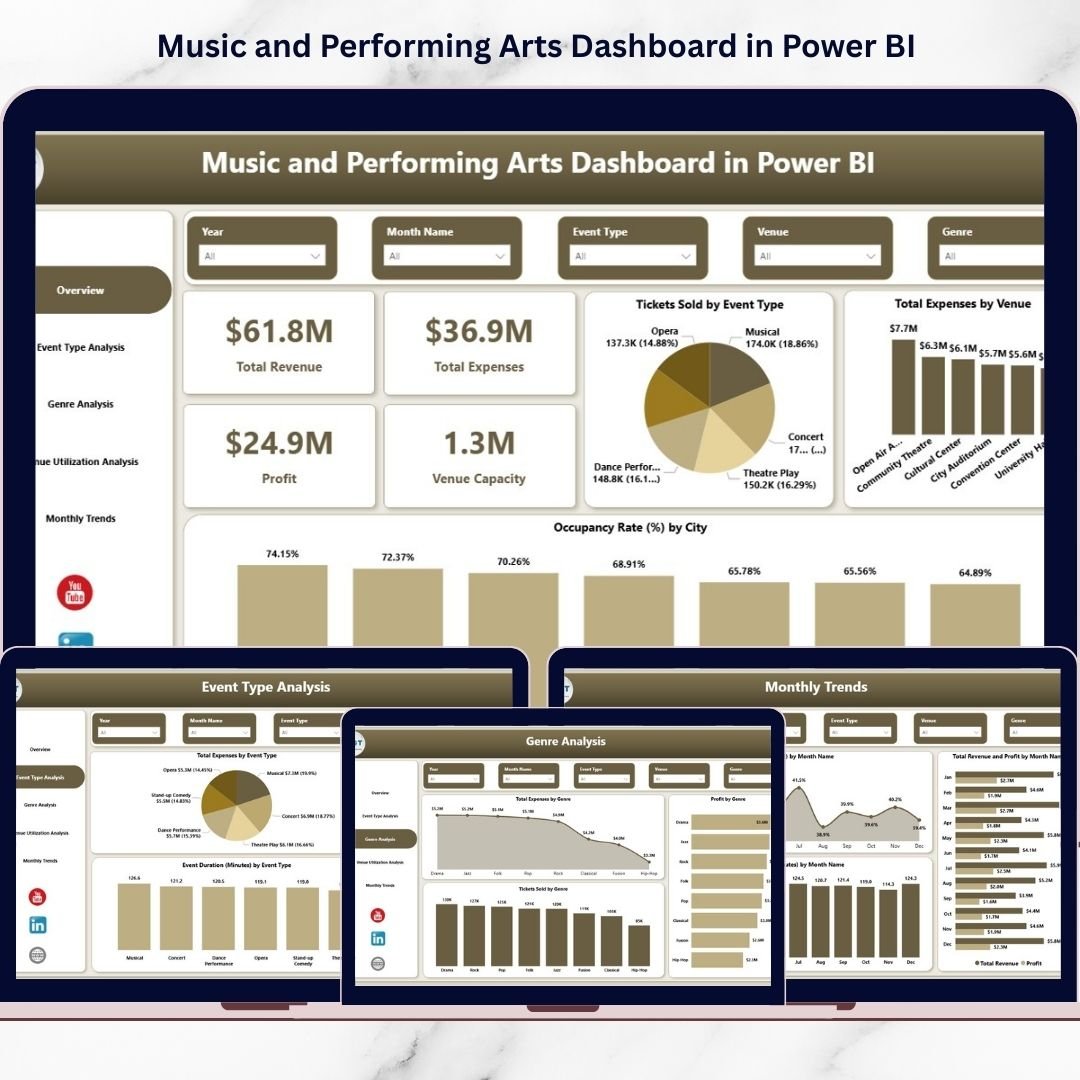
The Music and Performing Arts Dashboard in Power BI is designed to eliminate these challenges by transforming complex event data into clear, interactive, and visually powerful analytics. Instead of analyzing multiple reports separately, this ready-to-use dashboard centralizes all key performance indicators into one intelligent platform.
Built using Microsoft Power BI, this solution enables organizers to monitor ticket sales, expenses, profitability, venue utilization, and audience trends in real time. Whether managing concerts, cultural programs, dance performances, or theatre productions, this dashboard provides instant clarity for smarter planning and higher profitability.
Organizations can instantly identify which events perform best, which venues generate maximum returns, and how audience behavior changes over time — all through dynamic visuals and automated calculations.
⭐ Key Features of Music and Performing Arts Dashboard in Power BI
🎵 Interactive multi-page Power BI dashboard for complete event analytics
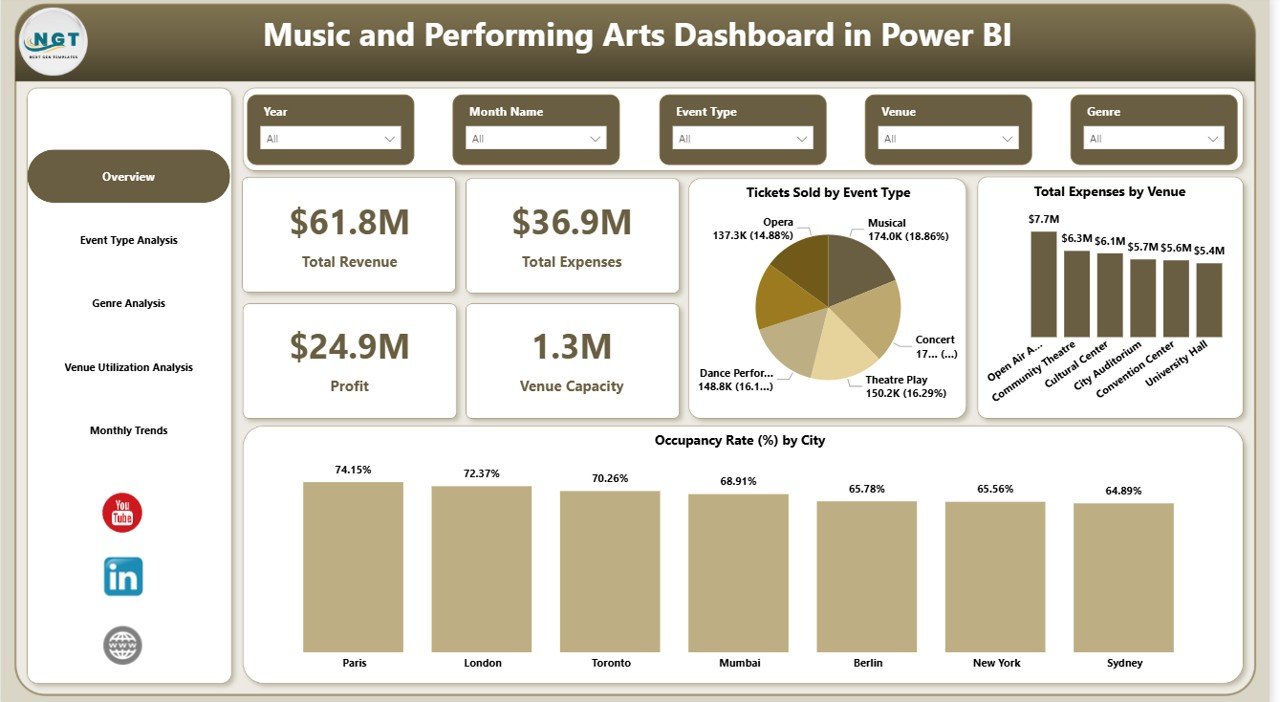
📊 Real-time KPI monitoring including Revenue, Expenses, Profit, and Venue Capacity
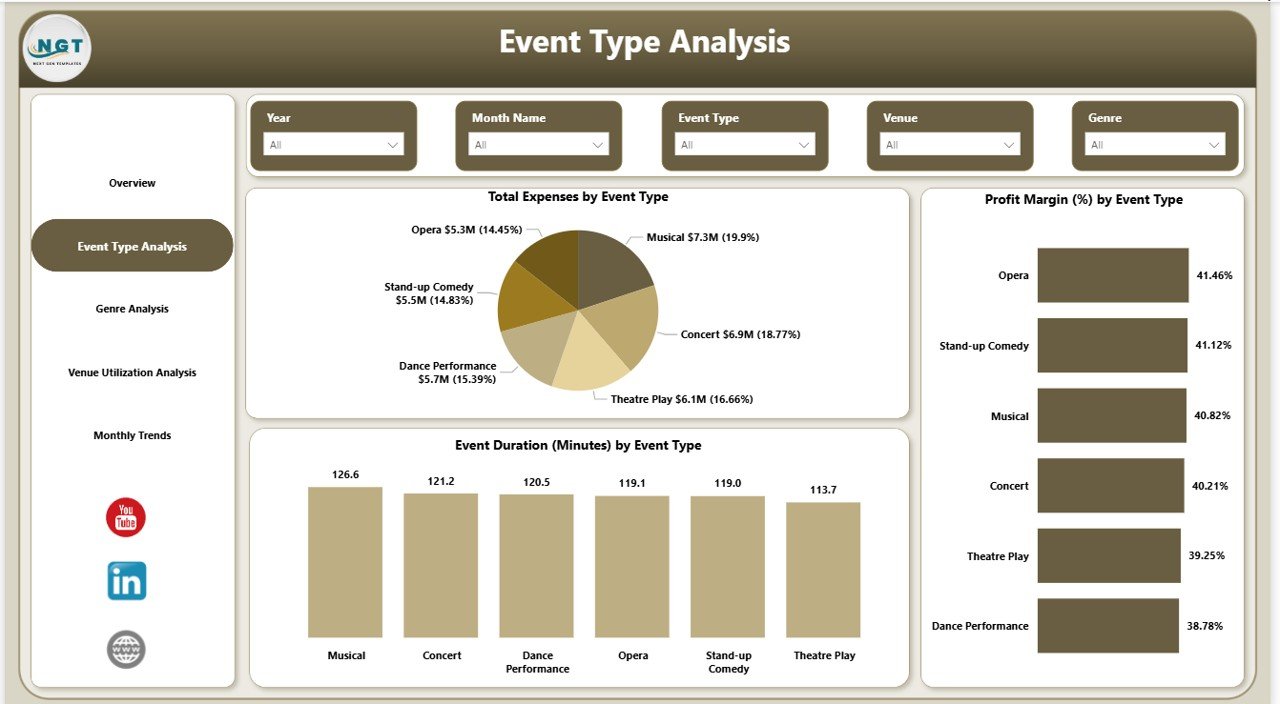
🎭 Event Type Analysis to compare concerts, theatre shows, and cultural events
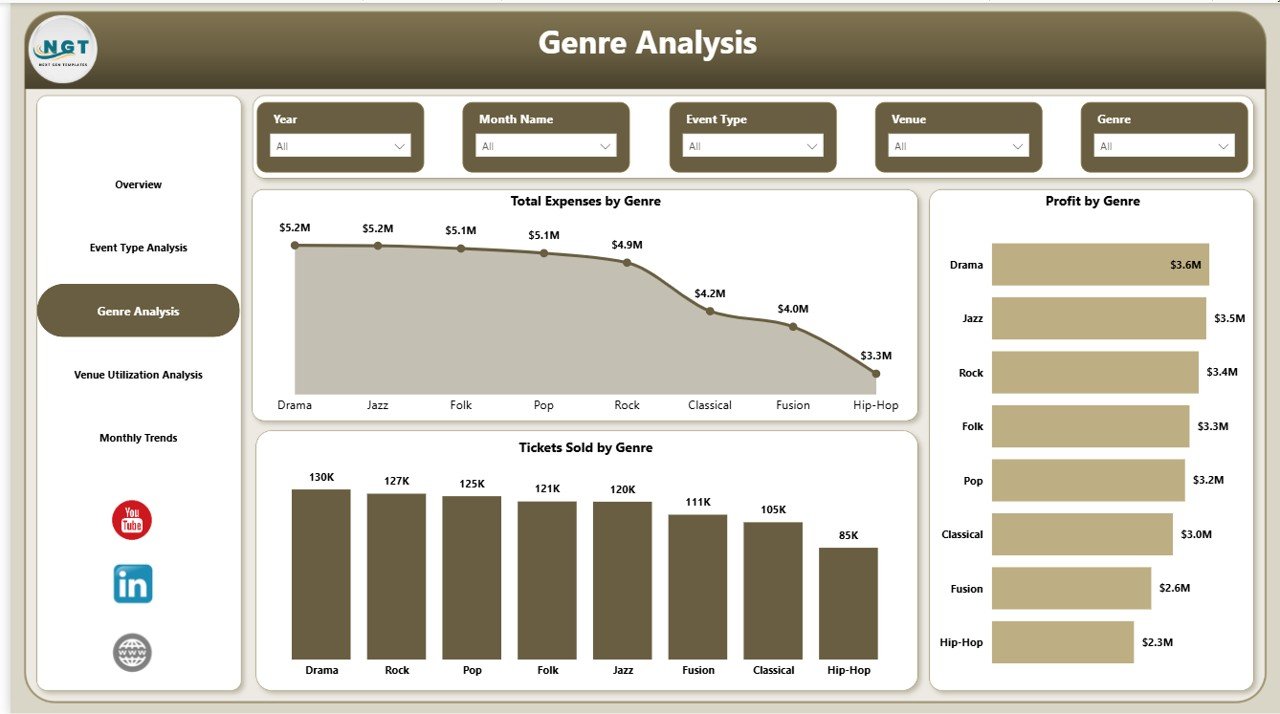
🎶 Genre Performance insights to identify profitable music categories
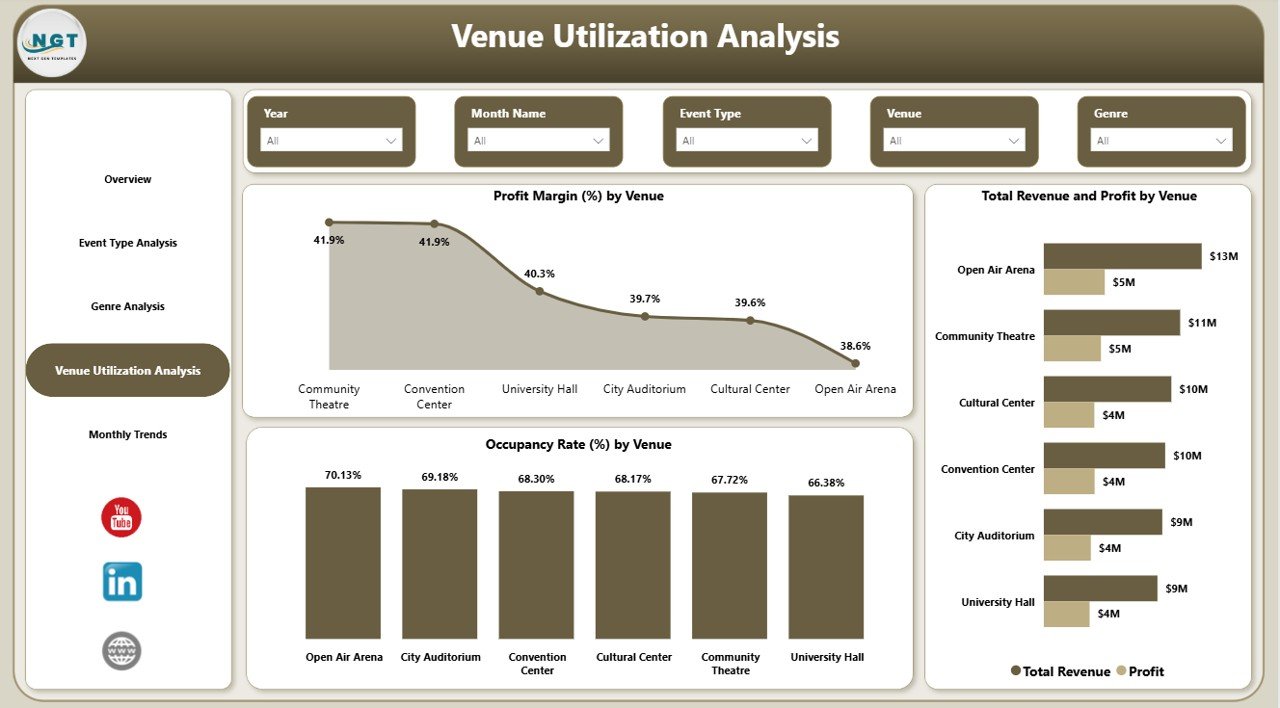
🏟️ Venue Utilization tracking to optimize seating and infrastructure usage
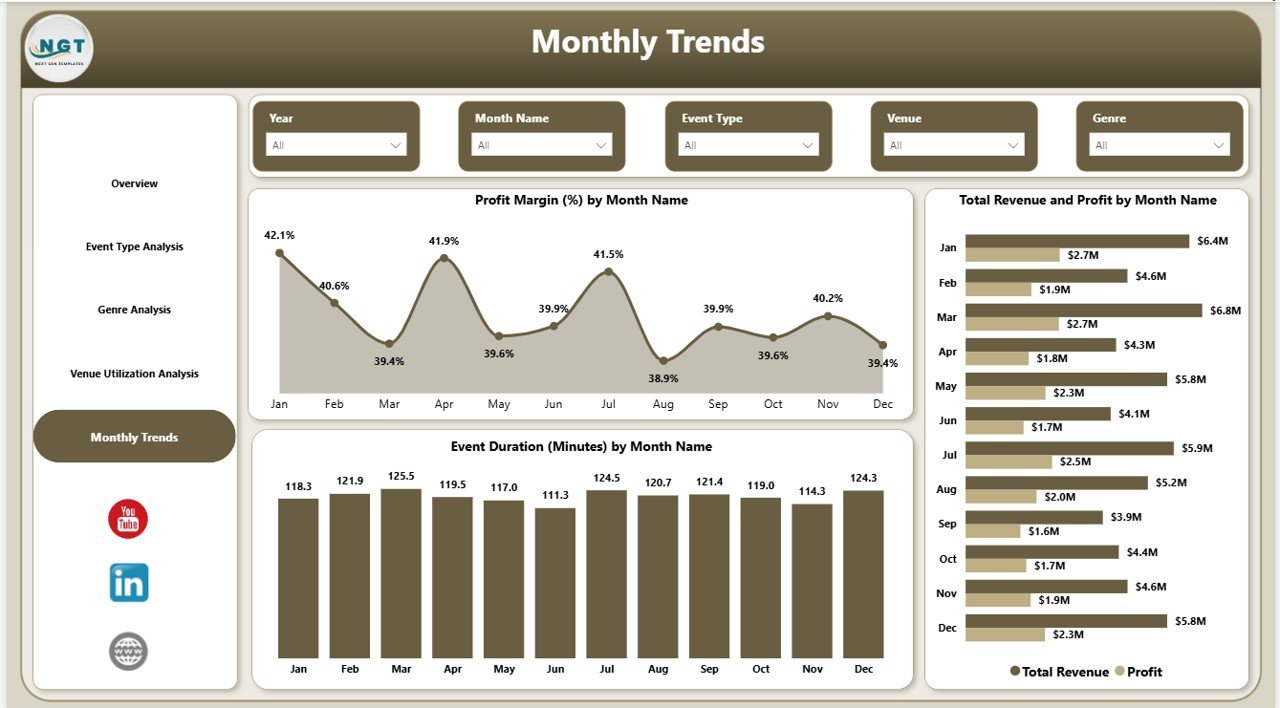
📅 Monthly Trend analysis for seasonal performance planning
🔍 Smart slicers and filters for instant data exploration
⚡ Automated calculations eliminating manual reporting efforts
📈 Dynamic visual charts for faster decision-making
Each dashboard page focuses on a specific performance area, helping stakeholders analyze data from multiple perspectives without complexity.
📦 What’s Inside the Music and Performing Arts Dashboard in Power BI
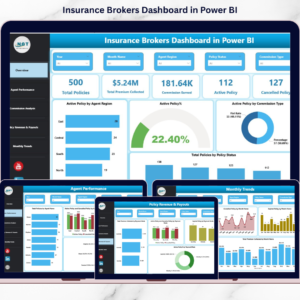
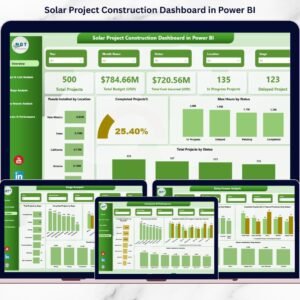
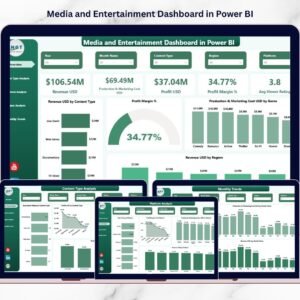
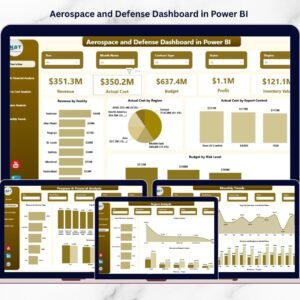
This ready-to-use Power BI file includes five powerful analytical pages:
✅ Overview Page – Financial summary with KPI cards and performance charts
✅ Event Type Analysis – Compare profitability and expenses by event categories
✅ Genre Analysis – Understand audience preferences and revenue contribution
✅ Venue Utilization Analysis – Measure occupancy rates and venue efficiency
✅ Monthly Trends Page – Track performance patterns across the year
Together, these pages provide a complete 360° performance view of performing arts operations.
⚙️ How to Use the Music and Performing Arts Dashboard in Power BI
Using this dashboard is simple and beginner-friendly:
1️⃣ Import your event data such as ticket sales, expenses, and venue details
2️⃣ Refresh the Power BI dataset
3️⃣ Use slicers to filter by event type, genre, venue, or month
4️⃣ Analyze KPIs and charts instantly
5️⃣ Share insights with stakeholders for faster decisions
No advanced technical knowledge is required — the dashboard is designed for practical business users.
👥 Who Can Benefit from This Music and Performing Arts Dashboard
This dashboard is ideal for:
🎤 Event Managers and Festival Organizers
🎭 Theatre and Performing Arts Companies
🎶 Music Production and Concert Management Teams
🏟️ Venue Owners and Operators
📊 Financial Analysts and Business Strategists
🎨 Cultural Institutions and Entertainment Organizations
Anyone responsible for managing live events or performance analytics can leverage this dashboard to improve efficiency and profitability.
The entertainment industry is rapidly becoming data-driven. Organizations that rely on analytics gain stronger financial control, improved audience understanding, and better event planning capabilities.
The Music and Performing Arts Dashboard in Power BI empowers teams to move beyond guesswork and make decisions backed by real data. By combining revenue tracking, venue analytics, genre insights, and monthly trends into one intelligent solution, this dashboard helps organizations save time, reduce costs, and maximize event success.
Click here to read the Detailed blog post
Watch the step-by-step video tutorial: