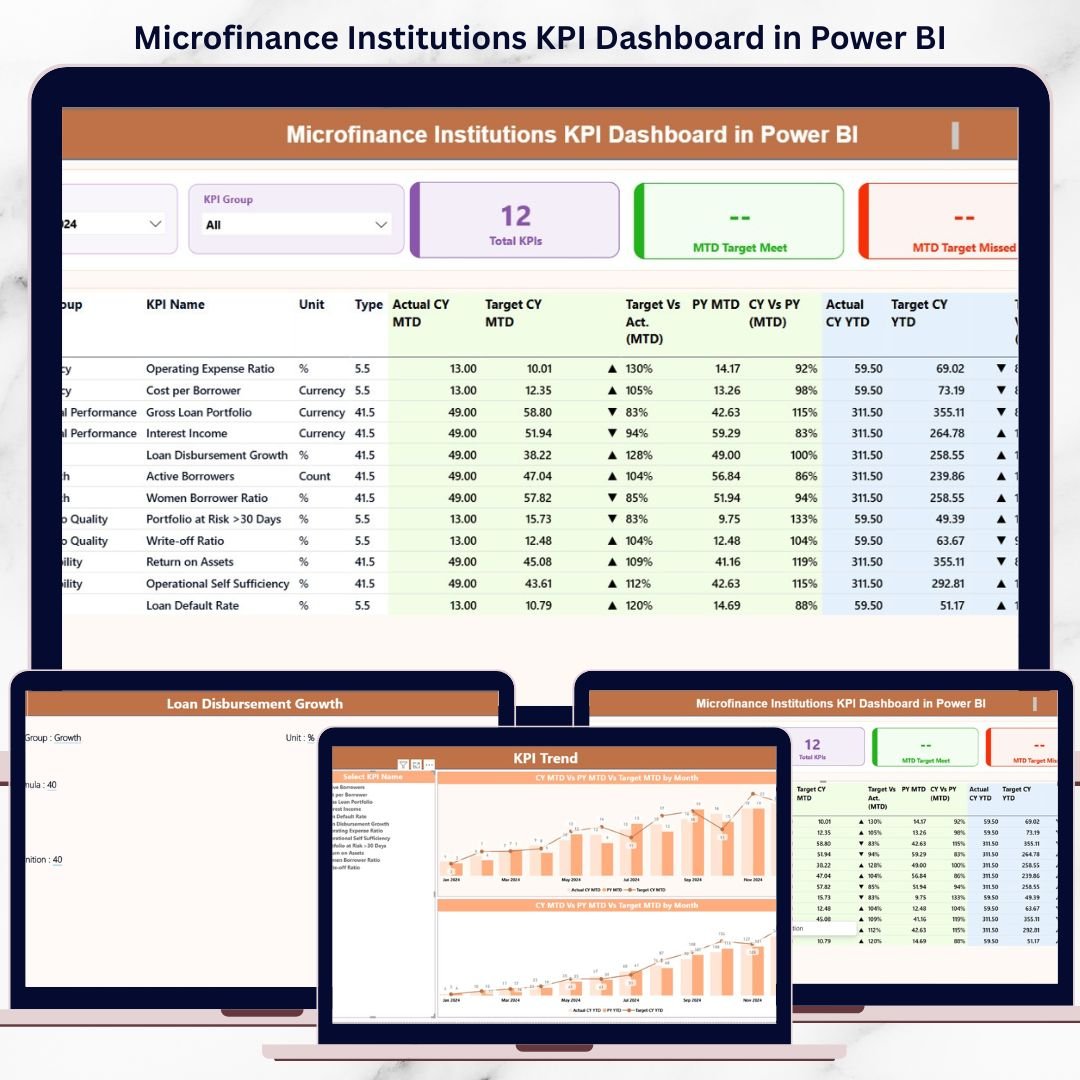
In today’s competitive and impact-driven financial ecosystem, microfinance institutions must make fast, informed, and confident decisions. However, relying on scattered Excel files, delayed reports, or manual summaries often leads to missed opportunities and increased risk. That is exactly why the Microfinance Institutions KPI Dashboard in Power BI becomes a powerful, must-have analytics solution for modern MFIs.
This ready-to-use dashboard transforms raw operational and financial data into clear, interactive, and actionable insights. By combining Excel-based data entry with advanced Power BI visualization, this product enables microfinance leaders to monitor performance, track targets, and analyze trends effortlessly—without technical complexity.
Key Features of Microfinance Institutions KPI Dashboard in Power BI
📊 Centralized KPI Monitoring
Track all critical microfinance KPIs from a single, interactive dashboard instead of juggling multiple reports.
📅 MTD & YTD Performance Tracking
Analyze Month-to-Date and Year-to-Date results side by side for better short-term and long-term visibility.
🎯 Target vs Actual Comparison
Instantly identify whether KPIs are meeting or missing targets using icons, percentages, and color indicators.
📈 Trend Analysis with Combo Charts
Visualize performance movement over time with Actual vs Target vs Previous Year trends.
🧠 Clear KPI Definitions & Logic
Built-in KPI definitions, formulas, and LTB/UTB logic ensure clarity and consistency across teams.
🔄 Excel-Based Data Input
Enter data easily in Excel while Power BI handles all calculations and visualizations automatically.
What’s Inside the Microfinance Institutions KPI Dashboard in Power BI
📁 Excel Data Input File
-
Input_Actual sheet for MTD & YTD actual values
-
Input_Target sheet for KPI targets
-
KPI Definition sheet with formulas, definitions, units, and KPI types
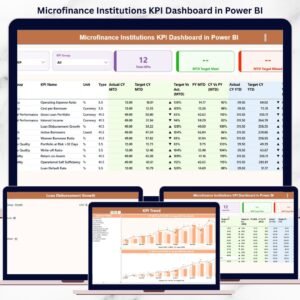
📊 Power BI Dashboard with 3 Pages
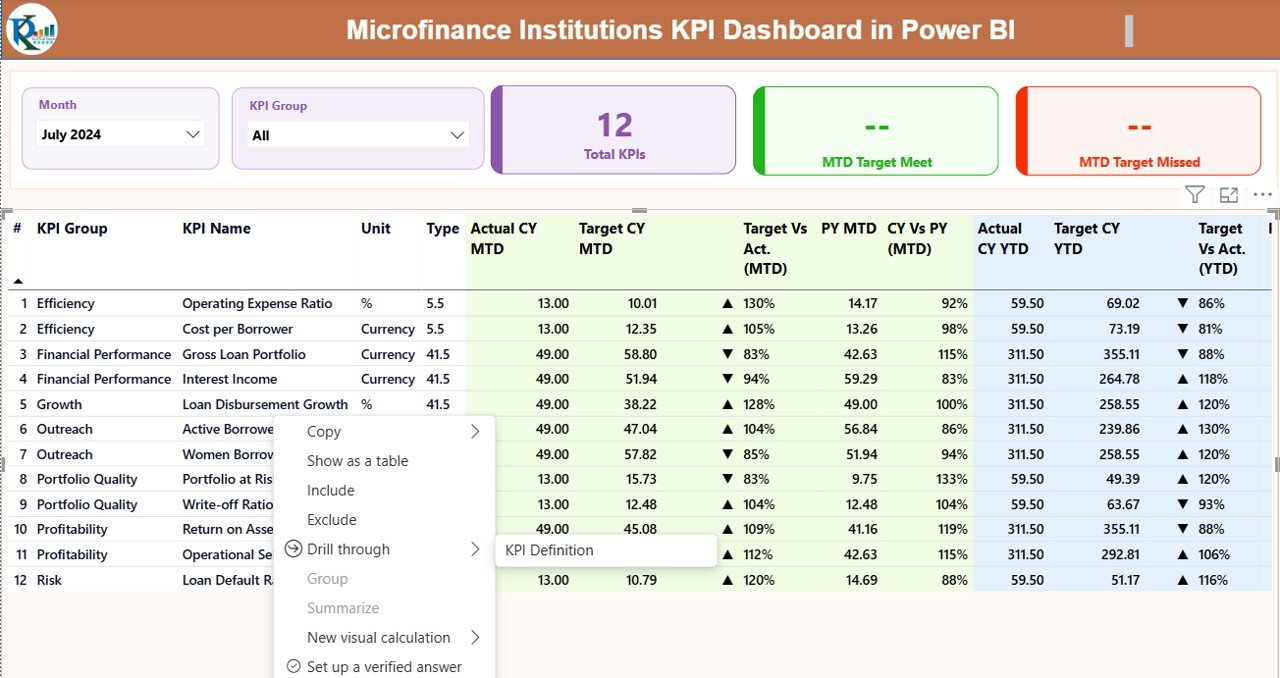
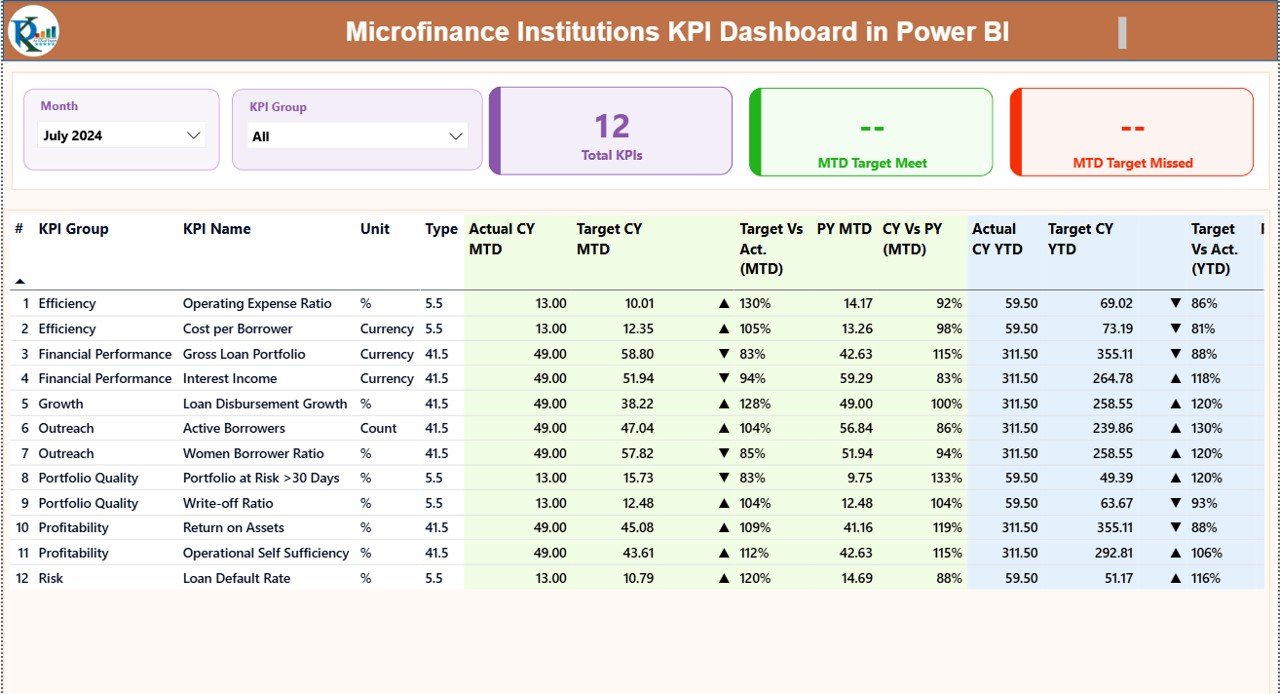
🔹 Summary Page
-
Month and KPI Group slicers
-
KPI cards showing Total KPIs, Target Met, and Target Missed
-
Detailed KPI table with MTD & YTD metrics, icons, and comparisons
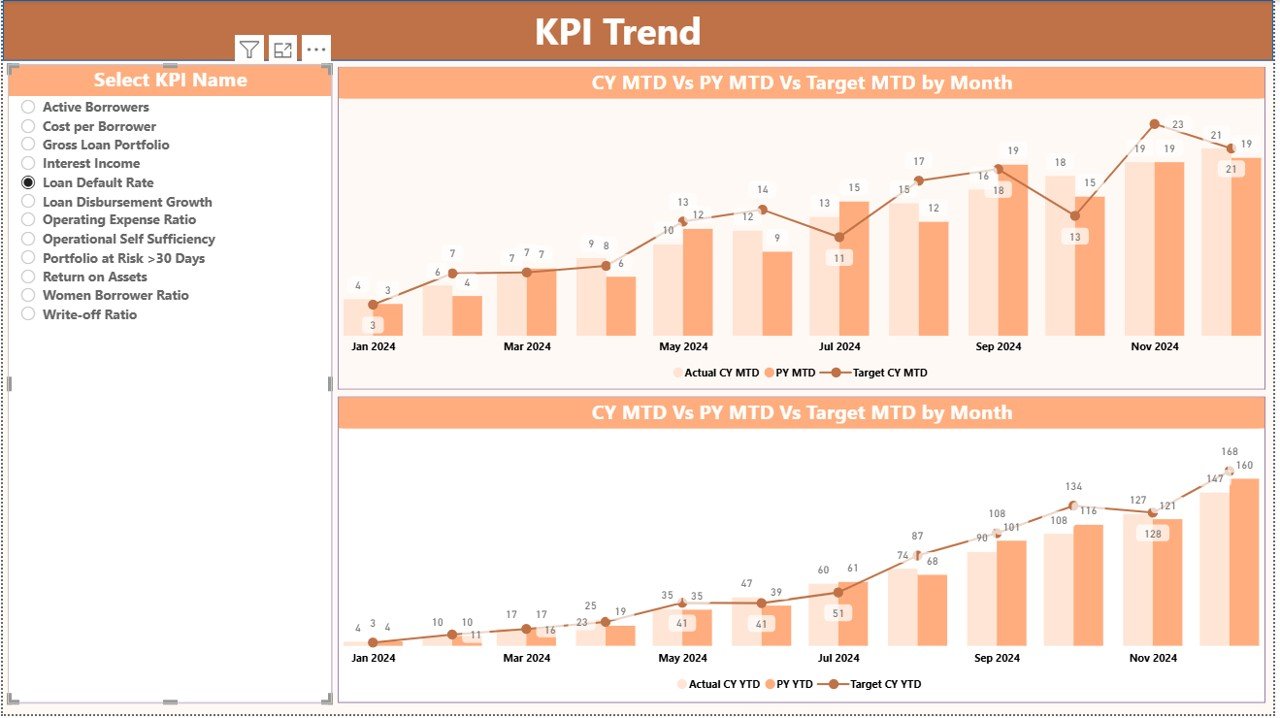
🔹 KPI Trend Page
-
KPI selector slicer
-
MTD trend chart (Actual vs Target vs PY)
-
YTD trend chart (Actual vs Target vs PY)
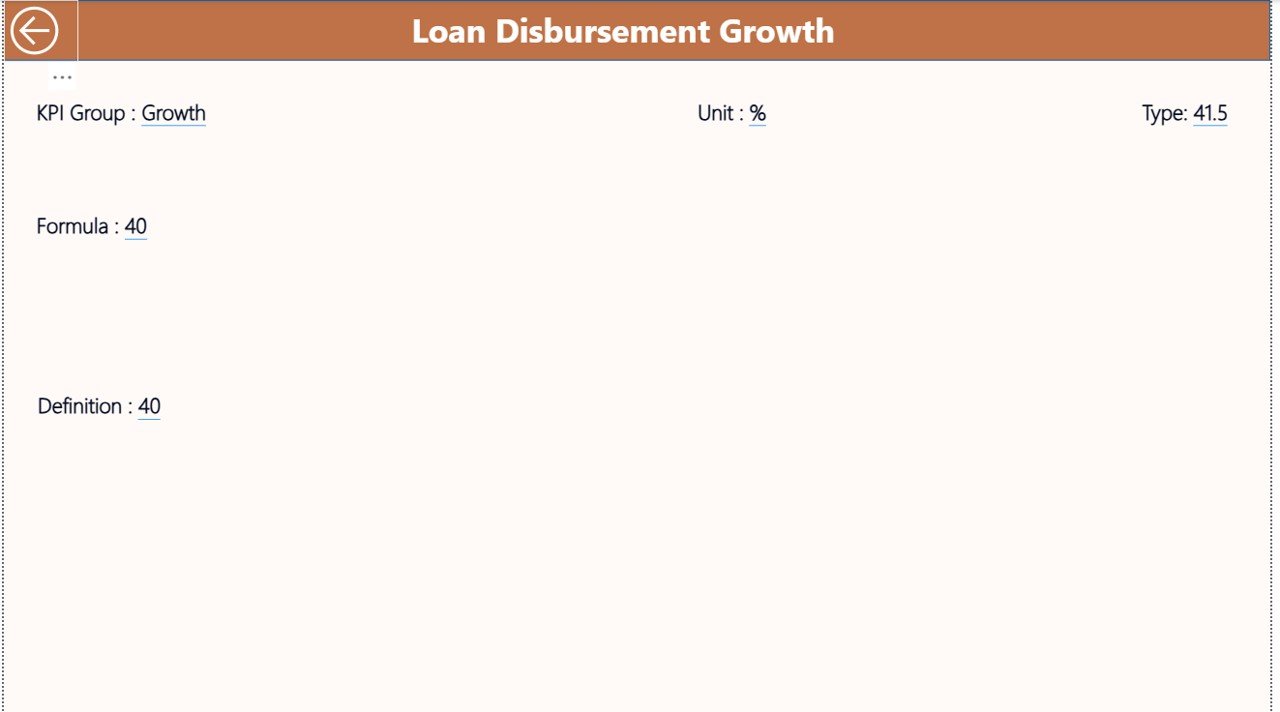
🔹 KPI Definition Page
-
Drill-through view for KPI formula, definition, and type
-
Back button for smooth navigation
This structure ensures both high-level monitoring and deep KPI-level analysis.
How to Use the Microfinance Institutions KPI Dashboard in Power BI
📝 Step 1: Enter Data in Excel
Update actual and target values monthly using the structured Excel input sheets.
🔄 Step 2: Refresh Power BI
Click refresh in Power BI to update all visuals automatically.
🎛️ Step 3: Use Slicers & Filters
Select Month and KPI Group to analyze specific segments instantly.
📊 Step 4: Analyze Performance
Review KPI cards, tables, trends, and drill-through definitions to support decisions.
This simple workflow makes the dashboard ideal even for non-technical users.
Who Can Benefit from This Microfinance Institutions KPI Dashboard in Power BI
👥 Microfinance Institution Managers
📊 Finance & MIS Teams
📈 Operations & Field Managers
🏦 Donor & Impact Reporting Teams
🧠 Strategy & Planning Departments
Whether you manage a small MFI or a growing microfinance network, this dashboard scales effortlessly with your needs.
Click here to read the Detailed Blog Post
Visit our YouTube channel to learn step-by-step video tutorials


Reviews
There are no reviews yet.