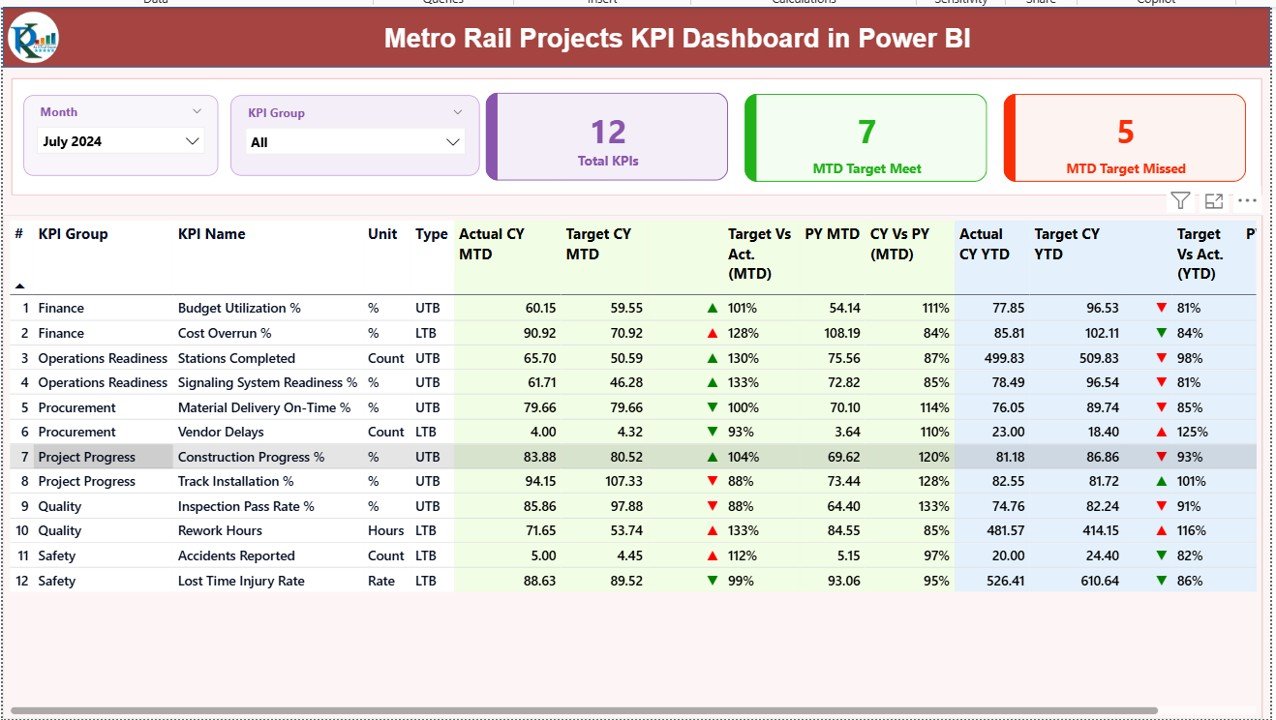
Metro rail projects demand precision, transparency, and continuous performance monitoring. With massive budgets, tight timelines, and public accountability, even a small delay or cost overrun can escalate into a major risk. However, many project teams still depend on scattered Excel files, manual reports, and static presentations. As a result, visibility drops and decision-making slows down.Metro Rail Projects KPI Dashboard in Power BI
That is exactly where the Metro Rail Projects KPI Dashboard in Power BI becomes a powerful game-changer 🚆📊.
This ready-to-use dashboard converts complex metro rail project data into clear, interactive, and actionable insights. It allows leadership teams, project managers, and engineers to monitor performance across critical KPIs from one centralized Power BI dashboard. As a result, teams gain speed, clarity, and stronger control throughout the project lifecycle.
## 🚀 Key Features of Metro Rail Projects KPI Dashboard in Power BI
✅ Centralized KPI Monitoring – Track all metro rail project KPIs from a single dashboard without juggling multiple reports.
📅 Month & KPI Group Slicers – Instantly filter performance by reporting month or KPI category.
📊 MTD & YTD Analysis – Monitor Month-to-Date and Year-to-Date performance side by side.
🎯 Target vs Actual Tracking – Quickly identify whether KPIs are meeting or missing targets.
📈 Previous Year Comparison – Analyze current performance against last year to identify improvement or decline.
🔺🔻 Visual Performance Indicators – Green and red icons instantly highlight success or risk.
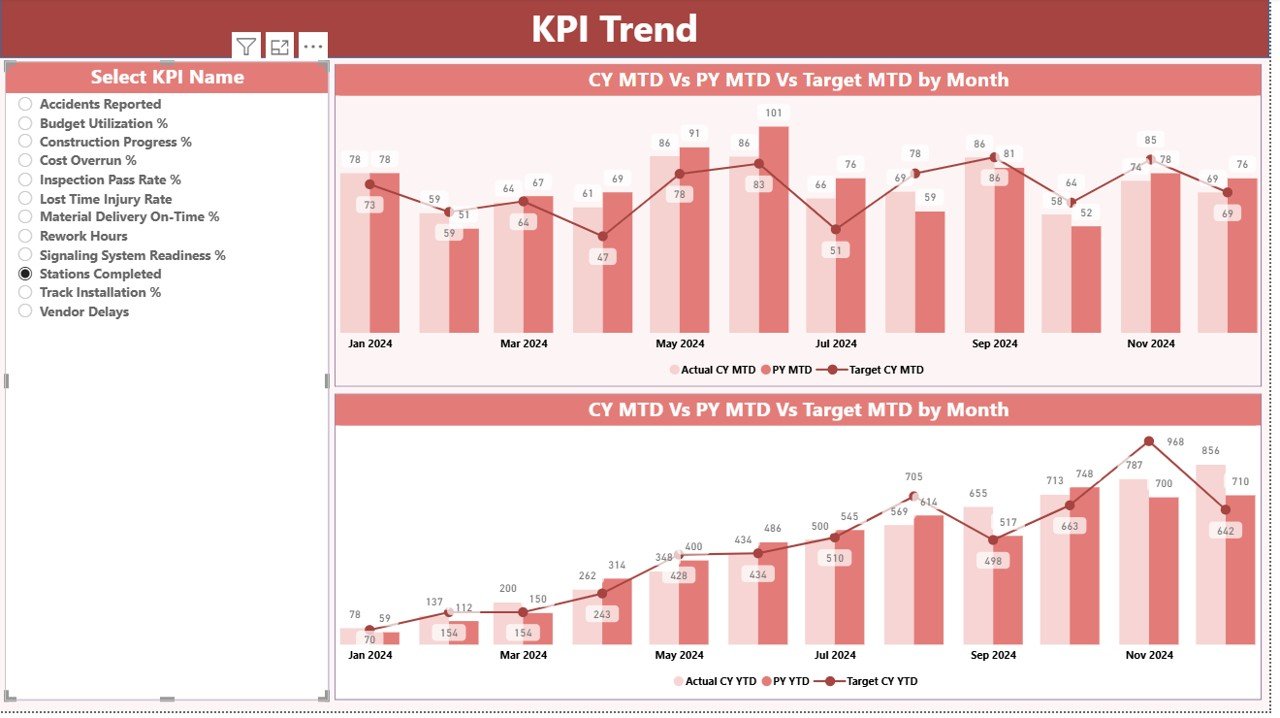
📉 Trend Analysis Charts – Understand performance direction using MTD and YTD trend charts.Metro Rail Projects KPI Dashboard in Power BI
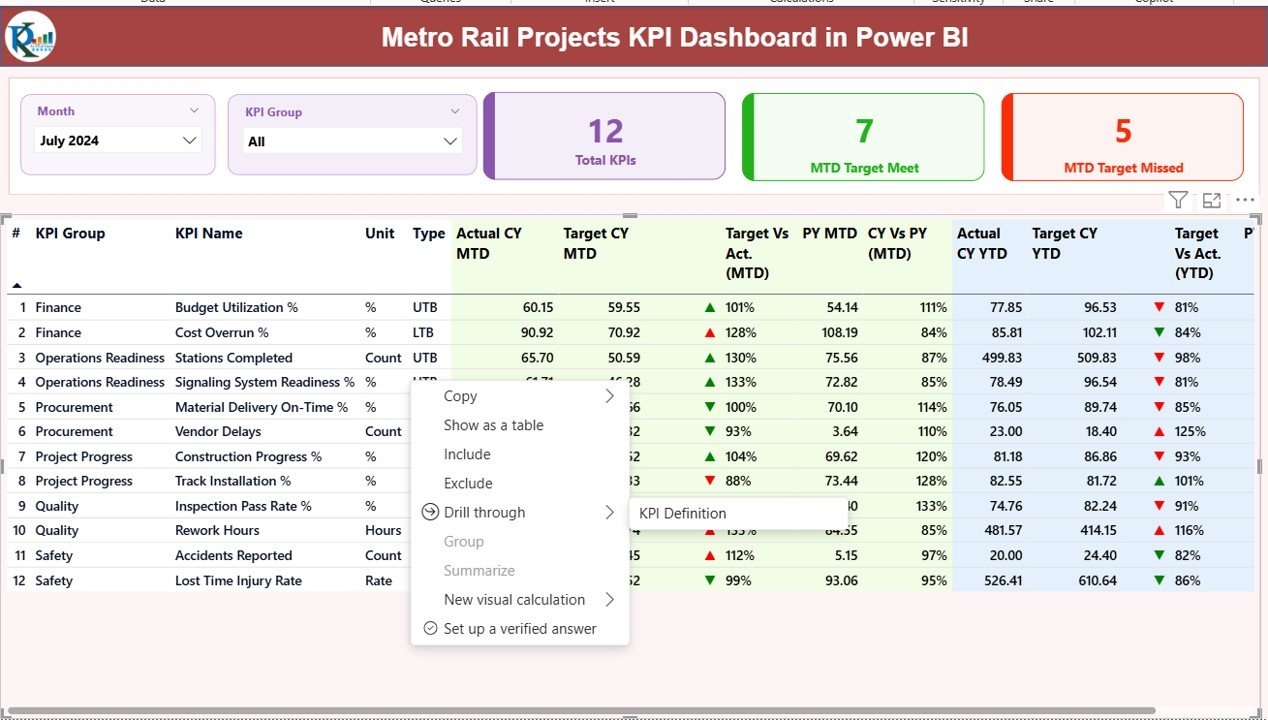
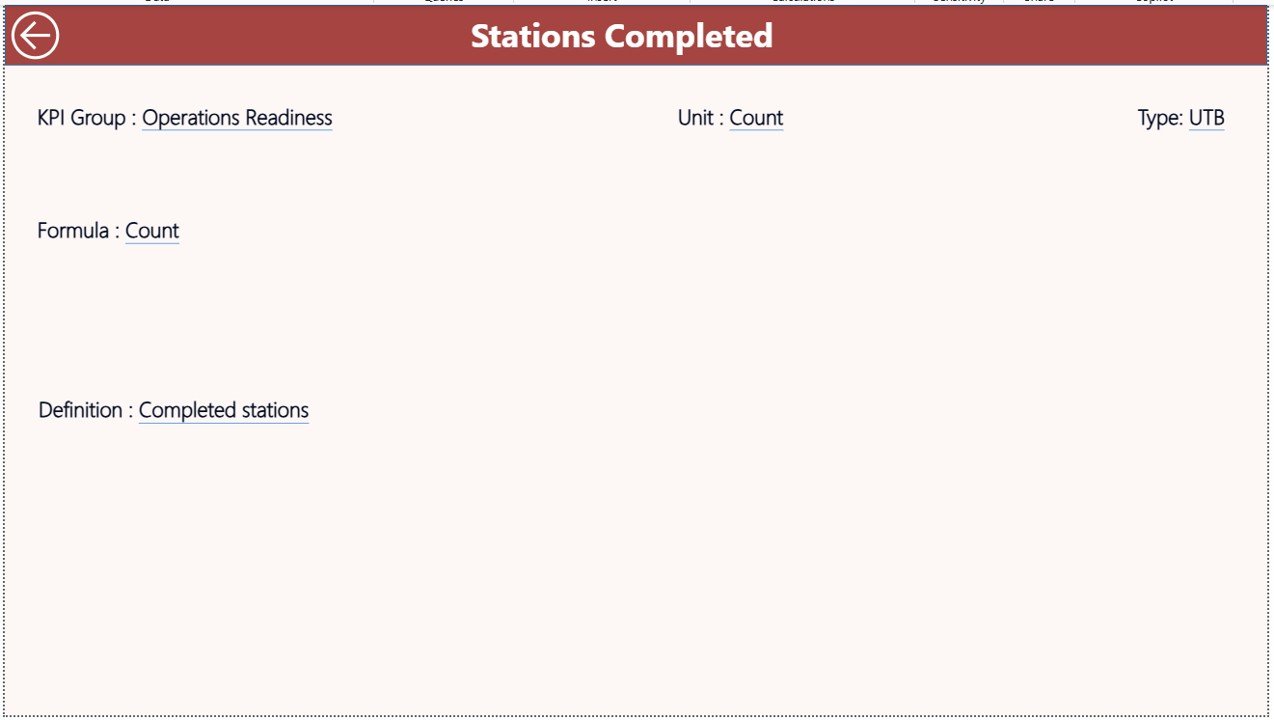
📘 KPI Definition Drill-Through – View KPI formulas, definitions, and logic with a single click.
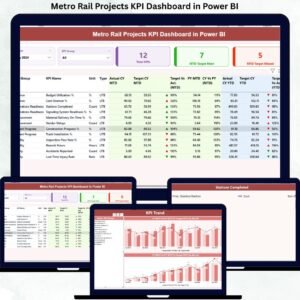
## 📦 What’s Inside the Metro Rail Projects KPI Dashboard
This Power BI solution includes three structured analytical pages, designed for clarity and fast decision-making:Metro Rail Projects KPI Dashboard in Power BI
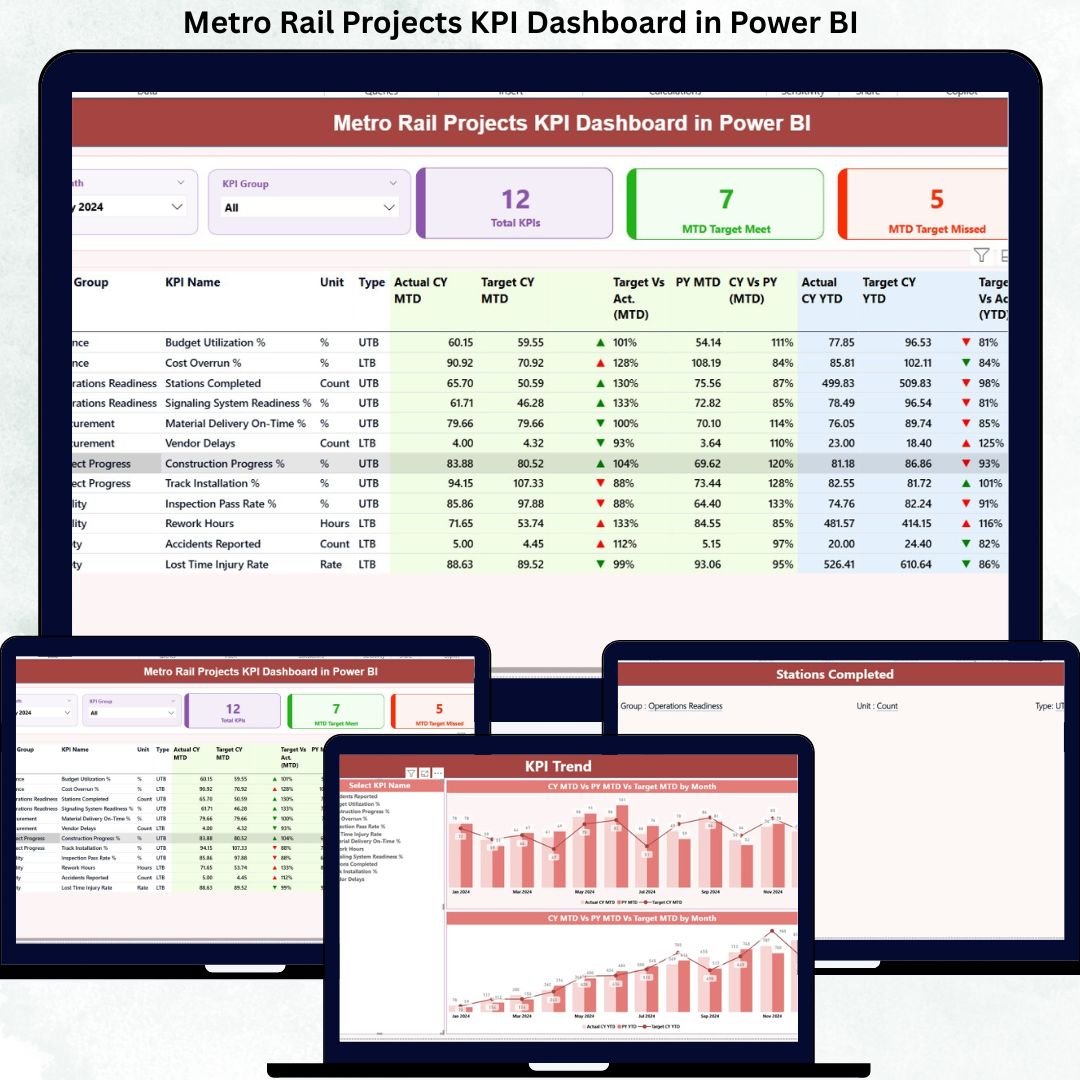
📌 Summary Page
Acts as the control center of the dashboard. It displays month and KPI group slicers, KPI cards showing total KPIs, target met, and target missed counts, along with a detailed KPI table. The table covers MTD and YTD actuals, targets, previous year values, and performance percentages.
📌 KPI Trend Page
Focuses on historical performance trends. Users can select a KPI and analyze Actual vs Target vs Previous Year performance using combo charts for both MTD and YTD views.
📌 KPI Definition Page
A drill-through reference page that displays KPI number, group, name, unit, formula, definition, and KPI type (LTB or UTB). This ensures clarity, standardization, and audit readiness.
## 🛠️ How to Use the Metro Rail Projects KPI Dashboard
Using this dashboard is simple and does not require advanced Power BI skills.Metro Rail Projects KPI Dashboard in Power BI
🧾 Step 1: Enter actual KPI values in the Input_Actual Excel sheet
🎯 Step 2: Enter target values in the Input_Target Excel sheet
📘 Step 3: Define KPIs clearly in the KPI Definition sheet
🔄 Step 4: Refresh Power BI to update all visuals automatically
📊 Step 5: Use slicers, tables, and charts to analyze performance instantly
Because Excel acts as the data source, data entry remains easy and flexible, while Power BI handles all calculations and visuals.
## 👥 Who Can Benefit from This Product?
This dashboard is ideal for:
🚆 Metro Rail Authorities
🏗️ Project Management Units (PMUs)
📐 Engineering & Planning Teams
💰 Finance & Cost Control Departments
🏛️ Government Infrastructure Agencies
🤝 EPC & Infrastructure Contractors
Whether you manage a single metro corridor or a large multi-city network, this dashboard adapts easily to your needs.
Click here to read the Detailed blog post
Watch the step-by-step video tutorial:
Visit our YouTube channel to learn step-by-step video tutorials:
YouTube Channel


Reviews
There are no reviews yet.