Urban transportation systems move millions of passengers every day. Metro and subway authorities must continuously balance passenger demand, congestion control, revenue optimization, energy efficiency, and service reliability. However, when operational data remains scattered across raw Excel files, static reports, or disconnected systems, decision-making becomes slow and reactive.
That is exactly where the Metro and Subway Dashboard in Excel becomes an essential operational intelligence tool 🚆📊.
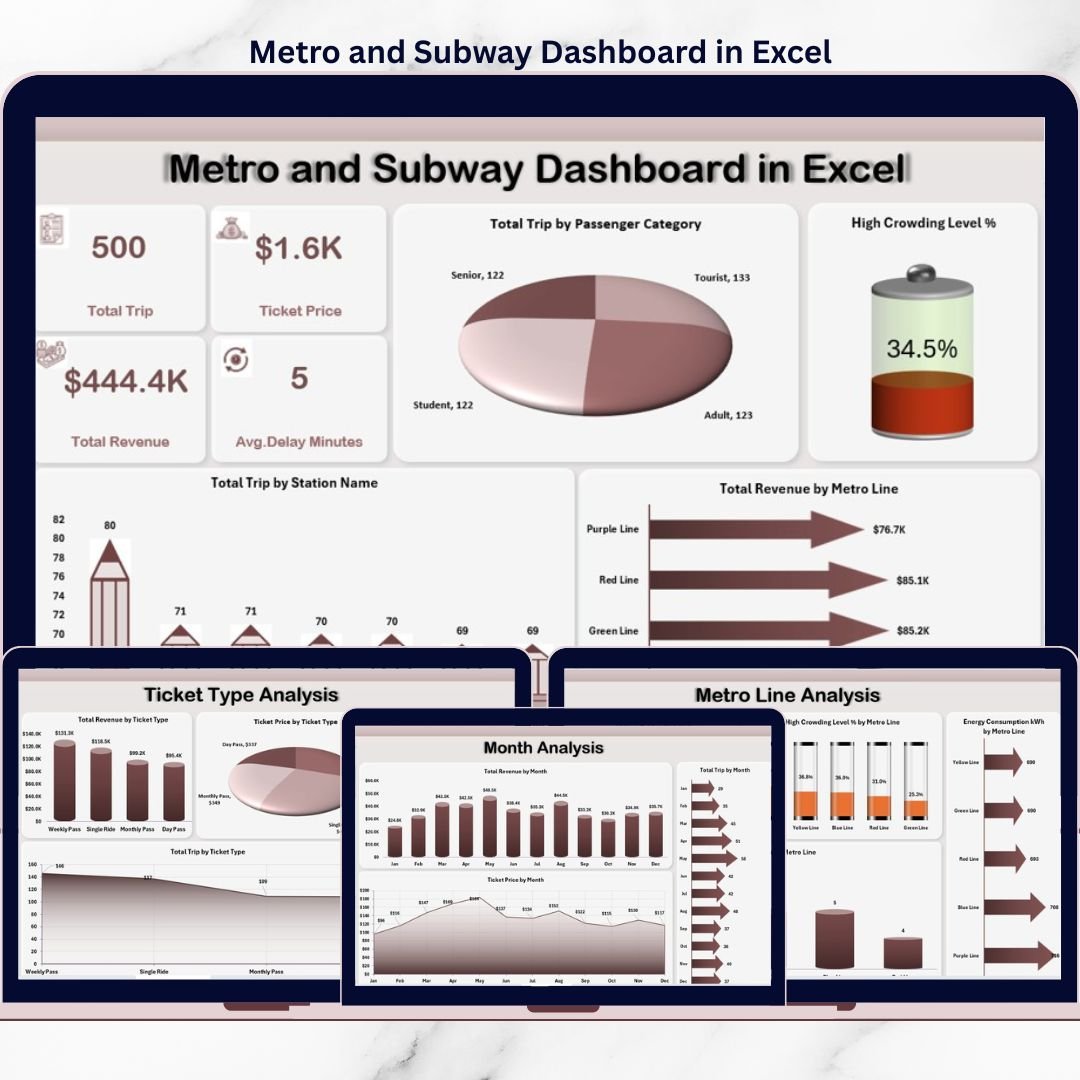
This ready-to-use Excel dashboard is designed to help metro authorities, transport planners, and operations teams monitor trips, passenger categories, congestion levels, revenue, energy consumption, and delays from a single interactive Excel file. Instead of manually reviewing complex tables, this dashboard transforms raw metro data into clear visuals, KPI cards, and trend-based insights.
Because the dashboard is built entirely in Microsoft Excel, it remains cost-effective, easy to maintain, and highly customizable. You do not need advanced BI tools or technical skills. Simply update your data, refresh pivot tables, and instantly view updated insights.
With multiple analytical pages, right-side slicers, and a professional page navigator, this dashboard supports faster operational decisions, better capacity planning, and improved passenger experience.
## 🚆 Key Features of Metro and Subway Dashboard in Excel
This dashboard is designed specifically for real-world metro and subway operations.
📊 Centralized Metro Performance Monitoring
All key operational metrics in one Excel dashboard.
🧭 Page Navigator for Smooth Navigation
One-click movement across dashboard pages.
🎯 Interactive Slicers
Filter data by city, metro line, ticket type, passenger category, and month.
🚦 Congestion & Delay Visibility
Quick identification of crowding and reliability issues.
⚡ Energy Consumption Tracking
Monitor energy usage line-wise.
📈 Trend-Based Analysis
Understand monthly and seasonal patterns.
🧩 100% Excel-Native & Customizable
No external tools or coding required.
## 📂 What’s Inside the Metro and Subway Dashboard in Excel
This dashboard includes 5 professionally designed analytical pages, supported by structured data and support sheets.
📊 Overview Page
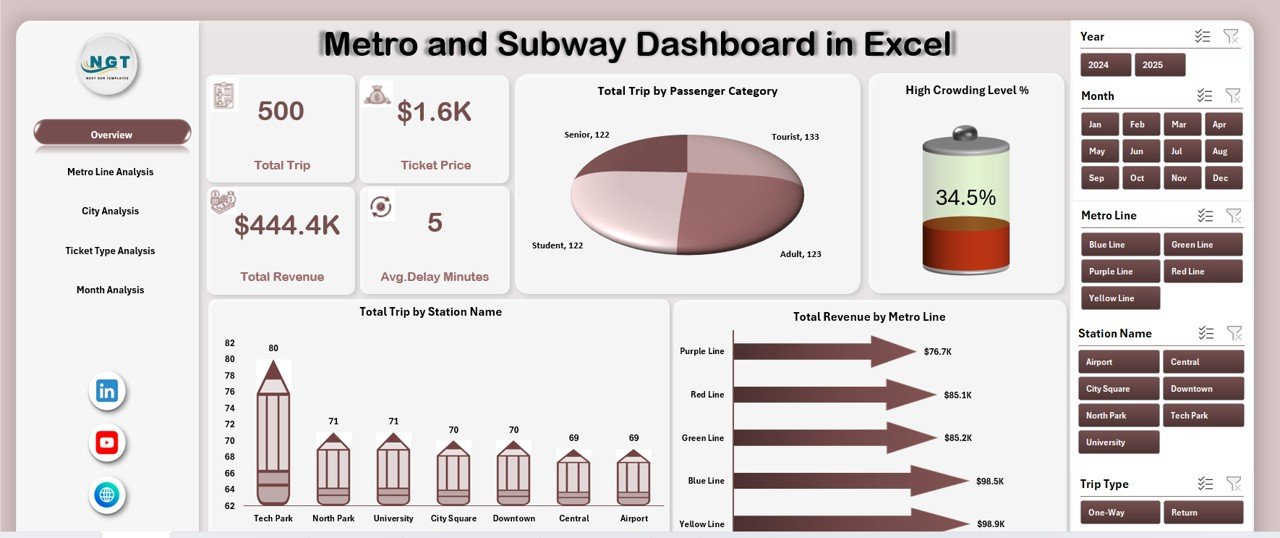
The main control panel of the dashboard with:
-
Right-side slicer for filtering
-
4 KPI cards for summary insights
-
4 high-impact charts
Charts included:
-
Total Trips by Passenger Category
-
High Crowding Level %
-
Total Trips by Station Name
-
Total Revenue by Metro Line
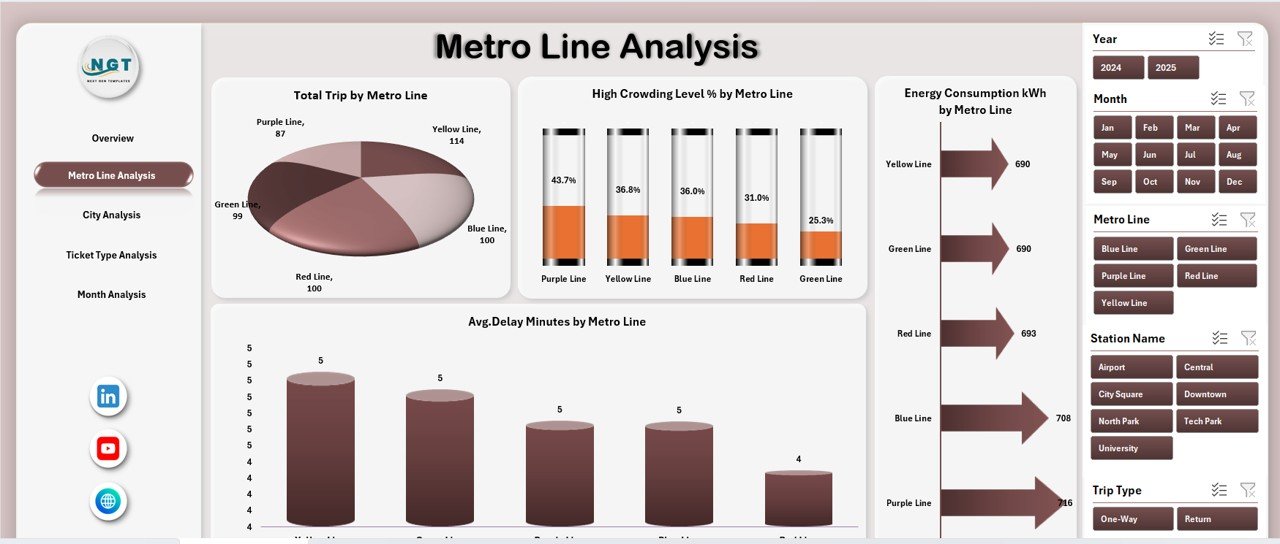
🚆 Metro Line Analysis Page
Line-wise operational performance analysis using:
-
Total Trips by Metro Line
-
High Crowding Level % by Metro Line
-
Energy Consumption (kWh) by Metro Line
-
Average Delay Minutes by Metro Line
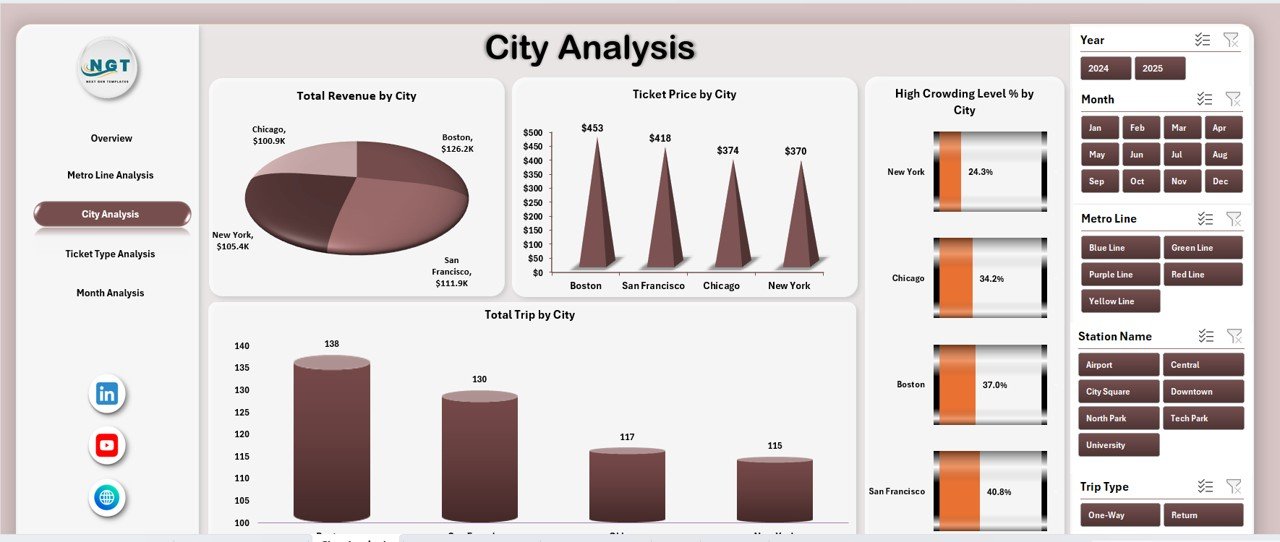
🌆 City Analysis Page
City-level insights with:
-
Total Trips by City
-
High Crowding Level % by City
-
Ticket Price by City
-
City-wise trip distribution
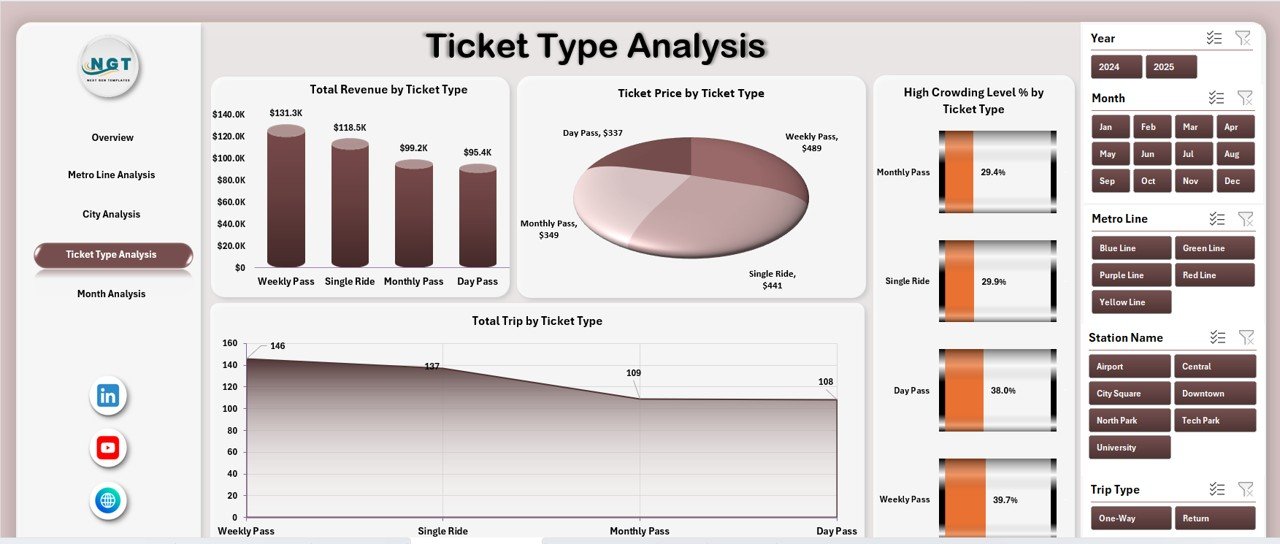
🎟️ Ticket Type Analysis Page
Ticket strategy evaluation using:
-
Total Trips by Ticket Type
-
High Crowding Level % by Ticket Type
-
Ticket Price by Ticket Type
-
Ticket usage distribution
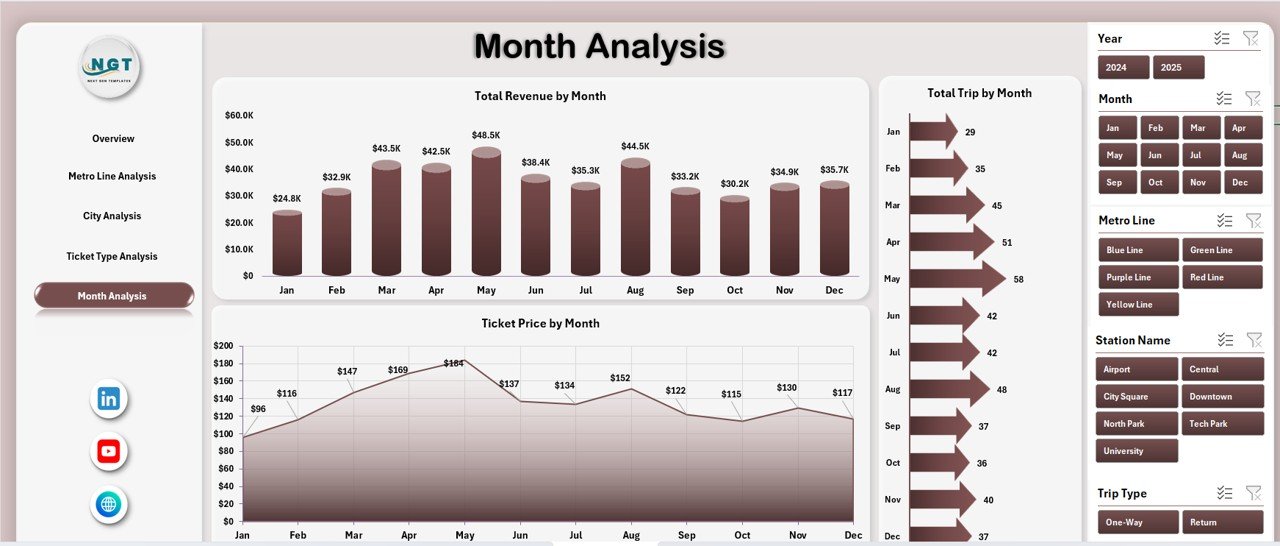
📅 Month Analysis Page
Time-based performance tracking with:
-
Total Trips by Month
-
Ticket Price by Month
-
Monthly trip trends
📁 Data Sheet & Support Sheet
-
Data Sheet stores all raw metro and subway data
-
Support Sheet manages helper calculations and lookups
This structure ensures accuracy, scalability, and long-term usability.
## 🛠️ How to Use the Metro and Subway Dashboard in Excel
Using the dashboard is simple and user-friendly:
1️⃣ Enter or update metro data in the Data Sheet
2️⃣ Refresh pivot tables
3️⃣ Use slicers to filter by city, line, ticket type, or month
4️⃣ Review KPI cards and charts instantly
5️⃣ Analyze congestion, revenue, energy usage, and delays
6️⃣ Use insights for scheduling, planning, and optimization
No advanced Excel skills required.
## 👥 Who Can Benefit from This Metro and Subway Dashboard
This dashboard is ideal for:
✔️ Metro & Subway Authorities
✔️ Transport Operations Managers
✔️ City & Urban Planners
✔️ Revenue & Finance Teams
✔️ Energy Management Teams
✔️ Policy Makers & Analysts
Suitable for single-city and multi-city metro systems.
### Click here to read the Detailed blog post
Visit our YouTube channel to learn step-by-step video tutorials
👉 https://youtube.com/@PKAnExcelExpert


Reviews
There are no reviews yet.