


In the fast-paced world of medical device manufacturing, success depends on precision, quality, and compliance. From production yield to downtime analysis, every metric matters. That’s where the Medical Equipment Manufacturing KPI Dashboard in Power BI from NextGenTemplates.com comes in — a powerful, ready-to-use analytics solution designed for manufacturers who want complete visibility and control over their operations.
Built entirely in Microsoft Power BI, this interactive dashboard turns your Excel data into real-time visual insights. It empowers production managers, quality teams, and executives to track KPIs, monitor performance, and make informed, data-driven decisions — all in one place.
With automated visuals, MTD & YTD comparisons, and conditional formatting, this dashboard transforms complex manufacturing data into actionable intelligence for improving efficiency, safety, and profitability.
⚙️ Key Features of the Medical Equipment Manufacturing KPI Dashboard in Power BI
📊 3 Interactive Pages: Summary | KPI Trend | KPI Definition
📅 MTD & YTD Tracking: Analyze short-term and long-term performance at a glance.
🎯 Target vs Actual Comparison: Instantly identify KPIs that hit or miss targets.
📈 Dynamic Slicers: Filter by month or KPI group (Production, Quality, Maintenance).
🧮 Automated Formulas: Calculate variance, trends, and achievement % instantly.
💡 Color Indicators: Green ▲ for achieved targets and red ▼ for missed ones.
📘 Excel Integration: Updates automatically when Excel data changes.
🔍 Drill-Through Navigation: Click KPIs for detailed trend and definition analysis.
💻 No Coding Needed: 100% Power BI-based, intuitive, and customizable.
🏭 What’s Inside the Dashboard
📋 1️⃣ Summary Page – The Command Center
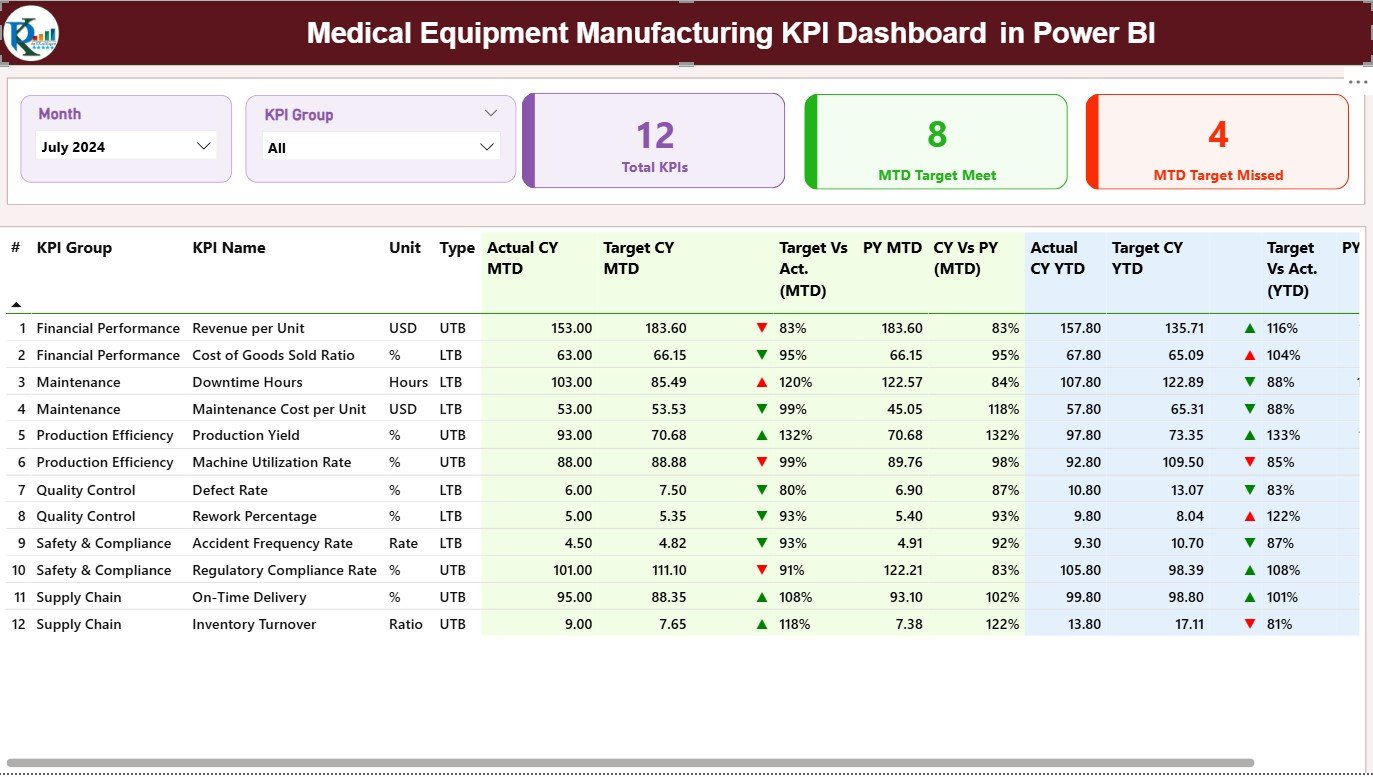
Your central control panel for monitoring all key manufacturing KPIs in one view.
Includes:
-
Slicers: Filter by month or KPI group dynamically.
-
KPI Cards:
-
Total KPIs Count
-
MTD Target Met Count
-
MTD Target Missed Count
-
-
KPI Table with Details:
KPI Number | KPI Group | KPI Name | Unit | Type (LTB/UTB) | MTD & YTD Actual vs Target | Icons | Variance % | CY vs PY
💡 Purpose: Provide top-level visibility across production, quality, and compliance — perfect for management dashboards or board reviews.
📈 2️⃣ KPI Trend Page – Visualize Performance Over Time
Analyze performance progress and spot trends for individual KPIs.
Features:
-
Slicer to select KPI Name.
-
Dual Combo Charts:
-
MTD Actual vs Target vs PY
-
YTD Actual vs Target vs PY
-
-
Visuals highlight growth, seasonality, or irregular patterns in performance.
💡 Purpose: Discover what’s driving improvement and where operational issues are recurring.
📘 3️⃣ KPI Definition Page – Detailed Drill-Through Insights
This hidden page allows users to access deeper context for each KPI.
Displays:
-
KPI Formula
-
KPI Definition / Description
-
Type (LTB or UTB)
-
Back Button for easy return to Summary Page
💡 Purpose: Provide KPI clarity for decision-makers and ensure transparent reporting.
📊 Excel Integration – The Data Backbone
The dashboard connects seamlessly to an Excel workbook with three structured sheets:
📄 Input_Actual Sheet:
-
Columns: KPI Name | Month | MTD Value | YTD Value
📄 Input_Target Sheet:
-
Columns: KPI Name | Month | MTD Target | YTD Target
📄 KPI Definition Sheet:
-
Columns: KPI Number | KPI Group | KPI Name | Unit | Formula | Definition | Type
💡 Benefit: Any data updates in Excel automatically refresh visuals in Power BI — ensuring live, accurate insights.
🌟 Advantages of the Medical Equipment Manufacturing KPI Dashboard
✅ Centralized Monitoring: Access production, quality, and compliance KPIs in one place.
📈 Real-Time Insights: Instantly view performance trends using live Power BI visuals.
💡 Better Decision-Making: Identify underperforming areas through color-coded metrics.
📉 Reduced Manual Reporting: Automate repetitive data preparation tasks.
📊 Comparative Analysis: View Current vs Target and Current vs Previous Year progress.
⚙️ Seamless Integration: Connects easily with Excel, SQL, or ERP systems.
💼 Professional Design: Perfect for management reporting and performance reviews.
💡 Key KPIs to Track
🏭 Production KPIs:
-
Production Yield (%)
-
Downtime Hours
-
Equipment Utilization (%)
🧪 Quality KPIs:
-
Defect Rate (%)
-
Rework %
-
Complaint Resolution Time (Hours)
📦 Supply Chain KPIs:
-
On-Time Delivery (%)
-
Vendor Performance (%)
-
Production Cost per Unit
🛠️ Maintenance KPIs:
-
Mean Time Between Failures (MTBF)
-
Mean Time to Repair (MTTR)
💡 All KPIs are fully customizable based on your manufacturing operations.
🧠 Best Practices for Using the Dashboard
📅 Update Actual and Target data monthly in Excel.
🔁 Refresh Power BI visuals regularly for up-to-date insights.
🎨 Use conditional formatting wisely for clarity.
🧩 Maintain consistent KPI definitions across departments.
🔐 Protect sensitive financial or quality data using role-based access.
📊 Schedule periodic dashboard reviews with key stakeholders.
👩💼 Who Can Benefit from This Dashboard
🏭 Production Managers
🧪 Quality Assurance Teams
⚙️ Maintenance Engineers
📦 Supply Chain Managers
💼 Executives and Plant Directors
🧩 Conclusion
The Medical Equipment Manufacturing KPI Dashboard in Power BI is more than just a reporting tool — it’s a complete performance intelligence solution.
By consolidating data across production, quality, and maintenance, it provides real-time insights that empower teams to improve efficiency, compliance, and profitability.
No coding. No complexity. Just powerful analytics, ready to use.
🏥 Measure smarter. Manufacture better. Deliver safer — with NextGen Templates’ Medical Equipment Manufacturing KPI Dashboard in Power BI.


Reviews
There are no reviews yet.