Managing digital marketing performance across multiple platforms can quickly become overwhelming. Marketing teams often work with data from Google Ads, Facebook Ads, SEO tools, analytics platforms, and campaign reports. When this data is scattered across spreadsheets and dashboards, it becomes difficult to track revenue, spending, conversions, impressions, and overall campaign performance.
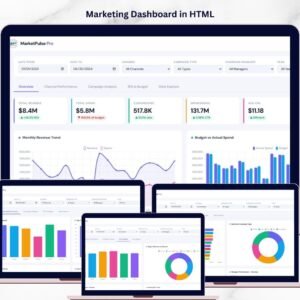
The Marketing Dashboard in HTML solves this challenge by providing a modern, interactive, and browser-based analytics dashboard that consolidates marketing data into one centralized system. This ready-to-use HTML dashboard enables businesses to monitor campaign performance, analyze channel effectiveness, evaluate ROI, and track budget allocation in a clean and professional interface.
Because the dashboard is built using HTML, it offers fast loading performance, smooth navigation between pages, and a visually appealing layout that works directly in any modern web browser. Marketing managers, analysts, and agencies can quickly explore marketing data through interactive filters, KPI cards, charts, and detailed campaign records.
With this dashboard, businesses can instantly evaluate marketing efficiency, identify high-performing campaigns, and optimize budget allocation to maximize returns. Whether you manage digital advertising campaigns, social media marketing, or multi-channel marketing strategies, the Marketing Dashboard in HTML provides powerful analytics to support better decision-making.
🚀 Key Feature of Marketing Dashboard in HTML
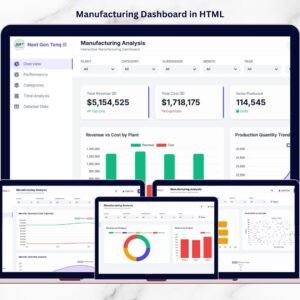
📊 Interactive Marketing Analytics Dashboard
Monitor marketing KPIs such as revenue, spend, conversions, impressions, CTR, and ROI in one centralized system.
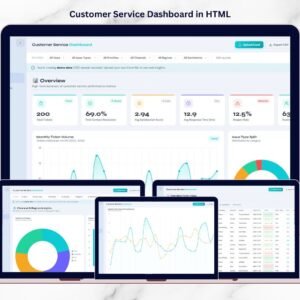
🌐 Browser-Based Reporting Interface
The HTML dashboard runs directly in a web browser with a clean and modern design.
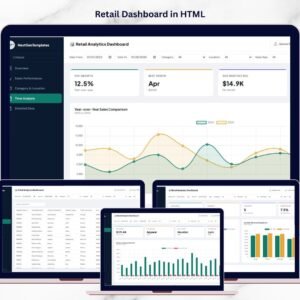
📅 Advanced Filter Controls
Filter reports using Date Range, Channel, Campaign Type, Campaign Manager, and Year.
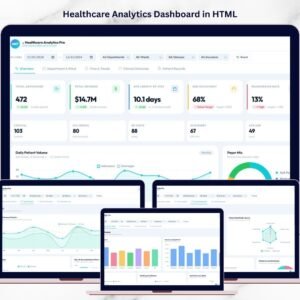
📈 Comprehensive KPI Cards
Quickly view high-level marketing metrics including Total Revenue, Total Spend, Conversions, Impressions, Average CPA, and Campaign Count.
📊 Multi-Page Marketing Analytics
Dedicated pages provide insights for Overview, Channel Performance, Campaign Analysis, ROI & Budget, and Data Explorer.
💰 Budget vs Spend Analysis
Track marketing budgets and compare them against actual spending.
📉 ROI & Profitability Tracking
Evaluate marketing return on investment across campaigns and channels.
🔎 Campaign Data Explorer
Review detailed campaign records using a searchable and exportable data table.
⚡ Fast and Professional Dashboard Interface
Smooth navigation and responsive design create a professional reporting experience.
📦 What’s Inside the Marketing Dashboard in HTML
This digital dashboard template includes multiple analytical pages designed to provide deep marketing insights.
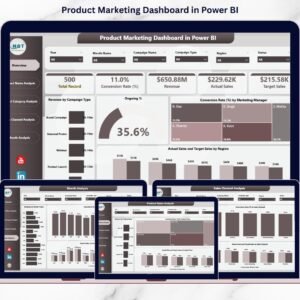
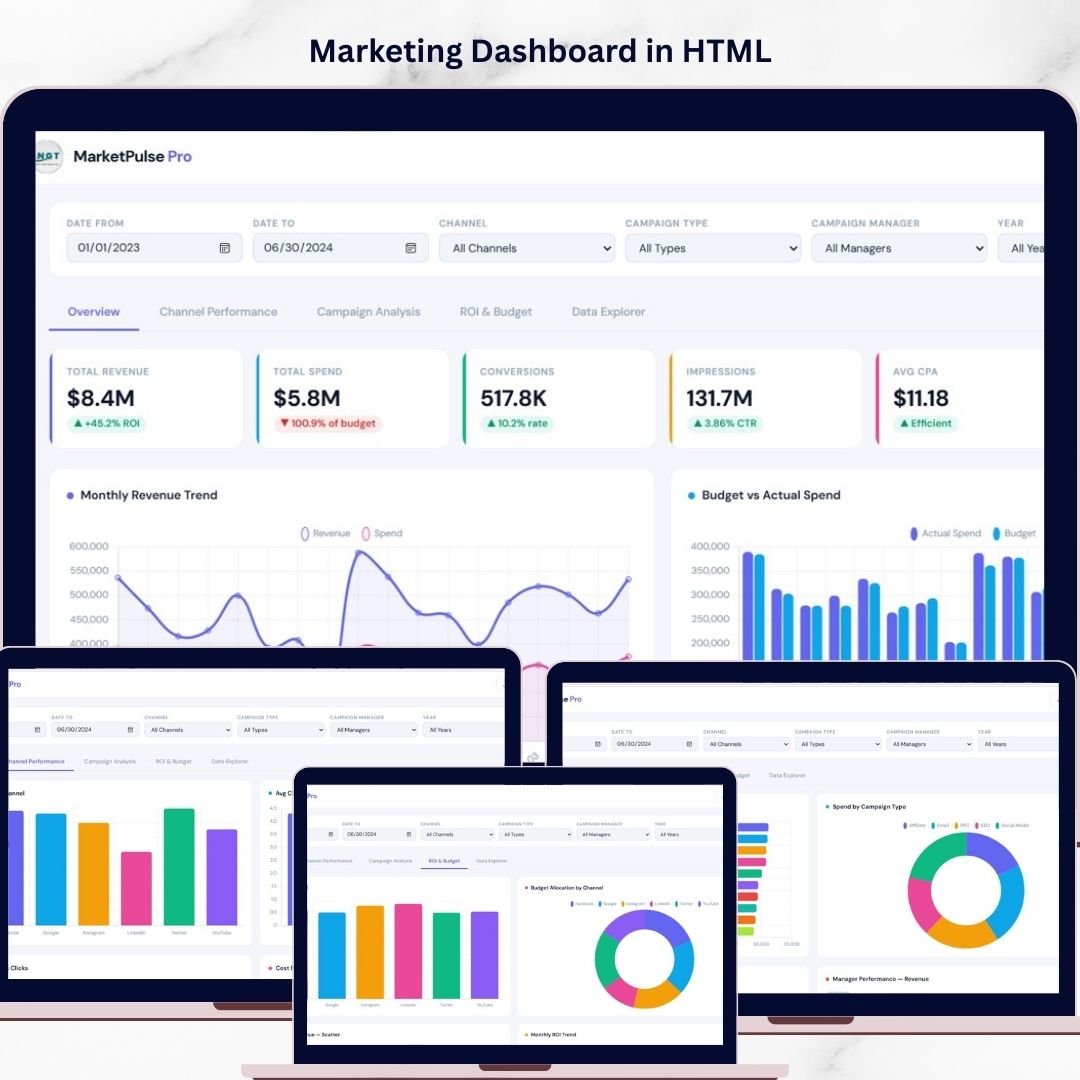
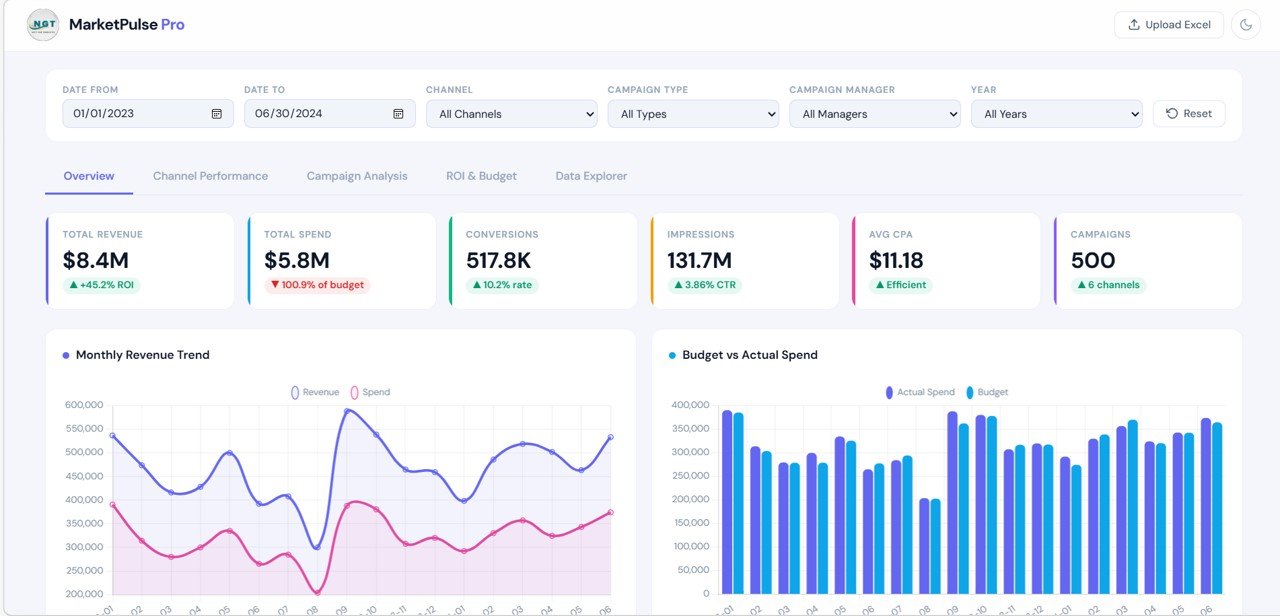
1️⃣ Overview Page
The Overview Page provides a high-level snapshot of marketing performance.
It includes KPI cards showing:
-
Total Revenue
-
Total Spend
-
Conversions
-
Impressions
-
Average CPA
-
Campaign Count
The page also contains several analytical charts including:
-
Monthly Revenue Trend
-
Revenue vs Spend Comparison
-
Budget vs Actual Spend
These visuals allow marketing teams to quickly assess overall campaign performance.
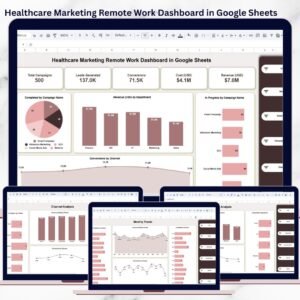
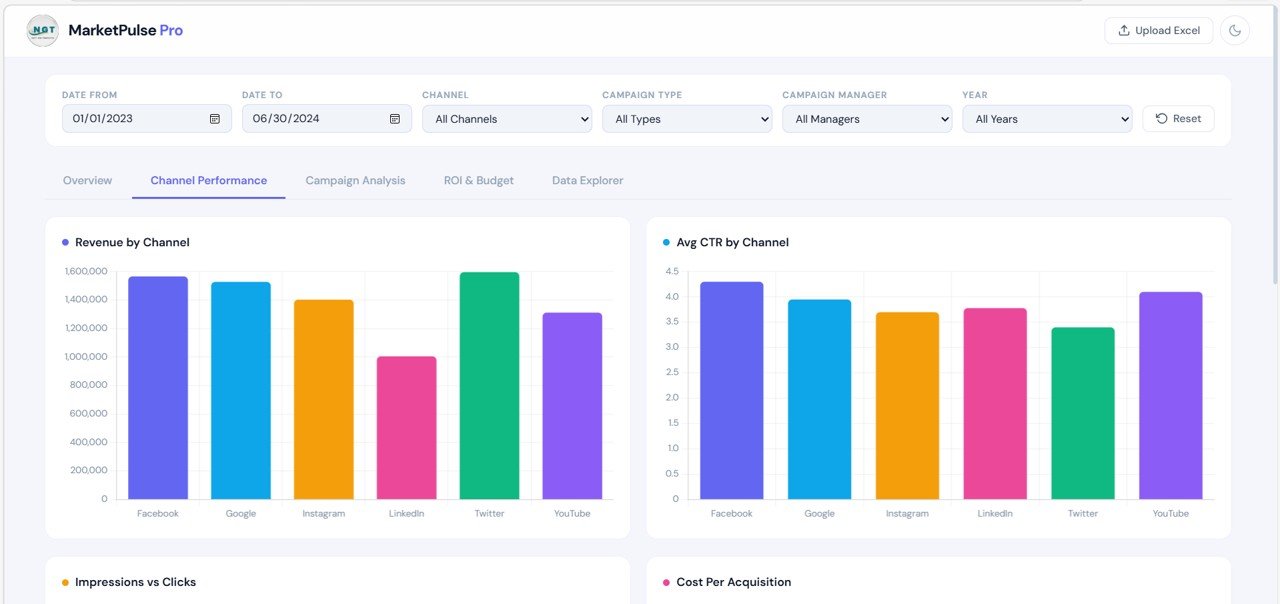
2️⃣ Channel Performance Page
The Channel Performance Page analyzes performance across marketing channels such as Google Ads, Facebook Ads, LinkedIn, SEO, Email, and more.
Charts included:
-
Revenue by Channel
-
Average CTR by Channel
-
Impressions vs Clicks
-
Cost Per Acquisition by Channel
This page helps businesses determine which channels generate the highest revenue and deliver the best marketing efficiency.
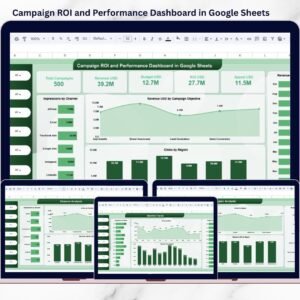
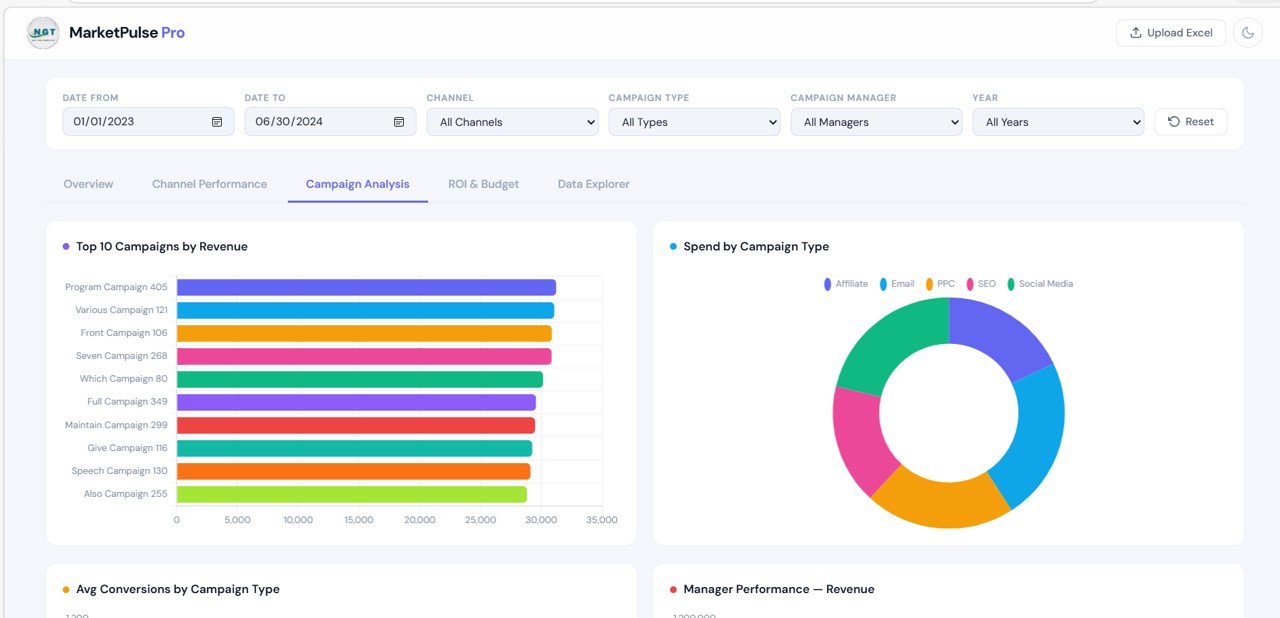
3️⃣ Campaign Analysis Page
The Campaign Analysis Page evaluates marketing performance at the campaign level.
Charts included:
-
Top 10 Campaigns by Revenue
-
Spend by Campaign Type
-
Average Conversions by Campaign Type
-
Manager Performance by Revenue
This page helps organizations identify their best-performing campaigns and top-performing campaign managers.
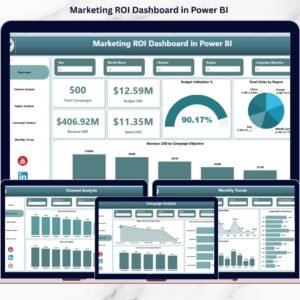
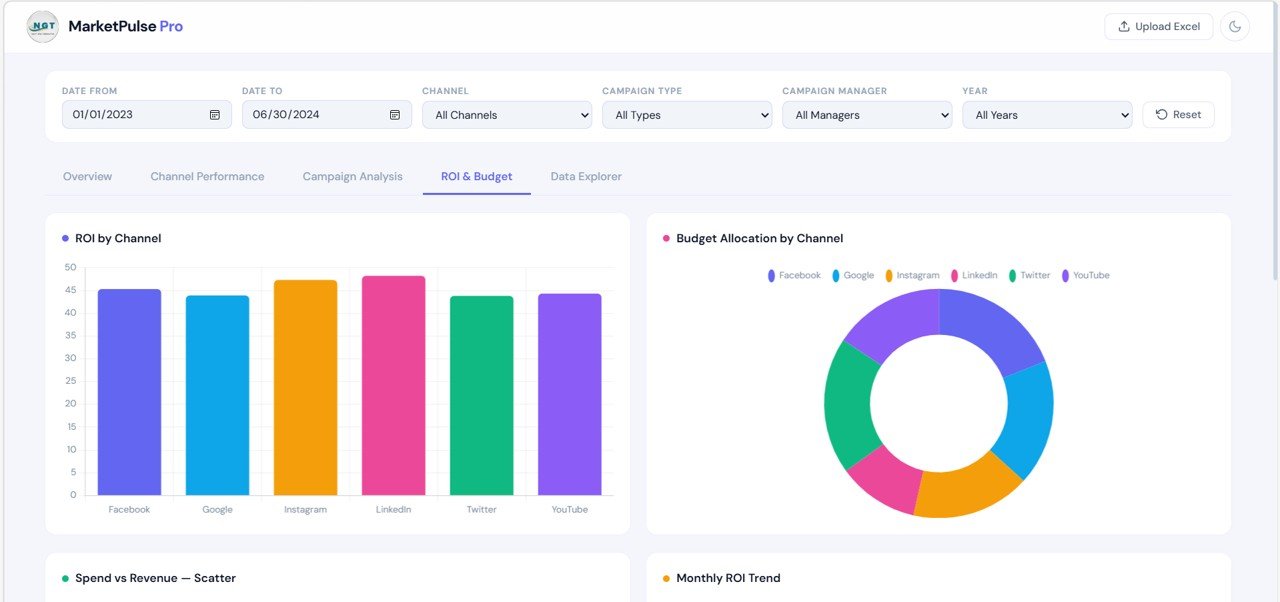
4️⃣ ROI & Budget Page
The ROI & Budget Page focuses on marketing profitability and budget efficiency.
Charts included:
-
ROI by Channel
-
Budget Allocation by Channel
-
Spend vs Revenue Scatter Chart
-
Monthly ROI Trend
These insights help marketing teams allocate budgets strategically and improve campaign returns.
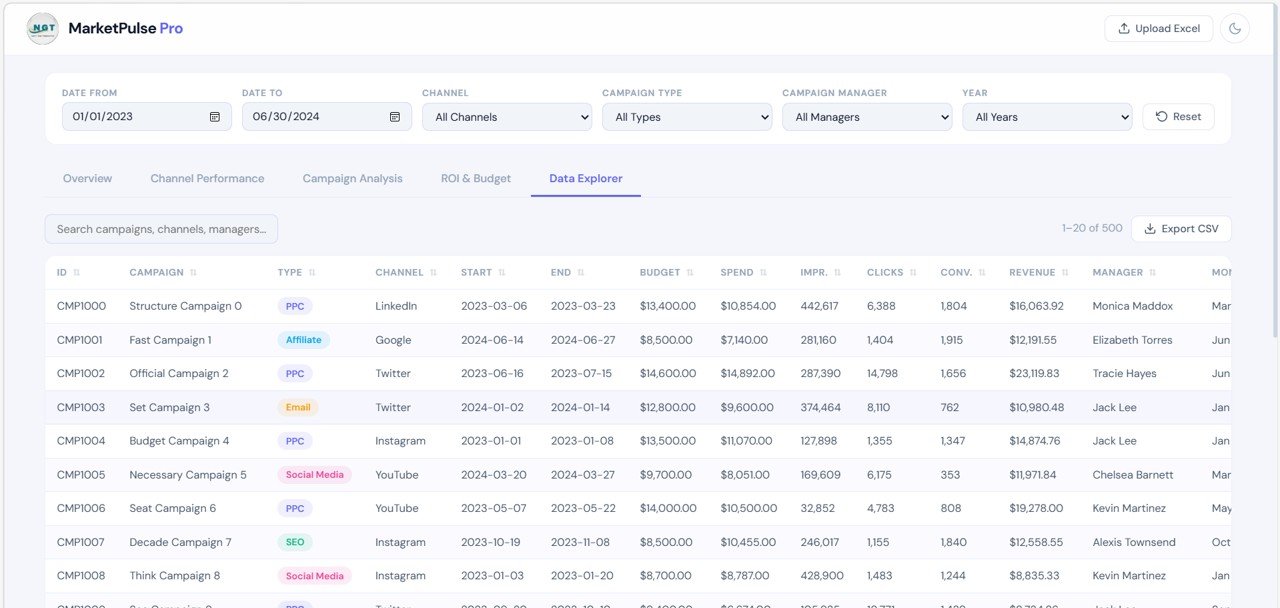
5️⃣ Data Explorer Page
The Data Explorer Page provides a detailed table of marketing campaign records.
Features include:
-
Search box for quick record lookup
-
Export CSV option
-
Structured campaign listing table
Typical data fields include:
-
Campaign ID
-
Campaign Name
-
Channel
-
Campaign Type
-
Budget
-
Spend
-
Impressions
-
Clicks
-
Conversions
-
Revenue
-
Manager
-
Campaign Dates
This page allows users to drill down from summary insights to detailed campaign-level analysis.
⚙️ How to Use the Marketing Dashboard in HTML
Using this dashboard is simple and requires no advanced technical skills.
1️⃣ Open the HTML dashboard file in your web browser.
2️⃣ Import or update marketing campaign data in the data source.
3️⃣ Use the top filter panel to select date ranges, campaign managers, channels, or campaign types.
4️⃣ Navigate through the dashboard tabs to explore different marketing insights.
5️⃣ Review detailed campaign records using the Data Explorer page.
Within seconds, you will have a fully interactive marketing analytics dashboard.
🎯 Who Can Benefit from This Marketing Dashboard in HTML
This dashboard is useful for organizations that run digital marketing campaigns.
📈 Marketing Managers – Track campaign performance and optimize marketing strategies.
📊 Digital Marketing Analysts – Analyze channel performance and conversion metrics.
🏢 Marketing Agencies – Present campaign results to clients in a professional dashboard.
🚀 Startup Marketing Teams – Monitor growth metrics and advertising efficiency.
💼 Business Owners – Understand marketing ROI and budget effectiveness.
Because the dashboard provides a complete marketing analytics environment, it becomes a powerful decision-making tool.
Click here to read the Detailed blog post
Watch the step-by-step video tutorial: